Refer to Important disclosures in the last page of this report
Stock DataTarget price (Rp) Rp3,500
Prior TP (Rp) n.a.
Shareprice (Rp) Rp3,050
Upside/downside (%) +14.8
Sharesoutstanding (m) 10,688 Marketcap. (US$ m) 2,258
Axiata Investments (Indonesia) Sdn.
Bhd. 66.4%
PT Indo Premier Sekuritas [email protected] +62 21 5793 1168
Pursuing growth in outer Java
More optimism on healthier industry competition.
4G expansion in outer Java to drive growth.
Lowest risk from voice and SMS decline among Big 3 Telcos.
Re-initiate with TP Rp3,500 – BUY, 10% discount to 7-yr mean.
Outer Java = Key to further growth.
XL plans to invest c.55% of 2018 capex
in outer Java to reach 4G coverage of 85% of Indonesia’s population by end of
1H19 (vs. currently 65-70%), esp. in Kalimantan, Sumatra, and Sulawesi. We
view this as positive strategy as it will enable XL to grab opportunity from rising
smartphone penetration in outer Java. We expect stable EBITDA margin during
expansion phase to outer Java (2018F/19F at 37%) and then to slightly expand
gradually thereafter. For comparison, XL’s normalized EBITDA margin was 41% in
4Q17, post-acquisition of Axis.
Better data pricing in 2H18F to aid performance.
XL said it has raised data
pricing for certain Axis data packages in May and for XL packages before Lebaran
2018. XL also mentioned its intention to gradually improve data pricing further
after Lebaran based on market’s response. Therefore, we expect revenue growth
to accelerate to +7%YoY in 2019F from flat YoY in 2018F (2H18F +6%HoH),
slightly outpacing our est. for Telkomsel at -2%YoY,
due to short-term pressure of
SIM Card re-registration and relatively competitive 1H18 vs. 2H18F.
Potential opportunity from subscribers’ transition to data.
We think XL
might get slightly better chance to penetrate outer Java in data service compared
to voice and SMS considering that interconnection cost does not apply in data and
less dependency to one mobile phone number to use data. Furthermore, XL also
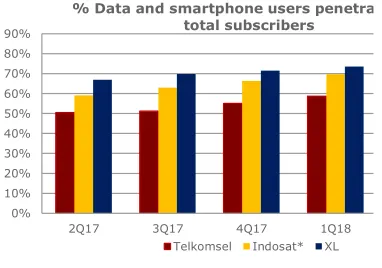
benefited from being a more data-centric company (based on data user
penetration and data revenue contribution as shown in Figure 1-2) among Big 3
Telcos. We expect 2018F/19F strong data traffic growth of 76/69%YoY (vs.
Telkomsel 77/49%YoY) and increase in mobile data revenue contribution to
68/76% (above Telkomsel 48/56%).
Re-initiate at BUY with TP of Rp3,500.
We rolled over our valuation to 2019.
Our DCF-based TP assumed WACC of 12.5% (Fig 8). Our target 2019 EV/EBITDA
for XL is 5.5x, 10% discount to 7-year mean and 25% discount to TLKM (adj. for
% ownership in Telkomsel). XL trades at 2019EV/EBITDA of 5x, at -1STD below
its 7-yr mean and 32% discount to TLKM. We expect XL to achieve core profit
breakeven when its outer Java expansion makes its full-year impact in 2020. Our
TP translates to 2020EV/EBITDA of 5x, similar to EXCL’s -1STD below 7-yr mean.
Downside risk: Time lag until more certainty in growth outlook after tightening of
starter pack registration.
Source: EXCL, IndoPremier Share Price Closing as of :8-August-2018
2
Refer to Important disclosures in the last page of this report
Fig. 1: Big 3 Telcos’ Data and smartphone portion of total subs.
Fig. 2: Big 3 Telcos’ Data revenue portion to total revenue
0%
% Data and smartphone users penetra total subscribers
Telkomsel Indosat* XL
*) 2Q18 smartphone and data user penetration of Telkomsel and XL were 63% and 77% respectively.
2Q17 3Q17 4Q17 1Q18 2Q18
Data contribution to total net-revenue
Telkomsel* Indosat** XL
*) Telkomsel’s data revenue contribution to total Telkomsel’s revenue
Source: Companies, IndoPremier Source: Companies, IndoPremier
Fig. 3: XL’s data revenue and effective yield Fig. 4: XL fw-hist. EV/EBITDA (3 Aug Jul 2018: 4.5x)
0
Data revenue (LHS) Effective yield (RHS)
3
Fw-EV/EBITDA Fw-EV/EBITDA avg Fw-EV/EBITDA + 1 STD Fw-EV/EBITDA -1 STD Fw-EV/EBITDA - 2 STD Fw-EV/EBITDA + 2 STD
-2STD 4.0 -1STD 5.1 Avg 6.1 +1STD 7.2 +2STD 8.3
3
Refer to Important disclosures in the last page of this report
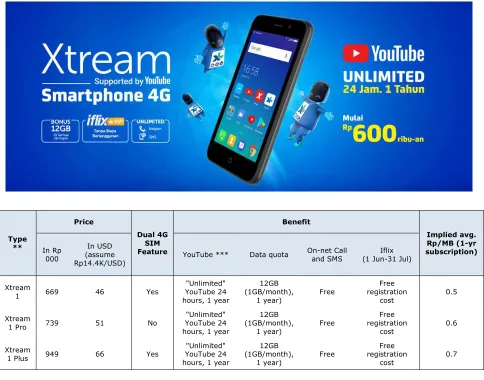
Fig. 5: Xtream smartphone package*Type
*) Terms and Conditions Applied
**) All with RAM 1GB / ROM 8GB specification.
***) FUP (Fair Usage Policy) 5GB/day according to Tribun News. Different FUP might apply in different area and/or time of observation. ^ (Smartphone price/12month + monthly top up Rp 25K) / (30x 5GB + 1GB)
Note:
Evercoss previously (Apr 2018) said the result was above expectation as three weeks after launched, Xtream 1 and 1 Plus (sales) reached 50K units (mostly reached via Evercoss channel), 2.5x initial target of 20K units. Evercoss targets Oct’18 sales volume for those 2 series at 300K units.
Source: Company, IndoPremier, Merdeka.com, Tribun News
Strategy to grow early adopter of 4G
XL’s “Xtream” smartphone bundled package is resulted from cooperation between
XL, “Evercoss” (smartphone brand), and YouTube. This bundled package (requires
monthly top-up for 1 year) was launched in Apr 2018. The cheapest smartphone
package priced Rp669K (c.16% of avg. monthly 2017 GDP per capita).
Based on the XL’s product description, Xtream smartphone is available in stores
and 6 popular e-commerce channels: Tokopedia, Lazada, Bukalapak, Blibli,
MatahariMall, and Shopee. We found cheaper price for Xtream 1 in one of sellers in
BukaLapak e-commerce (c. 16% cheaper than price mentioned in Figure 5) which
also allows 0% instalment for 12 month at Rp47K/month, relatively affordable
enough to trigger wider penetration of 4G users in Indonesia, in our view.
4
Refer to Important disclosures in the last page of this report
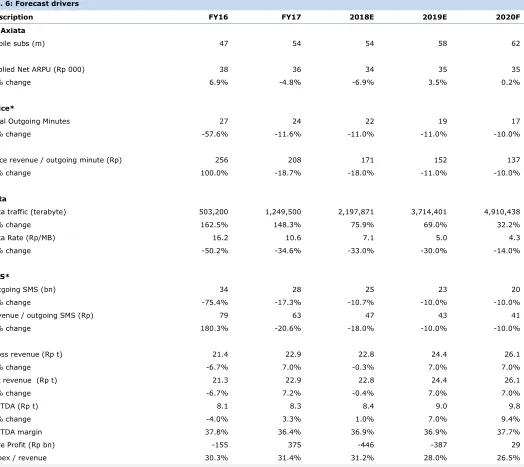
Fig. 6: Forecast driversDescription FY16 FY17 2018E 2019E 2020F
XL Axiata
Mobile subs (m) 47 54 54 58 62
Implied Net ARPU (Rp 000) 38 36 34 35 35
% change 6.9% -4.8% -6.9% 3.5% 0.2%
Voice*
Total Outgoing Minutes 27 24 22 19 17
% change -57.6% -11.6% -11.0% -11.0% -10.0%
Voice revenue / outgoing minute (Rp) 256 208 171 152 137
% change 100.0% -18.7% -18.0% -11.0% -10.0%
Data
Data traffic (terabyte) 503,200 1,249,500 2,197,871 3,714,401 4,910,438
% change 162.5% 148.3% 75.9% 69.0% 32.2%
Data Rate (Rp/MB) 16.2 10.6 7.1 5.0 4.3
% change -50.2% -34.6% -33.0% -30.0% -14.0%
SMS*
Outgoing SMS (bn) 34 28 25 23 20
% change -75.4% -17.3% -10.7% -10.0% -10.0%
Revenue / outgoing SMS (Rp) 79 63 47 43 41
% change 180.3% -20.6% -18.0% -10.0% -10.0%
Gross revenue (Rp t) 21.4 22.9 22.8 24.4 26.1
% change -6.7% 7.0% -0.3% 7.0% 7.0%
Net revenue (Rp t) 21.3 22.9 22.8 24.4 26.1
% change -6.7% 7.2% -0.4% 7.0% 7.0%
EBITDA (Rp t) 8.1 8.3 8.4 9.0 9.8
% change -4.0% 3.3% 1.0% 7.0% 9.4%
EBITDA margin 37.8% 36.4% 36.9% 36.9% 37.7%
Core Profit (Rp bn) -155 375 -446 -387 29
Capex / revenue 30.3% 31.4% 31.2% 28.0% 26.5%
*) Voice and SMS figures are estimate. Starting 2Q16, voice and SMS traffic were not disclosed by company. **) Our 2H18F effective data yield is Rp6.8/MB (lower than 1H17 Rp7.5/MB, but similar to 2Q18).
5
Refer to Important disclosures in the last page of this report
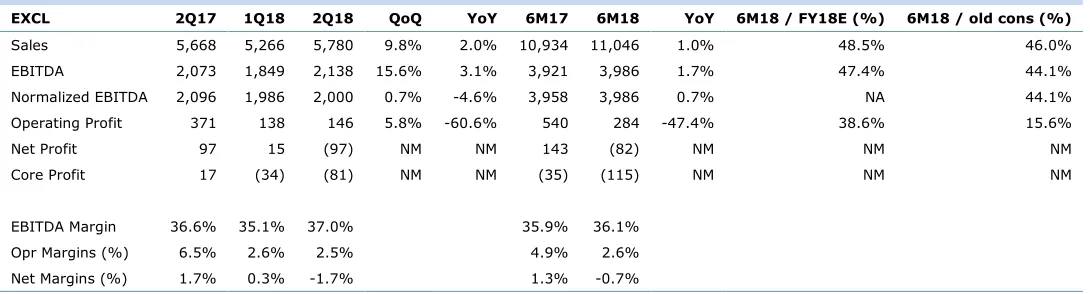
Fig. 7: 2Q18 resultsEXCL 2Q17 1Q18 2Q18 QoQ YoY 6M17 6M18 YoY 6M18 / FY18E (%) 6M18 / old cons (%)
Fig. 8: Risk-free-rate and terminal EV/EBITDA assumption
Risk-Free rate 7.5%
Equity market risk premium 6.0%
Beta 1.3 2-year Beta
Cost of equity 15.4%
Post-tax cost of debt 7.9%
Debt/Capital ratio 38%
WACC 12.5%
Terminal EV/EBITDA 5.6
Source: Company, IndoPremier, Bloomberg
Potential acceleration in long-term EBITDA growth.
There might be short-term pressure in share price as we conservatively estimate
2018/19 EBITDA at below cons. However, we assume investors will eventually
focus on higher EBITDA growth trajectory in the future from: 1) Growing data
demand in Indonesia; 2) Lower uncertainties post-SIM card registration; 3) Growth
opportunity in outer Java. Moreover, consensus’ est. might be less dependable for
now considering relatively substantial variance between cons’ 18F/19F EBITDA low
end (14/23% above) to high end.
Risks
Upside risk:
Stronger than expected data demand, faster than expected return
from investment in data network (and/or core profit turnaround), significantly
stronger trend in Rupiah vs. USD, further potential upside considering XL’s highest
share price last year (before market gradually pricing in intense price competition
in 3Q17 and SIM card registration) was Rp4,020, c.32% above current share price.
Downside risk
: Short-term forex risk, unsustainable improvement in data yield.
XL’s USD debt accounted 31% of total debt as of 2Q18, with maturity in 2019. The
company hedged USD debt (for principal) at c.Rp14.6k/USD based on 2Q18
disclosure.
6
Refer to Important disclosures in the last page of this report
Year To 31 Dec (RpBn) 2016A 2017A 2018F 2019F 2020F
Income Statement
Net Revenue 21,341 22,876 22,778 24,372 26,084
Cost of Sales 0 0 0 0 0
Gross Profit 21,341 22,876 22,778 24,372 26,084 SG&A Expenses (21,329) (21,505) (22,042) (23,488) (24,777) Operating Profit 12 1,370 735 883 1,308 Net Interest (1,533) (1,295) (1,330) (1,399) (1,270) Forex Gain (Loss) 351 (30) 0 0 0 Others-Net 1,355 176 587 587 457 Pre-Tax Income 186 221 (8) 71 495
Income Tax 190 154 2 (18) (124)
Minorities 0 0 0 0 0
Net Income 375 375 (6) 53 371
Balance Sheet
Cash & Equivalent 1,400 2,455 1,068 1,245 1,341
Receivable 663 809 802 865 913
Inventory 161 143 157 164 173
Other Current Assets 4,583 3,773 4,305 4,451 4,733 Total Current Assets 6,807 7,181 6,332 6,726 7,160
Fixed Assets - Net 33,183 34,934 33,315 30,914 28,211 Goodwill 6,681 6,681 6,681 6,681 6,681 Non Current Assets 8,056 7,525 8,541 9,473 9,568 Total Assets 54,896 56,321 54,869 53,795 51,621
ST Loans 0 0 0 0 0
Payable 6,503 7,476 0 7,695 8,236
Other Payables 4,329 3,979 3,244 2,939 3,109 Current Portion of LT Loans 3,645 3,771 4,140 4,575 0
Total Current Liab. 14,477 15,227 14,576 15,210 11,345
Long Term Loans 11,026 10,980 10,238 8,663 9,863 Other LT Liab. 8,184 8,484 8,431 8,129 8,259 Total Liabilities 33,687 34,691 33,245 32,001 29,467
Equity 13,208 13,226 13,226 13,226 13,226 Retained Earnings 8,002 8,405 8,399 8,568 8,927
Minority Interest 0 0 0 0 0
Total SHE + Minority Int. 21,209 21,631 21,625 21,794 22,153 Total Liabilities & Equity 54,896 56,321 54,869 53,795 51,621
7
Refer to Important disclosures in the last page of this report
Year to 31 Dec 2016A 2017A 2018F 2019F 2020F
Cash Flow
Net Income (Excl.Extraordinary&Min.Int) 375 375 (6) 53 371
Depr. & Amortization 7,064 6,167 6,871 7,298 7,637 Changes in Working Capital 1,178 1,147 (503) 363 312
Others 868 833 1,265 552 990
Cash Flow From Operating 9,486 8,522 7,626 8,266 9,309 Capital Expenditure (6,401) (7,387) (6,267) (5,829) (5,029)
Others 201 413 189 81 94
Cash Flow From Investing (6,200) (6,974) (6,078) (5,748) (4,935) Loans (5,385) 80 (373) (1,140) (3,375)
Equity 6,721 18 0 0 0
Dividends 0 0 0 116 (11)
Others (6,251) (1,119) (1,760) (1,816) (1,344) Cash Flow From Financing (4,915) (1,021) (2,134) (2,840) (4,730) Changes in Cash (1,630) 527 (585) (322) (355)
Financial Ratios
Gross Margin (%) 100.0 100.0 100.0 100.0 100.0 Operating Margin (%) 0.1 6.0 3.2 3.6 5.0 Pre-Tax Margin (%) 0.9 1.0 0.0 0.3 1.9
Net Margin (%) 1.8 1.6 0.0 0.2 1.4
ROA (%) 0.7 0.7 0.0 0.1 0.7
ROE (%) 2.1 1.8 0.0 0.2 1.7
ROIC (%) 1.8 1.7 0.5 0.4 1.4
Acct. Receivables TO (days) 13.5 10.3 10.4 10.3 10.2 Acct. Receivables - Other TO (days) 3.1 2.8 2.5 2.2 2.3 Inventory TO (days) 0.0 0.0 0.0 0.0 0.0 Payable TO (days) 0.0 0.0 0.0 0.0 0.0 Acct. Payables - Other TO (days) 0.0 0.0 0.0 0.0 0.0
Debt to Equity (%) 69.2 68.2 66.5 60.7 44.5 Interest Coverage Ratio (x) 147.0 1.1 2.1 1.7 1.0 Net Gearing (%) 62.6 56.8 61.5 55.0 38.5
Head Office
PT INDO PREMIER SEKURITAS
Wisma GKBI 7/F Suite 718
Jl. Jend. Sudirman No.28
Jakarta 10210 - Indonesia
p +62.21.5793.1168
f +62.21.5793.1167
INVESTMENT RATINGS
BUY : Expected total return of 10% or more within a 12-month period
HOLD : Expected total return between -10% and 10% within a 12-month period
SELL : Expected total return of -10% or worse within a 12-month period
ANALYSTS CERTIFICATION.
The views expressed in this research report accurately reflect the analysts personal views about any and all of the subject securities or issuers; and no part of the research analyst's compensation was, is, or will be, directly or indirectly, related to the specific recommendations or views expressed in the report.
DISCLAIMERS