© The Author 2015. Published by Oxford University Press on behalf of the American Association for Public Opinion Research. All rights reserved. For permissions, please e-mail: [email protected]
EFFECTS OF SEQUENTIAL PREPAID INCENTIVES AND
ENVELOPE MESSAGING IN MAIL SURVEYS
JENNIFER DYKEMA* KAREN JAQUES KRISTEN CYFFKA NADIA ASSAD
RAE GANCI HAMMERS KELLY ELVER
KRISTEN C. MALECKI JOHN STEVENSON
Abstract As researchers increasingly use mail survey methods to collect health and other data, research focused on optimizing features of survey design and administration in cost-effective ways is needed. We conducted two studies to examine the effects of sequential prepaid
Jennifer Dykema is a senior scientist and survey methodologist at the University of Wisconsin Survey Center, Madison, WI, USA. Karen Jaques is a project director at the University of Wisconsin Survey Center, Madison, WI, USA. Kristen Cyffka is a doctoral fellow at the Max Planck Institute for Demographic Research, Rostock, Germany. Nadia Assad is a project direc-tor at the University of Wisconsin Survey Center, Madison, WI, USA. Rae Ganci Hammers is a designer at Firepower Design Company, Madison, WI, USA. Kelly Elver is the project man-agement director at the University of Wisconsin Survey Center, Madison, WI, USA. Kristen C. Malecki is an assistant professor in the Department of Population Health Sciences at the University of Wisconsin–Madison, Madison, WI, USA. John Stevenson is the associate director of the University of Wisconsin Survey Center, Madison, WI, USA. The authors thank the SHOW Study and the SHOW study team (www.show.wisc.edu) for including these experiments. SHOW is funded by Wisconsin Partnership Program PERC Award [233 PRJ 25DJ to Javier Nieto], National Institutes of Health’s Clinical and Translational Science Award [5UL 1RR025011 to Javier Nieto], and National Heart Lung and Blood Institute [1 RC2 HL101468 to Mark Drezner]. Funding for this project was also provided by the Centers for Disease Control and Prevention Program—Communities Putting Prevention to Work. Resources were made available in partner-ship with the Wisconsin Department of Health Services, the Wood County Health Department, and the La Crosse County Health Department. Additional support was provided by the University of Wisconsin Survey Center (UWSC), which receives support from the College of Letters and Science at the University of Wisconsin–Madison. The authors also thank Nora Cate Schaeffer and Steven Blixt for providing comments on an earlier draft. Opinions expressed here are those of the authors and do not necessarily reflect those of the sponsors or related organizations. *Address correspondence to Jennifer Dykema, University of Wisconsin Survey Center, University of Wisconsin–Madison, 475 N. Charter Street, Room 4308, Madison, WI 53706, USA; e-mail:
doi:10.1093/poq/nfv041 Advance Access publication October 12, 2015
at Stanford University on February 21, 2016
http://poq.oxfordjournals.org/
incentives and envelope messaging on response rates, item nonresponse, and costs in two mail surveys using address-based samples. Sample members in study 1 were randomly assigned to groups that received a preincentive of $2 versus $5, a second incentive of $0 versus $2 (sent only to nonresponders), and an envelope bearing no message or a monetary-focused message. Results indicated that the $5 preincentive significantly increased response rates, but neither the second incentive nor the mes-sage had an effect. Informed by the results of study 1, study 2 delivered a $2 preincentive to all sample members, but increased the amount of the second incentive to $5. Study 2 also tested a health-focused envelope message. While envelope messaging again failed to motivate participa-tion, the administration of a second incentive, valued at a larger amount than the preincentive, significantly increased response rates. With regard to their effects on item nonresponse, while none of the variables was associated with item-missing levels in study 2, a significant three-way interaction was found in study 1 such that missing data was higher in the presence of a monetary message when a $2 preincentive was paired with a $2 second incentive. Cost analyses indicated that while larger incen-tives increased response rates, they also increased costs.
Introduction
Declines in response rates and loss of coverage for RDD telephone surveys have compromised their ability to obtain high-quality health-related estimates
(Blumberg and Luke 2015). Furthermore, the distribution of cell phone
num-bers limits researchers’ ability to sample effectively and efficiently when con-ducting phone surveys in smaller geographic units, such as cities or counties. These trends have increased the likelihood that researchers concerned with measuring health and other outcomes in the general population will con-duct some or all of their data collection through the mail (Stern, Bilgen, and
Dillman 2014). Researchers in the United States can sample households in the
general population through licensed vendors authorized to use the US Postal Service’s Computerized Delivery Sequence File (CDSF)—a database contain-ing all addresses to which the post office delivers—and address-based sam-pling (ABS) methods (Brick, Williams, and Montaquila 2011; Iannacchione 2011). Research confirms the viability of collecting data using an ABS frame and mail survey methods (Link et al. 2008).
However, while much is already known about ways to optimize response rates for mail surveys (Dillman 2007), the environment in which they are con-ducted has changed. Prior to the availability of data from the CDSF, mail sur-veys relied primarily on samples generated from lists in which there was likely a relationship between the named individual and sponsor or organization con-ducting the study. With ABS, researchers can survey the general population
Incentives and Envelope Messages 907
at Stanford University on February 21, 2016
http://poq.oxfordjournals.org/
with geographic precision, even where no such prior relationship exists. Thus, while the quality of coverage for households has increased, it may be more difficult and less effective to implement strategies associated with increasing response rates, such as personalizing contacts. As investigators increasingly collect survey data through the mail, research focused on optimizing features of the design and administration of mail surveys in a cost-effective manner in this new environment is needed.
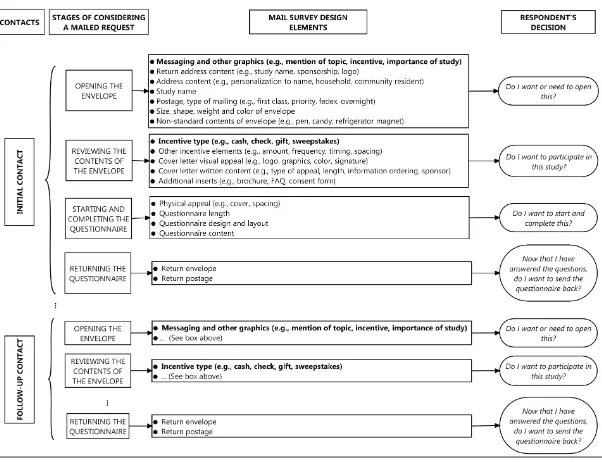
Unlike interviewer-administered surveys for which we might observe or record interaction between the interviewer and sample member, or web sur-veys for which we can monitor participation using paradata, we are unable to directly observe the process that sample members undergo in deciding to participate in a mail survey. In figure 1, we decompose the many different points at which sample members make decisions about participating. At each decision point, multiple elements related to a study’s design likely act in con-cert to influence participation, and represent variables that could be tailored to increase participation and data quality. The purpose of the current research was to examine the effects of incentives and envelope messaging on response rates, item nonresponse, and costs when surveying general population samples about health by mail using ABS.
Figure 1. Respondent Decision-Making Stages and Design Elements in a Mail Survey.
at Stanford University on February 21, 2016
http://poq.oxfordjournals.org/
THEORETICAL FRAMEWORK FOR CURRENT RESEARCH
Dillman, Smyth, and Christian (2014) draw heavily upon social exchange
theory to explain why people participate or fail to participate in surveys. The theory posits that individuals are more likely to respond positively to a request when they trust that the ratio of rewards to costs will be personally accept-able. The theory is particularly well suited for explaining the effectiveness of prepaid, token incentives, which likely invoke a “norm of reciprocity,” a feeling of obligation to give back by completing the survey (Gouldner 1960). Applying the principles of social exchange, Dillman, Smyth, and Christian
(2014, p. 424) recently extended their recommendations about incentives to
advise researchers to include a second cash incentive in a follow-up contact in order to increase the likelihood that “later communications will be read, and hopefully acted upon, thereby increasing overall response.”
In contrast to social exchange, leverage-saliency theory offers a useful framework for explaining why small increases in an incentive’s amount can lead to significant increases in response rates. Leverage-saliency theory holds that decisions about participation are contingent upon subjective weights that sample members ascribe to features of the survey request (e.g., incentive, study topic), which tilt members toward participating or not (Groves, Singer, and
Corning 2000). These features can vary based on their perceived valence
(pos-itive or negative), the relative importance sample members attribute to them, and how salient they are made during the request to participate. The theory predicts that features like incentives can be used to leverage a sample mem-ber’s participation, particularly if the member is less inclined to participate.
A unifying objective of our research was to determine if we could enhance the positive effect of factors that increase response rates, such as incentives and health as a topic, by printing messages referring to these factors on the enve-lope. We sought to increase the likelihood of responding by making these fac-tors more visible earlier in the decision-making process (figure 1). Including a message on the outside of the envelope has the potential to increase the sali-ency of the message by increasing the message’s visibility. A message focused on the monetary contents of the envelope, for example, could increase the respondent’s level of trust that the benefits of participating will be yielded and that the research being conducted is important. Additionally, we sought to explore conditions under which a second incentive—sent to nonresponding sample members—might be effective. Finally, we varied incentive amounts in order to see if slightly larger but still token-level amounts would tip the scales toward participation among reluctant sample members.
RESEARCH ON INCENTIVES IN MAIL SURVEYS
A substantial literature demonstrates that incentives are likely to increase response rates for mailed surveys, particularly when they are prepaid (versus contingent upon completion and return of the survey) and monetary (versus a
Incentives and Envelope Messages 909
at Stanford University on February 21, 2016
http://poq.oxfordjournals.org/
nonmonetary gift) (Church 1993; Edwards et al. 2002; Singer and Ye 2013). Researchers have also documented a positive association between the incen-tive’s value and increases in responses (Church 1993; Trussell and Lavarakas 2004). However, while response rates tend to rise as amounts increase, research has identified thresholds at which additional increases in amounts are not associated with increased participation (Edwards et al. 2005).
Incentives may also induce participation from reluctant or nonresponding sample members. While researchers have made use of differential incentives to convert nonresponders in interviewer-administered surveys, few studies have directly experimented with including additional prepaid incentives to convert nonresponders in a single-phase mail survey (Dillman, Smyth, and Christian 2014). In an early study, Furse, Stewart, and Rados (1981) reported that levels of participation were similar regardless of whether a prepaid incentive of 50 cents was offered in an initial, follow-up, or both mailings. In contrast, Messer
and Dillman (2011) experimented with methods to push sample members to
complete surveys online using postal mailings, and compared web/mail meth-ods to more traditional mail modes, including a set of experiments in which nonresponders were sent an additional $5 incentive in a priority mailing. They found that sending the second $5 incentive in a priority mailing significantly increased response rates by 9 percentage points, in contrast to sending either the initial $5 incentive only or the follow-up priority mailing only (see, too,
Moore and An [2001]).
Studies from more complicated mail survey designs are also instructive.
Kropf and Blair (2005) reported that the inclusion of a $5 incentive in a
non-response follow-up survey sent to a random subsample of nonresponders to a health-related mail survey increased participation compared to a group that was re-contacted without an incentive.1Han, Montaquila, and Brick (2013) examined different incentive structures in a two-phase ABS mail survey design. In phase one, sampled households were mailed a screening question-naire along with a $2 or $5 preincentive to determine their eligibility. The second phase, which included the full questionnaire and a second incentive of $0, $5, $10, $15, or $20, was sent to households that completed the screener and were deemed eligible. Results indicated that while the initial $5 incentive increased the response rate for the screener, the effect did not carry over to the full questionnaire phase, and while a second incentive increased response over not including an incentive, larger amounts were not significantly more effective.
Including incentives in mail surveys may have other beneficial effects, such as improving data quality and decreasing survey costs. Although incentives could decrease data quality if they lead reluctant respondents to complete questionnaires hastily or carelessly, most studies find no effect or a positive effect of incentives on measures of data quality (Singer and Ye 2013). For
1. Researchers did not send an incentive to sample members in the initial phase of the study.
at Stanford University on February 21, 2016
http://poq.oxfordjournals.org/
example, respondents receiving larger incentives provided more open-ended answers and wrote more comments in a mail survey of consumers (James and
Bolstein 1990). Inclusion of an incentive in the first contact in a mail survey
increases initial costs, but may ultimately reduce costs by decreasing the num-ber of nonrespondents that require additional mailings (Dykema et al. 2012).
RESEARCH ON ENVELOPE MESSAGES IN MAIL SURVEYS
A continued challenge for researchers is ensuring that sample members notice their mailings. This is particularly important when mailings contain cash incentives that could be unwittingly discarded. Results from the Survey of Census Participation revealed that in 65 percent of households some mail was thrown away without being opened (Couper, Mathiowetz, and Singer 1995). The USPS Household Diary Study reported that the percent of their panel members who “usually” do not read mailed advertisements doubled from 9 percent in 1987 to 20 percent in 2012 (Mazzone and Rehman 2013). To avoid having mailings thrown away unread, researchers have explored methods for getting their survey mailings noticed. A large number of studies have tested whether sample members are influenced by the visual aspects of envelopes (e.g., size, color, postage, and written content) (Edwards et al. 2009).
Another potential method to increase sample members’ willingness to open and consider participating in a survey is to include a message or graphic on the envelope. While this technique has been touted by direct marketers as a strategy to increase response to promotional mailings (Dommeyer, Elganayan,
and Umans 1991), best practices in designing mail surveys caution survey
researchers against using these techniques, precisely because they might reduce participation by increasing the likelihood that sample members will mistake a survey mailing for a commercial mailing (Dillman, Smyth, and
Christian 2014).
Research examining the effects of envelope messages on responding to mail surveys has yielded mixed results. Dillman et al. (1996) provided evidence of the positive impact of messaging on participation to the 1990 US Census. Drawing on the social utility of the Census, they contrasted a “benefits” mes-sage (i.e., “It Pays to Be Counted in the Census”) with a second mesmes-sage that stressed the mandatory nature of the Census (i.e., “Your Response Is Required By Law”). While the benefits message did not have an impact on participation, the mandatory message significantly improved completion rates compared to a control group that did not receive a message. Dommeyer, Elganayan, and
Umans (1991) tested the message “Did you know you are entitled to more
money?” in a survey sent to homeowners eligible for an insurance refund. They found that the message increased the response rate by 13 points and brought in younger and lower-income respondents.
Other studies, however, have found negative or no effects. Finn, Gendall,
and Hoek (2004) attempted to make the noncommercial status of their study
Incentives and Envelope Messages 911
at Stanford University on February 21, 2016
http://poq.oxfordjournals.org/
salient by printing “Important survey on New Zealand’s national identity enclosed” on the envelope. Though not significant, this message decreased response by 6 points, possibly because the message allowed sample members to make a decision about participating without opening the envelope. Similarly,
Ziegenfuss et al. (2012) reported that adding a sticker bearing the message
“$25 incentive” had no impact on response rates or on the demographic com-position of a sample of physicians, and McLean et al. (2014) found that the envelope sticker “You can share valuable information to help people with eat-ing disorders” had no effect on respondeat-ing among most demographic groups, with the unfortunate exception of reducing participation among men.
Study 1
EXPERIMENTAL DESIGN
Study 1 was designed to assess the impact of different amounts of preincen-tives, envelope messaging, and the inclusion of a second prepaid incentive on response rates, item nonresponse, and costs. We implemented a 2 x 2 x 2 between-participants factorial design, manipulating the following levels of each factor:
1. Preincentive amount: a) $2; and b) $5.
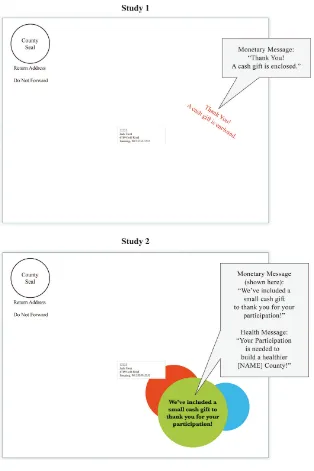
2. Inclusion of an envelope message: a) no message; and b) monetary-focused message (“Thank You! A cash gift is enclosed.”) (see figure 2). If relevant, the message appeared on outgoing envelopes for both the initial and second mailing.
3. Second prepaid incentive: a) none ($0); and b) $2. Only nonresponding households were eligible for the second incentive.
We predicted that the inclusion of following elements would increase response rates: $5 versus $2 preincentive; a monetary-focused message versus no mes-sage; and $2 versus $0 second incentive for nonresponders. We also predicted that the $5 preincentive would be cost effective.
SAMPLE AND DATA COLLECTION
The experiment was embedded in an ancillary study conducted by the Survey of the Health of Wisconsin. A sample of 2,608 household addresses was randomly selected from the USPS Delivery Sequence File in La Crosse and Wood counties in Wisconsin by a private vendor. The frame included residential, mailable addresses and excluded business, seasonal, and vacant addresses. Households were stratified by county and randomly assigned to eight experimental groups containing 326 households. Respondents were
at Stanford University on February 21, 2016
http://poq.oxfordjournals.org/
eligible for the study if they were between the ages of 18 and 74 and resided in one of two targeted counties at the time of the study. Within-household selection methods for mail surveys have been shown to be ineffective Figure 2. Envelope Messaging Used in Study 1 and Study 2.
Incentives and Envelope Messages 913
at Stanford University on February 21, 2016
http://poq.oxfordjournals.org/
(Olson, Stange, and Smyth 2014). We allowed any eligible adult in the household to complete the survey. Instructions in the cover letter requested that “an adult between the ages of 18–74 should complete and return this short survey.” The survey asked extensive information about health- and community-related topics, including health behaviors, food purchasing routines, and community satisfaction. The questionnaires varied slightly in length between the counties (e.g., 124 items on 12 pages in La Crosse versus 164 items on 18 pages in Wood). All study materials were written and completed in English. (While the cover letter included a sentence in Spanish offering a Spanish-language version of the questionnaire, no one made this request.)
Sampled households received up to three contacts by mail.2 The initial packet contained a cover letter bearing the county seal, cash preincentive, ques-tionnaire, and self-addressed first-class stamped return envelope. Materials were sent in a 10” x 13” envelope with a first-class stamp. Approximately a week after the initial mailing, all households received a reminder postcard. Approximately one month after the initial mailing, all nonresponders were sent an additional packet containing a cover letter, second incentive (if rel-evant), questionnaire, and return envelope. The field period extended from February to April 2011.
ANALYSES
Response rate analysis: Table 1 presents response rates after the initial and final mailings for each of the eight experimental groups. Response rates were calculated as the number of completed or partially completed questionnaires divided by the number of eligible cases (RR2, AAPOR 2015).3 The overall response rate was high, with 57.1 and 66.9 percent of the sample responding after the initial and final mailings, respectively. Following the final mailing, response rates ranged from 61.8 percent for the group that received $2 for a pre- and second incentive and no message on the envelope to 71.2 percent for
2. Using reverse directory search methods, the sample provider attempted to match a household-er’s name to a given address. Households in the matched sample were addressed using the first and last name of the individual identified (e.g., “Hank Williams”). Households in the unmatched sample were addressed as a resident of their given municipality (e.g., “COUNTY Resident”). A small number of cases from the matched sample—4.6 percent from study 1 and 4.9 percent from study 2—had initial mailings returned as undeliverable due to the addressee (addressee not known, unable to forward, undelivered as addressed) and were readdressed as “<municipal-ity> Resident” for the second mailing. Because of time constraints, we were not able to reassign
these cases to receive whatever incentive they were eligible for at the first mailing, but instead, continued with the final mailing. Analyses of response rates were run without these cases, and results remained unchanged. Respondent selection procedures were the same for the matched and unmatched samples.
3. Cases were classified as ineligible if they were returned marked “no such address/number,” “vacant,” or the sample member indicated that (he/she) was ineligible due to age or residence.
at Stanford University on February 21, 2016
http://poq.oxfordjournals.org/
Table 1. Sample Sizes, Response Rates, and Item-Missing Data Scores by Inclusion of a Second Incentive by Envelope Message by Amount of Preincentive, Study 1
$2 Preincentive $5 Preincentive
No message Monetary message No message Monetary message
$0 Second incentive
$2 Second incentive
$0 Second incentive
$2 Second incentive
$0 Second incentive
$2 Second incentive
$0 Second incentive
$2 Second incentive Total
Sample sizes
N 326 326 326 326 326 326 326 326 2,608
Not eligible 35 30 37 38 33 19 36 38 266
Completed surveys
After initial mailing 162 152 153 154 174 187 177 179 1,338
After final mailing 199 183 181 184 206 213 195 205 1,566
Response rates
After initial mailing 55.7 51.4 52.9 53.5 59.4 60.9 61.0 62.2 57.1
After final mailing 68.4 61.8 62.6 63.9 70.3 69.4 67.2 71.2 66.9
Increase after final mailing 12.7 10.4 9.7 10.4 10.9 8.5 6.2 9.0 9.8
Item-missing data scores
Mean 0.053 0.046 0.047 0.072 0.047 0.042 0.055 0.039 0.048
Standard deviation (0.096) (0.082) (0.091) (0.142) (0.094) (0.072) (0.097) (0.073) (0.095)
Incentiv
es and En
velope Messages
915
the group that received a $5 preincentive, a $2 second incentive, and a mon-etary message. While differences between the experimental groups for the second incentive and envelope message were modest, the larger preincentive positively affected participation.
We evaluated the effect of the level of preincentive and envelope mes-saging after the initial mailing using logistic regression. Model 1 in
table 2 presents estimates of the effects of the amount of the preincentive,
envelope message, and the two-way interaction term on survey response. The column labeled “Exp[B]” provides the proportional change in the odds of responding. Although the odds of responding were 31 percent higher among those sent a $5 versus $2 preincentive, the two-way inter-action was not significant, and model 1 was re-estimated including terms for the main effects only. A significant main effect emerged for the pre-incentive, but the effect of the envelope’s message was not significant (see model 2, table 2). Additional analyses (results not shown) indicated that the main effect for the preincentive was due to a higher response rate achieved for the group that received $5 versus $2 (60.9 versus 53.4 percent, respectively).
Final participation was assessed by regressing dummy variables for the pre-incentive, envelope message, second pre-incentive, and the two- and three-way interaction terms on response. Again, preliminary results indicated that none of the interaction terms were significant (see model 3, table 2). We re-estimated the model including terms for the main effects only (see model 4, table 2). While a main effect emerged for the preincentive, neither the envelope mes-sage nor the second incentive had a significant impact on response. The lack of a significant interaction between incentives and messaging suggests that the preincentive’s effect was consistent across the other two treatments. Additional analyses again indicated that the main effect for the preincentive was due to a higher response rate for the $5 versus $2 groups (69.5 versus 64.2 percent, respectively).
Item nonresponse analysis: To evaluate item nonresponse, we computed a score for each respondent that indicated the total number of items for which the respondent’s answer to the question was “missing” divided by the total number of items in the questionnaire. A respondent’s answer to a given question was classified as missing if the respondent left blank a question that he/she should have answered or if the respondent’s value for the question was undetermined because he/she left blank a filter question that determined the respondent’s eligibility for the current question. The lower panel in table 1 provides the means and standard deviations of the scores by the experimental groups; item nonresponse was lowest for the group that received a $5 preincentive, a $2 second incentive, and a monetary message, and highest for the group that received a $2 preincentive, a $2 second incentive, and a monetary message.
at Stanford University on February 21, 2016
http://poq.oxfordjournals.org/
Table 2. Logistic Regression Analyses of Survey Response and ANOVA Analyses for Item Nonresponse, Study 1
Experimental variables
Results from logistic regression analyses for survey response
Results from ANOVA analysis
for item nonresponse
After the initial mailing After the final mailing
After the final
Monetary message [vs. none] –0.011 (0.118)
$2 second incentive x monetary message
Experimental variables
Results from logistic regression analyses for survey response
Results from ANOVA analysis
for item nonresponse
After the initial mailing After the final mailing
After the final message x $2 second incentive
– – – – –0.115
Because of the continuous distribution of the item-missing scores, we conducted a 2 (preincentive) x 2 (envelope message) x 2 (second incentive) ANOVA with the level of the score as the dependent variable (see model 5,
table 2). Results indicated significant or marginally significant effects for the
$5 preincentive, F(1, 1558) = 3.40, p < 0.07, the two-way interaction term for the $5 preincentive x $2 second incentive, F(1, 1558) = 4.27, p < .04, and the three-way interaction term, F(1, 1558) = 5.11, p < 0.03. The presence of the significant three-way interaction term indicated that at least one of the two-way interactions varied across the levels of the third variable. Further analysis indicated a significant difference between the first and second incentive in the presence of a monetary message, F(1, 1558 = 9.15, p < .05), but not when the message was omitted, F(1, 1558 = 0.02, p> .10) (see the online appendix).
Additional tests were conducted comparing the effect of the second prepaid incentive for the different levels of the first prepaid incentive when the sam-ple was restricted to include only cases that received the monetary message. Critical values were calculated using the per-family error rate method (Kirk 2013). Results indicated that the effect of the second prepaid incentive did not significantly vary when the first prepaid incentive was $5, F(1, 1558 = 2.99, p> .05), but that when the first prepaid incentive was $2, levels of missing
data were significantly higher when an initial incentive of $2 was followed by a second incentive of $2 (M = 0.072) than when an initial incentive of $2 was not followed by a second incentive (M = 0.047), F(1, 1558 = 6.42, p < .05).
Cost analysis: While costs incurred by including a message on an envelope can vary as a result of the vendor or type of graphics, the cost of messaging was negligible in our study. Because we found that envelope messaging had no effect on response rates, we limited analysis to examining how costs varied among the incentive groups. Within experimental groups, we calculated costs considering only the variable costs incurred for the experiment, such as for postage, printing, cash incentives, and labor (e.g., assembly and data entry). We omitted fixed costs (e.g., questionnaire design and project management).
Panel A in table 3 presents a summary of costs, collapsed across the enve-lope messaging treatments for study 1. Total costs were highest for groups sent an initial preincentive of $5 ($11,068 for the group sent a second incentive of $2, versus $10,638 for the group that did not receive the second incentive) and lowest for the groups that only received $2 initially ($9,503 for the group that received the second incentive, versus $8,876 for the group that did not).
Looking at cost per complete, the increased cost of adding the second incen-tive varied dramatically depending upon the amount of the initial preincen-tive. Among sample members initially receiving $2, an additional $2 increased cost per complete by more than $2, from $23.36 to $25.89. Among sample members initially receiving $5, cost per complete decreased slightly with the inclusion of the $2 second incentive, from $26.53 to $26.48. Comparing cost
Incentives and Envelope Messages 919
at Stanford University on February 21, 2016
http://poq.oxfordjournals.org/
Table 3. Cost Indicators by Incentives, Study 1 and Study 2
Total costs
Costs per complete
Final response rate
Incremental response rate
(IRR)a
Total cost per 100b
Incremental cost (IC)c
E (IRR/IC)
Panel A: Study 1
$2 Preincentive, $0 Second incentive $8,876 $23.36 65.5% – $1,361 – 1.0
$2 Preincentive, $2 Second incentive $9,503 $25.89 62.8% –4.1% $1,458 7.1% –0.6
$5 Preincentive, $0 Second incentive $10,638 $26.53 68.8% 5.0% $1,632 19.8% 0.3
$5 Preincentive, $2 Second incentive $11,068 $26.48 70.3% 7.3% $1,698 24.7% 0.3
Panel B: Study 2
$2 Preincentive, $0 Second incentive $17,810 $24.33 61.7% – $1,356 – 1.0
$2 Preincentive, $5 Second incentive $21,024 $26.92 67.5% 9.4% $1,601 18.0% 0.5
aIRR = ((response rate for experimental group – response rate for baseline group) / response rate for baseline group) x 100. bSample sizes adjusted to 100 fielded cases for comparison across groups.
cIC = ((total cost per 100 cases for experimental group – total cost per 100 cases for baseline group) / total costs per 100 cases for baseline group) x 100.
Dyk
ema et al.
per complete for the initial incentives, while the $5 preincentive significantly increased response, it did not offset costs for including a second incentive.
We also computed a measure of cost-effectiveness, E, the ratio of the incre-mental response rate to increincre-mental costs (Brennan, Seymour, and Gendall 1993). E provides a standard method of comparing the relative benefits of the incentive treatments against the baseline group (i.e., $2 preincentive, $0 second incentive). Values greater than 1 indicate that the proportional effect on response exceeds the proportional additional cost; values less than 1 indi-cate more proportional costs per benefit. Because the $2 preincentive plus $2 second incentive fared worse than the $2 preincentive without a second incen-tive, E was –0.6 for this comparison. Both $5 treatments (with and without $2 second incentive) also yielded fairly low E scores of 0.3.
Study 2
Informed by the results from study 1, we modified aspects of the incentive structure and the envelope messages for study 2. In study 1, the level of the second incentive was either equal to or less than the amount of the ini-tial preincentive. In study 2, we sought to test the effectiveness of a second incentive that was larger than the original preincentive. To do so, we limited the amount of initial preincentive to $2 and increased the amount of second incentive to $5.4 The message in study 1 was small and primarily text based. In an attempt to intensify the visual impact of the message, we replaced the plain text message with a colorful and potentially more eye-catching geometric design (figure 2). Finally, drawing on research that indicated that health-related studies tend to yield high response rates (e.g., Groves, Presser,
and Dipko 2004; Heberlein and Baumgartner 1978), we tested a
health-focused message in addition to the monetary-health-focused message.
EXPERIMENTAL DESIGN
To test the impact of envelope messaging and receipt of a second incentive in study 2, we implemented a 2 x 3 between-participants factorial design.5 While all sample members received a $2 preincentive, we manipulated the following factors:
1. Inclusion and content of the envelope message: a) no message; b) mon-etary-focused message (“We’ve included a small cash gift to thank you
4. Even though the $5 preincentive in study 1 yielded significantly higher response rates than the $2 preincentive, we limited the comparison of the effect of including a larger second incentive to a $2 preincentive due to costs.
5. When the envelope message and second incentive factors are crossed in the final mailing, they yield an empty cell for the combination of a monetary message and $0 for the second incentive. Thus, sample members in this group received the monetary message for the initial mailing, but they did not receive a monetary message (by design) for the final mailing.
Incentives and Envelope Messages 921
at Stanford University on February 21, 2016
http://poq.oxfordjournals.org/
for your participation!”); and c) health-focused message (“Your partici-pation is needed to build a healthier NAME County!”) (see figure 2). If relevant, the message appeared on the outside envelope for both the initial and the follow-up mailing.
2. Second prepaid incentive: a) none ($0); and b) $5. Only nonresponding households were eligible for the second incentive.
We predicted that messages referring to incentives or health would increase response rates over not receiving a message, and that while the inclusion of a second incentive of $5 for nonresponders would increase response rates, it would not be cost effective.
SAMPLE AND DATA COLLECTION
The target population for study 2 was identical to study 1: adults (18– 74 years) residing in the same two targeted counties. The design of study 2 mirrored study 1, including three contact attempts (initial mailing, reminder postcard, and final mailing to nonresponders) and the same aims for house-hold and respondent recruitment: A sample of 2,616 different househouse-holds was randomly selected from the same two counties using ABS and ran-domly assigned to six treatment groups, stratified by county; information in the cover letter instructed the reader to have any adult (18–74 years) complete the questionnaire. Excluding the addition of several questions, the questionnaire in study 2 paralleled study 1, containing 135 items in La Crosse and 180 items in Wood. Surveys were fielded between January and April 2012.
ANALYSES
Response rate analysis: Table 4 presents response rates after the initial and final mailings for experimental groups. The overall response rate was high, with 51.4 percent of the sample responding after the first mailing and 64.6 percent responding after the second mailing. Differences between the experi-mental groups, however, were small. Following the second mailing, response rates were lowest (60.5 percent) for the two groups that did not receive a sec-ond incentive but had either a health or monetary message on their envelopes. Response rates were highest (68.3 percent) for the two groups that received a second incentive of $5 and had no message or a health message.
Differences among the response rates after the initial mailing were assessed using logistic regression. Model 1 in table 5 shows estimates of the effects of survey response on variables for no message and monetary message, with health message as the reference category. There was no significant effect due to envelope messaging. We evaluated final participation by regressing response after the final mailing on dummy variables for envelope messaging,
at Stanford University on February 21, 2016
http://poq.oxfordjournals.org/
Table 4. Sample Sizes, Response Rates, and Item-Missing Data Scores by Inclusion of a Second Incentive by Envelope Messages, Study 2
No message Monetary message Health message
$0 Second incentive
$5 Second incentive
$0 Second incentive
$5 Second incentive
$0 Second incentive
$5 Second
incentive Total
Sample sizes
N 436 436 436 436 436 436 2,616
Not eligible 50 48 41 52 31 51 273
Completed surveys
After initial mailing 410 384 410 1,204
After final mailing 248 265 239 253 245 263 1,513
Response rates
After initial mailing 53.0 49.3 51.9 51.4
After final mailing 64.2 68.3 60.5 65.9 60.5 68.3 64.6
Increase after final mailing 11.2 15.3 11.2 16.6 8.6 16.4 13.2
Item-missing data scores
Mean 0.043 0.057 0.055 0.052 0.058 0.063 0.055
Standard deviation (0.076) (0.113) (0.102) (0.090) (0.108) (0.126) (0.104)
Incentiv
es and En
velope Messages
923
Results from logistic regression analyses for survey response
initial mailing After the final mailing
After the
Experimental variables B Exp(B) B Exp(B) B Exp(B) B Exp(B) F p-value
Main effects
Envelope message 1.27 0.28
[Health message] – – – – – – – –
Monetary message –0.104
(0.101)
Results from logistic regression analyses for survey response
initial mailing After the final mailing
After the
Experimental variables B Exp(B) B Exp(B) B Exp(B) B Exp(B) F p-value
2-Way interaction terms
amount of the second incentive, and the two-way interaction terms (“no mes-sage x $5 second incentive” and “monetary mesmes-sage x $5 second incentive”). Results indicated that the interaction terms were not significant (see model
2, table 5)—suggesting that the second incentive had a consistent effect on
survey participation across the envelope messaging groups—and the model was re-estimated with terms for the main effects only. A main effect emerged for the second incentive, significantly increasing the odds of responding by 29 percent; messaging was not significant (see model 3, table 5). Further analysis revealed that the main effect for the second incentive was due to a higher response in the group that received a second incentive of $5 compared to the group that did not receive a second incentive (67.5 versus 61.7 percent, respectively).
In model 4 (table 5), we restricted the analysis to include only the 1,111 sample members who were sent an additional survey (i.e., those who were nonresponders after the initial mailing). The odds of responding among these respondents were significantly increased by slightly over a factor of 2. The final response rate among initial nonresponders was approximately 14 points higher among nonresponders who received the second incentive than for those who did not (35.0 versus 20.8 percent, respectively).
Item nonresponse analysis: Item-missing scores were calculated in a manner similar to study 1 (see the lower panel in table 4 for the means and standard deviations by experimental groups). While item-missing levels were lowest for the group that received no message and no second incentive and highest for the group that received the health message and a $5 second incentive, there was little variation across the groups.
We conducted a 3 (envelope messaging) x 2 (second incentive) ANOVA with the level of the score as the dependent variable. The interaction term was not significant (results not shown), and we re-estimated the model including terms for the main effects only. Neither envelope messaging, F(1, 1509 = 1.27, p = .28), nor the second incentive, F(1, 1509 = 1.25, p = .26), were significantly associated with levels of item-missing data (see model
5, table 5).
Cost analysis: Because messaging had no effect on response rates, our cost analysis focused on how costs varied across incentive treatments. Adding a second incentive of $5 increased total variable costs from $17,810 to $21,024 (panel B, table 3). While the second $5 prepaid incentive sent only to nonresponders increased response rates by almost 6 percentage points, it only increased the cost per complete by an additional $2.59, from $24.33 to $26.92. The E-value for the addition of a $5 second incentive following an initial preincentive of $2 was 0.5, more cost effective than either of the second incentives in study 1, but still not greater than 1.
at Stanford University on February 21, 2016
http://poq.oxfordjournals.org/
Discussion
We manipulated several from a list of possible variables in our two studies (see figure 1). With envelope messaging, we attempted to increase the posi-tive effects of incenposi-tives and health as a topic by drawing sample members’ attention to these elements during their first point of contact with the study, the receipt of the envelope. With incentives, we experimented with the size and timing of token prepaid amounts.
The health-related message was intended to increase respondents’ aware-ness of the topic of the study in order to benefit from the higher response rates often associated with health surveys. The goals for the monetary mes-sage were more complicated and involved drawing respondents’ attention to the token, encouraging them to open the envelope, see the cash and read the letter, and then invoking the norm of reciprocity to complete the questionnaire. In the end, the references neither to health nor to monetary enclosures proved effective. It may be that emphasizing money with messaging counteracted the norm of reciprocity, disappointing some respondents who expected a payment large enough to essentially pay for their time (Biner and Kidd 1994). Perhaps among sample members with a low propensity to participate, the messages may have flagged the mailing as nonessential or junk mail. We also note how cooperative the county residents were. Both surveys achieved response rates of around 65 percent, possibly leaving little room for improvement. In a less homogeneous geographical area, or with a less salient topic or sponsor (the county seal was included on all envelopes), an envelope’s message might have more influence.
Our experiments varying the amounts and inclusion of preincentives and second incentives proved potentially more useful. In study 1, sample members received either a $2 or $5 preincentive. Consistent with previous research, the $5 preincentive was associated with significantly higher response rates than the $2 preincentive, such that an increase in the amount of $3 was associated with a rise of 6 points in response. While not surprising, it was useful to repli-cate this finding using ABS and a rather long questionnaire.
In study 1, the amount of the second incentive was either equivalent to (as with the $2 preincentive followed by a $2 second incentive) or lower than the amount of the initial preincentive (as with the $5 preincentive followed by either $0 or $2). Findings for the second incentive were not encouraging, as the second incentive had no effect on response rates. Informed by these results, we modified the design in study 2, sending all sample members a preincen-tive of only $2, but varying the amount of the second incenpreincen-tive so that it was larger than the preincentive. We found that sending nonresponders a second prepaid incentive of $5 significantly increased response rates by 6 points over not including a second incentive.
Consistent with the principles of social exchange, sample members respond at higher levels in the presence of incentives, but they also appear
Incentives and Envelope Messages 927
at Stanford University on February 21, 2016
http://poq.oxfordjournals.org/
to be sensitive to small changes in the amounts, as would be predicted by leverage-saliency theory. The incentives seem to be received and interpreted as intended, as token gifts offered in consideration of participation (i.e., “Let us buy you a cup of coffee as a token of appreciation for complying with our request”). In study 1, once we provided the initial $2 or $5, we leveraged the gain an incentive of that amount could have. When we repeated our offer in the final mailing, this time for only $2, we saw no added benefit. In study 2, we began by providing only $2. After we obtained the increase in response from leveraging a $2 token, we upped the ante to $5 in the final mailing, and saw a boost in response. In study 2, we seemed to be asking, “How good of a cup of coffee do we need to buy you?” For some nonrespondents, it might take a latte to get their cooperation. Our results indicate that when they wish to send a second prepaid incentive, researchers will need to choose an amount large enough to induce the remaining and more reluctant respondents into partici-pating. It is possible that this amount will need to exceed the amount of the initial incentive.
Singer and Ye (2013, 125) note two hypotheses concerning an incentive’s
effect on response quality: “The first is that incentives, by inducing sample members to respond who otherwise would have refused, will lead to a decline in response quality. The alternative hypothesis predicts that incentives, by rewarding participants, will lead to better quality answers as well as increased participation.” They report that while few studies have examined the effect of incentives on data quality, available evidence for mail and interviewer-administered surveys indicates that they have little effect on survey responses. Where differences have been found, they seem to favor the hypothesis that incentives increase data quality.
Our findings regarding the effects of the experimental treatments on data quality, as indicated by levels of item nonresponse, tell a cautionary tale. Across both studies, we found that not including a message on the outside of the envelope—current practice for many research-based mail surveys—has no impact on item nonresponse, regardless of whether sample members were mailed an initial prepaid incentive of $2 or $5 or whether a second prepaid incentive of $2 or $5 was sent to nonresponding sample members. Our results suggest, however, that researchers should use caution when combining differ-ent incdiffer-entive amounts and envelope messaging. In the presence of a monetary message in study 1, we observed a trend such that when a $5 preincentive was followed by a second incentive of $2, item nonresponse was lower than when a $2 preincentive was followed by a second of only $2. This latter relationship was significant, suggesting that the use of two sequential prepaid $2 incentives induced respondents to complete the survey, however in a less thoughtful or rushed manner.
Interpreting the cost analysis across the two studies is challenging. Findings from study 1 suggest that the most cost-effective approaches are to either (1) send all sample members a smaller preincentive (e.g., $2 versus $5) and forego
at Stanford University on February 21, 2016
http://poq.oxfordjournals.org/
a second incentive; or (2) send all sample members a larger preincentive (e.g., $5 versus $2) and send nonresponders a second incentive of $2, as there is lit-tle additional cost per complete. These conclusions seem a litlit-tle implausible. More likely is that the high response rates achieved by the surveys limited our ability to make great gains (or losses) in efficiency with follow-up mail-ings. We speculate that these findings may be different for studies in which the initial response is lower. In study 2, however, the lesson seems clearer. If response rates are lagging and funds available, sending nonresponders a sec-ond incentive that is larger than the preincentive may increase response, but at a nontrivial cost. The decisions about costs and use of multiple incentives in a mail survey will be similar to the decisions made about follow-up contacts for mail surveys: cost per completed surveys from reluctant responders will be higher than those completed earlier in the field period, and second incentives will not be enough to be purely cost effective.
Due to better coverage, efficiency and ease of administration, reduced complexity of weighting, and lower costs (e.g., compared to interviewer-administered surveys), we anticipate that researchers will increasingly collect health and other data by mailing surveys to samples drawn from the general population using ABS. Because a sample member’s participation in a mail survey involves many decision-making points influenced by numerous design features, learning more about the effects of variations within and interaction among the features on response rates, item nonresponse, and costs is essential. Unfortunately, our two studies did not allow us to directly compare the dif-ferences in response rates, missing data, and costs between a $2 pre- and $5 second incentive treatment and a $5 preincentive-only treatment, but such a comparison is warranted. We encourage future research aimed at examining the effectiveness of various incentive combinations with different populations and topics, including metropolitan areas where response rates are likely to be lower, and with surveys of non-health-related topics.
Supplementary Data
Supplementary data are freely available online at http://poq.oxfordjournals. org/.
References
American Association for Public Opinion Research. 2015. Standard Definitions: Final
Dispositions of Case Codes and Outcome Rates for Surveys, 8th ed. AAPOR.
Biner, Paul M., and Heath J. Kidd. 1994. “The Interactive Effects of Monetary Incentive Justification and Questionnaire Length on Mail Survey Response Rates.” Psychology and Marketing 11:483–92.
Blumberg, Stephen J., and Julian V. Luke. 2015. “Wireless Substitution: Early Release of Estimates from the National Health Interview Survey, July–December 2014.” National Center for Health Statistics, http://www.cdc.gov/nchs/nhis.htm.
Incentives and Envelope Messages 929
at Stanford University on February 21, 2016
http://poq.oxfordjournals.org/
Brennan, Mike, Peter Seymour, and Philip Gendall. 1993. “The Effectiveness of Monetary Incentives in Mail Surveys: Further Data.” Marketing Bulletin 4:43–52.
Brick, J. Michael, Douglas Williams, and Jill M. Montaquila. 2011. “Address-Based Sampling for Subpopulation Surveys.” Public Opinion Quarterly 75:409–28.
Church, Allan H. 1993. “Estimating the Effect of Incentives on Mail Survey Response Rates: A Meta-Analysis.” Public Opinion Quarterly 57:62–79.
Couper, Mick P., Nancy A. Mathiowetz, and Eleanor Singer. 1995. “Related Households, Mail Handling, and Returns to the 1990 U.S. Census.” International Journal of Public Opinion Research 7:172–77.
Dillman, Don A. 2007. Mail and Internet Surveys: The Tailored Design Method 2007 Update with New Internet, Visual, and Mixed-Mode Guide, 2nd ed. New York: Wiley.
Dillman, Don A., Eleanor Singer, Jon R. Clark, and James B. Treat. 1996. “Effects of Benefits Appeals, Mandatory Appeals, and Variations in Statements of Confidentiality on Complete Rates for Census Questionnaires.” Public Opinion Quarterly 60:376–89.
Dillman, Don A., Jolene D. Smyth, and Leah Melani Christian. 2014. Internet, Phone, Mail, and Mixed-Mode Surveys: The Tailored Design Method, 4th ed. Hoboken, NJ: John Wiley & Sons. Dommeyer, Curt J., Doris Elganayan, and Cliff Umans. 1991. “Increasing Mail Survey Response
with an Envelope Teaser.” Journal of the Market Research Society 33:137–40.
Dykema, Jennifer, John Stevenson, Chad Kniss, Katherine Kvale, Kim González, and Eleanor Cautley. 2012. “Use of Monetary and Nonmonetary Incentives to Increase Response Rates among African Americans in the Wisconsin Pregnancy Risk Assessment Monitoring System.” Maternal and Child Health Journal 16:785–91.
Edwards, Phil, Rachel Cooper, Ian Roberts, and Chris Frost. 2005. “Meta-Analysis of Randomized Trials of Monetary Incentives and Response to Mailed Questionnaires.” Journal
of Epidemiology and Community Health 59:987–99.
Edwards, Phil, Ian Roberts, Mike Clarke, Carolyn DiGuiseppi, Sarah Pratap, Reinhard Wentz, and Irene Kwan. 2002. “Increasing Response Rates to Postal Questionnaires: Systematic Review.”
BMJ 324:1183–1191.
Edwards, Philip J., Ian Roberts, Mike J. Clarke, Carolyn DiGuiseppi, Reinhard Wentz, Irene Kwan, Rachel Cooper, Lambert M. Felix, and Sarah Pratap. 2009. “Methods to Increase Response to Postal and Electronic Questionnaires.” Cochrane Database of Systematic Reviews (July) 3:MR000008. doi:10.1002/14651858.MR000008.
Finn, Anna, Philip Gendall, and Janet Hoek. 2004. “Two Attempts to Increase the Response to a Mail Survey.” Marketing Bulletin 15:1–5.
Furse, David H., David W. Stewart, and David L. Rados. 1981. “Effects of Foot-in-the-Door, Cash Incentives, and Followups on Survey Response.” Journal of Marketing Research 18:473–78. Gouldner, Alvin W. 1960. “The Norm of Reciprocity: A Preliminary Statement.” American
Sociological Review 25:161–78.
Groves, Robert M., Stanley Presser, and Sarah Dipko. 2004. “The Role of Topic Interest in Survey Participation Decisions.” Public Opinion Quarterly 68:2–31.
Groves, Robert M., Eleanor Singer, and Amy Corning. 2000. “Leverage-Saliency Theory of Survey Participation: Description and an Illustration.” Public Opinion Quarterly 64:299–308. Han, Daifeng, Jill M. Montaquila, and J. Michael Brick. 2013. “An Evaluation of Incentive
Experiments in a Two-Phase Address-Based Sample Mail Survey.” Survey Research Methods
7:207–18.
Heberlein, Thomas A., and Robert M. Baumgartner. 1978. “Factors Affecting Response Rates to Mailed Questionnaires: A Quantitative Analysis of the Published Literature.” American Sociological Review 43:447–62.
Iannacchione, Vincent G. 2011. “The Changing Role of Address-Based Sampling in Survey Research.” Public Opinion Quarterly 75:556–75.
James, Jeannine M., and Richard Bolstein. 1990. “The Effect of Monetary Incentives and Follow-Up Mailings on the Response Rate and Response Quality in Mail Surveys.” Public Opinion Quarterly 54:346–61.
at Stanford University on February 21, 2016
http://poq.oxfordjournals.org/
Kirk, Roger E. 2013. Experimental Design: Procedures for the Behavioral Sciences, 4th ed. Thousand Oaks, CA: SAGE Publications.
Kropf, Martha E., and Johnny Blair. 2005. “Eliciting Survey Cooperation: Incentives, Self-Interest, and Norms of Cooperation.” Evaluation Review 29:559–75.
Link, Michael W., Michael P. Battaglia, Martin R. Frankel, Larry Osborn, and Ali H. Mokdad. 2008. “A Comparison of Address-Based Sampling (ABS) versus Random-Digit Dialing (RDD) for General Population Surveys.” Public Opinion Quarterly 72:6–27.
Mazzone, John, and Samie Rehman. 2013. “The Household Diary Study: Mail Use and Attitudes
in FY 2012.” USPS Household Diary Study: Washington, DC.
McLean, Siân A., Susan J. Paxton, Robin Massey, Jonathan M. Mond, Bryan Rodgers, and Phillipa J. Hay. 2014. “Prenotification But Not Envelope Teaser Increased Response Rates in a Bulimia Nervosa Mental Health Literacy Survey: A Randomized Controlled Trial.” Journal of Clinical Epidemiology 67:870–76.
Messer, Benjamin L., and Don A. Dillman. 2011. “Surveying the General Public over the Internet Using Address-Based Sampling and Mail Contact Procedures.” Public Opinion Quarterly
75:429–57.
Moore, Danna, and Larry An. 2001. “The Effect of Repetitive Token Incentives and Priority Mail on Response to Physician Surveys.” Proceedings of the American Statistical Association, Government Section on Survey Methods, Atlanta, GA.
Olson, Kristen, Mathew Stange, and Jolene Smyth. 2014. “Assessing Within-Household Selection Methods in Household Mail Surveys.” Public Opinion Quarterly 78:656–78.
Singer, Eleanor, and Cong Ye. 2013. “The Use and Effects of Incentives in Surveys.” The ANNALS of the American Academy of Political and Social Science 645:112–41.
Stern, Michael J., Ipek Bilgen, and Don A. Dillman. 2014. “The State of Survey Methodology: Challenges, Dilemmas, and New Frontiers in the Era of the Tailored Design.” Field Methods 26:284–301.
Trussell, Norm, and Paul J. Lavarakas. 2004. “The Influence of Incremental Increases in Token Cash Incentives on Mail Survey Response: Is There an Optimal Amount?” Public Opinion Quarterly 68:349–67.
Ziegenfuss, Jeanette Y., Kelly Burmeister, Katherine M. James, Lindsey Haas, Jon C. Tilburt, and Timothy J. Beebe. 2012. “Getting Physicians to Open the Survey: Little Evidence That an Envelope Teaser Increases Response Rates.” BMC Medical Research Methodology 12:41.
Incentives and Envelope Messages 931
at Stanford University on February 21, 2016
http://poq.oxfordjournals.org/