The number of sectors and other risk factors related to fatigue among
short-haul commercial pilots in Indonesia
Inne Yuliawati,
1Minarma Siagian,
1Thamrin Abudi,
2Bastaman Basuki
11 Aviation Medicine Postgraduate Program, Faculty of Medicine, Universitas Indonesia 2 Civil Aviation Medical Center, Directorate General of Civil Aviation, Jakarta
Corresponding address: Dr. Inne Yuliawsati, AMS Email: inneyuliawati@yahoo.com
Received: October 3,2015; Revised: October 12, 2015; Accepted: October 17 , 2015
Abstrak
Latar belakang: Kelelahan penerbang sipil, termasuk pada penerbangan jarak dekat, dapat mempengaruhi fungsi kognitif penerbang sehingga membahayakan keselamatan penerbangan. Tujuan penelitian ini untuk mengidentifikasi faktor-faktor yang mempengaruhi kelelahan penerbang sipil pada penerbangan jarak dekat di Indonesia.
Metode: Desain penelitian potong lintang dengan purposive sampling dilakukan di antara penerbang jarak dekat dengan rating Boeing 737 series yang melaksanakan pengujian kesehatan di Balai Kesehatan Penerbangan periode 5-26 Mei, 2014. Kelelahan diukur dengan Self-Reporting Questionnaire, Fatigue Severity Scale (FSS). Data dikumpulkan dengan pengisian kuesioner oleh subyek yang meliputi demografi, pekerjaan, kehilangan waktu tidur (Epworth Sleepiness Scale - ESS), faktor personal, dukungan manajemen, dan FSS. Analisis regresi linear dipakai untuk menganalisis faktor-faktor dominan berkaitan kelelahan.
Hasil: Di antara 785 penerbang yang melaksanakan pengujian kesehatan, 382 bersedia berpartisipasi, dan 239 penerbang yang memenuhi kriteria. Rata-rata skala kelelahan adalah 4,66 (standar deviasi 1,202). Faktor-faktor dominan yang mempertinggi skala kelelahan adalah jumlah sektor 24 jam terakhir, jam terbang penugasan di luar jadwal, dan kehilangan waktu tidur. Setiap penambahan 1 sektor dalam 24 jam terakhir meningkatkan 0,371 skala kelelahan [koefisien regresi (β) = 0,371; P = 0,000]. Selanjutnya setiap penambahan 1 jam terbang penugasan di luar jadwal mempertinggi 0,033 skala kelelahan (β = 0,033; P = 0,000). Sedangkan setiap penambahan 1 nilai ESS mempertinggi 0,043 skala kelelahan (β = 0,043; P = 0,008).
Kesimpulan: Penambahan jumlah sektor 24 jam terakhir, kehilangan waktu tidur, dan penambahan jam terbang penugasan di luar jadwal mempertinggi risiko kelelahan di antara penerbang sipil pada penerbangan jarak dekat di Indonesia. (Health Science Journal of Indonesia 2015;6:69-75)
Kata kunci: kelelahan, jumlah sektor, penerbang sipil, Indonesia
Abstract
Background: Fatigue could impair cognitive function in pilots which may lead to accidents in short-haul flight. The
aim of this study was to identify the risk factors related to fatigue among short-haul commercial pilots in Indonesia.
Methods: A cross-sectional study with purposive sampling was conducted among Boeing 737 series typed-rating pilots taking medical examination at the Civil Aviation Medical Center, Jakarta from May 5-26, 2014. Fatigue was measured with Self-Reporting Questionnaire, Fatigue Severity Scale (FSS). Data were collected using anonymous self-reporting questionnaire on demographics, workload, sleep restriction (Epworth Sleepiness Scale-ESS), personal factors, and managerial support. Linear regression was used to identify dominant risk factors related to fatigue.
Results: During data collection, 785 pilots were taking medical examination, 382 pilots were willing to participate, and 239 pilots met the criteria. The FSS mean was 4.66 ± 1.202. The number of sectors in 24 hours, flight times of unplanned flights in 30 days, and sleep restriction were dominant factors of fatigue. Each additional sector increased FSS by 0.371 points [regression coefficient (β) = 0.371; P = 0.000]. Furthermore, each additional ESS, increased FSS by 0.043 points (β = 0.043; P = 0.008), while each additional unplanned flights increased FSS by 0.033 points (β = 0.033; P = 0.000).
Conclusions: Additional number of sectors in 24 hours, additional unplanned flight times within 30 days,
and sleep restriction increased the risk of fatigue among short-haul commercial pilots in Indonesia. (Health Science Journal of Indonesia 2015;6:69-75)
Fatigue could impair cognitive function in pilots, including judgment, memory, concentration, selective attention and decision making. These factors have been known as contributory factors to aircraft accidents and incidents.1 The National Aeronautics and Space Administration (NASA) Aviation Safety Reporting System indicated that 21% of reported aviation incidents were fatigue related.2
The causes of pilot fatigue are primarily related to
sleep loss for both long-haul and short-haul flights. Night flights and jet lag are the most important factors that generated fatigue in long-haul flights.3 While other studies revealed that fatigue in short-haul operation was caused by the number of sectors,3,4 more than
one unplanned flights in a month,2,5 cumulative duty time in the preceding week,3 and sleep restriction.5
Repeated mild sleep restriction without sufficient
opportunity for recuperation, could cause cumulative fatigue and lead to great risk for aviation safety.6
Indonesia is an archipelago nation and short-haul
domestic flights between cities or small islands play
an important role. High domestic passenger rate and tense competition among airlines in Indonesia7 pushed airline management to a culture of short-haul
pilots flying more sectors, flying unplanned flights during rest periods and cumulatively flying close to legal maximum of flight and duty time limitations, as was clarified by 30% of subjects during preliminary
study. This condition may adversely affect the safety
of short-haul flights in Indonesia
The aim of this study was to identify the dominant risk factors related to fatigue among short-haul commercial pilots in Indonesia.
METHODS
This cross-sectional among the population of active pilots working for commercial airlines was conducted under Civil Aviation Safety Regulation (CASR) part 121 in Indonesia. Subjects were selected by purposive sampling from commercials pilots taking medical examinations at the Civil Aviation Medical Center in Jakarta from May 5 – 26, 2014.
The inclusion criteria were active commercials pilots holding an Airline Transport Pilot License (ATPL) or Commercial Pilot License (CPL) type license,
operating in short-haul flights of less than 2 hours flight time per sector, and having a Boeing 737 series
type rating. The exclusion criteria were subjects taking hypnotics or stimulants.
Subjects who were willing to participate signed an
informed consent letter. They were asked to fill a
self-reporting questionnaire regarding demographics, workload, sleep restriction, managerial support, personal factors at home, behavior, and overall fatigue experience in the last week.
Fatigue was measured using Fatigue Severity Scale (FSS) that consisted of 9 questions relating to fatigue and its impact on functioning and behavioral aspects in the past week. The FSS questions were: (1) my motivation is lower when I am fatigued; (2) exercise brings on my fatigue; (3) I am easily fatigued; (4) fatigue interferes with my physical functioning; (5) fatigue causes frequent problem for me; (6) my fatigue prevents sustained physical functioning; (7) fatigue interferes with carrying out certain duties and responsibilities; (8) fatigue is among my most disabling symptoms; and (9) fatigue interferes with my work, family, or social life. Subjects answered the questions on a scale of “1” indicating agrees to and “7” indicating disagrees to. Mean FSS score was used as a continuous measure of fatigue scale.5
While the number of sectors was any flight which
has a take-off and landing at different airports which are not less than 50 nautical miles apart in the last 24 consecutive hours.8
The risk factors were frequency and flight time of unplanned flights, flight duty time in the last 24
hours, sleep restriction, managerial support, personal factors at home, and health behaviors. Flight time was divided into the last 24 hours and into 7 days.
Unplanned flight was considered as flight duty,
performed by the pilot, which was not in their schedule or during their day-off, in the last 30 consecutive days. This variable was divided into
frequency and flight time of unplanned flight.
Flight time was considered as total elapsed time
from the moment the aircraft first moved under its
own power for takeoff, until the time it comes to rest
at the end of the flight. This variable was divided into flight time in the last 24 hours and into 7 days.
Flight duty time was total elapsed period from the time a pilot report for duty to the time he completed
all official duties in the last 24 hours.8
in a public place (e.g. theatre, meeting); (4) as a passenger in a car for an hour without break; (5) lying down in the afternoon when circumstances permit; (6) sitting and talking to someone; (7) sitting quietly after a lunch without alcohol; (8) driving
a car, while stopping for a few minutes in traffic. Subjects answered the questions on a scale of 0 = would never doze; 1 = slight chance; 2 = moderate chance; 3 = high chance. The value of each scale was
summed and used as a continuous measure of ESS.9
Managerial support was measured using the Whitehall organizational justice that has 6 question relating to the subjects’ situation at the company they worked
for, which were: (1) do you get sufficient information
from line management (your superior)?; (2) do you get consistent information from line management (your superior)?; (3) how often do you get help and support from your colleagues?; (4) how often are your colleagues willing to listen to your work related problems?; (5) how often do you get help and support from your immediate superior?; (6) how often is your immediate supervisor willing to listen to your problems? Subjects answered the questions on a scale
of 1 = never; 2 = seldom; 3 = sometimes; 4 = often.
Managerial support was scaled as ordinal measure.5
Personal factors at home were measured by the Home Stress Checklist that has 4 questions relating to the stress situation that the subjects experienced at home every day. The question and choices of answer were: (1) how is your role at home? as the main source of family income/ as a father or mother/
as a husband/wife/ as a financial support to other
family members/ as a payer or pay various bill/ as a gardener/ as home decorator/ as a household repairmen (answer can be more than one); (2) which are the physical factors at household/neighborhood that you feel can annoy you? neighborhood noise/ the narrow house/ homes that’s not well organized/ leaks and physical damage in other household/ dense
neighborhood/ neighborhoods prone to flooding/
unsafe neighborhood (answer can be more than one); (3) how do you describe your tension at home: low (a bit of dispute, can be openly discussed) or moderate (there is some tension, but can be tolerable) or severe/high; (4) when you are at home, how often do you have the opportunity to yourself and do activity that’s relaxing? The answers were either every day, rarely, or several times a week. For questions number 1 and 2, “low” was if the subject answered 0 – 2, “moderate” if the subject answered 3-5, and “high”
if the subject answered ≥6. For question number
3, “low” was if the subject stated their tension at
home as a bit of dispute, can be openly discussed; “moderate” if the subject stated there is some tension but was tolerable, and “severe/high” if the subject felt the tension at home was severe/high. Personal factor at home was in ordinal scale.10
Health behavior was considered as the frequency of drinking alcohol per week, frequency of drinking coffee per day, duration of smoking (months), number of cigarettes per day, and frequency of sport activities per week.11,12
Ethical clearance was granted from the Research Ethical Commission of Faculty of Medicine Universitas Indonesia and data collection was approved by the Head of the Civil Aviation Medical Center.
Linear regression was used to identify dominant risk factors related to fatigue13, and computed using Stata released 9.
RESULTS
In the 16-day data collection period, there were 785 pilots taking medical examination and 382 were willing to participate. None of the subjects were excluded because of taking stimulants or hypnotics.
Pilots who were excluded were 81 long-haul flight
pilots, 43 Airbus 320 type-rated pilots, and 19 Avions de Transport Regional (ATR) type-rated pilots. Finally, there were 239 pilots with Boeing 737 series type-rated short-haul commercial pilots.
Table 1 showed that no subject reached the maximum (9) for FSS. The average FSS was mid-scale (4.66) between the least and the maximum and the average number of sectors was 3.58 in the last 24 hours. There were subjects with a sleep period of 4 hours, but the average sleep period was 6.83 hours, while average ESS was 8. Flight time in the last 7 days, sleep and
wakefulness periods slightly fluctuated (coefficient
of variations was less than 20%), while frequency
and flight time of unplanned flights fluctuated widely.
Furthermore, the highest variation among subjects was for the duration of smoking at 98.6%.
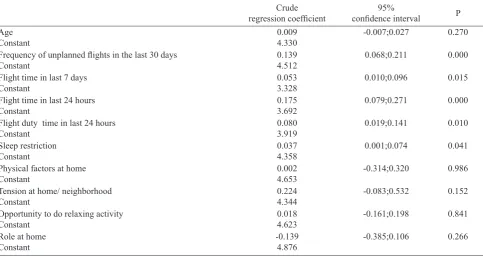
Table 2 showed that age, physical factors at home, opportunity to do relaxing activities, and role at home did not have any effect on fatigue. The number of sectors in the last 24 hours, frequency and unplanned
flight time in the last 30 days, flight time in the last 24 consecutive hours and 7 consecutive days, flight
Table 1. Several demographics, workload, sleep history, and personal habits in short-haul commercial Indonesian pilots (n=239)
Minimum Maximum Mean Standard
Deviation
Coefficient of variation (%)
Fatigue Severity Scale (FSS) 1 7 4.66 1.202 25.79
Age 20 63 35.66 9.392 26.34
Number of sectors in the last 24 hours 2 8 3.58 1.332 37,21
Frequency of unplanned flights 1 16 2.89 2.605 90.14
Flight time of unplanned flights 1 60 13.68 11.695 85.49
Flight time in the last 7 days 20 35 24.82 3.530 14.22
Flight time in the last 24 hours 3 12 5.49 1.561 28.43
Flight duty time the last 24 hours 4 15 9.16 2.489 27.17
Sleep period in the last 24 hours 4 10 6.83 1.183 17.32
Wakefulness period in the last 24
hours 10 20 15.21 1.965
12.92
Epworth Sleepiness Scale (ESS) 2 20 7.89 4.212 53.38
Role in family 1 3 1.57 0.623 39.68
Physical factor at home/ neighborhood 1 3 1.26 0.485 38.49
Tension at home 1 3 1.39 0.498 35.83
Opportunity of relaxing activities 1 3 1.80 0.856 47.56
Duration of smoking (months) 2 240 48.17 47.497 98.60
Number of cigarettes per day 1 16 7.47 3.902 52.24
Frequency of drinking alcohol per
week 1 6 1.84 1.280
69.57
Frequency of drinking coffee per day 1 6 1.53 0.864 56.47
Frequency of sport activities per week 1 9 2.35 1.837 56.47
.
Table 2. Demographics, workload, sleep restriction and risk of fatigue in short-haul commercial Indonesian pilots (n=239)
Crude
regression coefficient confidence interval95% P
Age Constant
0.009 4.330
-0.007;0.027 0.270
Frequency of unplanned flights in the last 30 days
Constant
0.139 4.512
0.068;0.211 0.000
Flight time in last 7 days Constant
0.053 3.328
0.010;0.096 0.015
Flight time in last 24 hours Constant
0.175 3.692
0.079;0.271 0.000
Flight duty time in last 24 hours Constant
0.080 3.919
0.019;0.141 0.010
Sleep restriction Constant
0.037 4.358
0.001;0.074 0.041
Physical factors at home Constant
0.002 4.653
-0.314;0.320 0.986
Tension at home/ neighborhood Constant
0.224 4.344
-0.083;0.532 0.152
Opportunity to do relaxing activity Constant
0.018 4.623
-0.161;0.198 0.841
Role at home Constant
-0.139 4.876
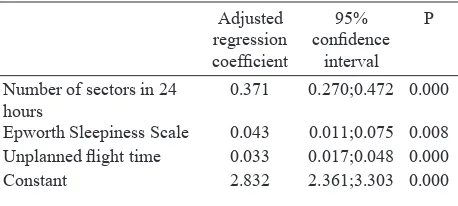
Table 3 showed that each additional sector in the last 24 hours increased FSS. One additional number of sector in the last 24 hours increased FSS by 0.371 points. Moreover, one additional ESS point increased FSS by 0.043 points. Lastly, one additional
unplanned flight increased FSS by 0.033 points.
DISCUSSION
In interpreting this study, firstly the small number of
subjects willing to participate must be considered. The low participation was probably because pilots
felt uncomfortable if the exceeded flight time was discovered by the DGCA and affect their certification
process. Secondly, fatigue was measured in subjective concept (FSS). Nevertheless, FSS is a widely used self-reporting questionnaire relating to subjects’ fatigue and its impact on functioning and behavioral aspects in the past week. FSS has good
reliability and validity with Cronbach α= 0.85.5.14
Furthermore, there were some factors effecting fatigue which were not measured in this study, for example the circadian rhythm, vibration, noise, and automation.15,16 Short-haul pilots often had
unplanned flights, early starts and late finishes, which
can result in sleep restriction and disrupt circadian rhythm. This effect was minimized by using ESS to subjectively determine the subjects’ sleepiness scale. ESS has been used in many research, recommended by the Fatigue Risk Management System (FRMS) of the International Civil Aviation Organization (ICAO) and has good reliability and validity with
Cronbach α = 0.77-0.88.9 In addition, this study was only directed to Boeing 737 type-rated short haul commercial pilots and therefore the effect of vibration and automation were expected to be similar among subjects.
The average FSS (4.66±1.202) was almost the same as the British Airline Pilots Association (BALPA)
pilots in United Kingdom (UK), Germany, French and Italy which was 4.7±1.0.5
The number of sectors was the highest factor to
significantly increase fatigue, which increased FSS by
0.371 for every additional sector in the last 24 hours. These results were consistent with a study by Powell in New Zealand that stated each additional sector was equivalent to an increase of 0.38 on the 7-point Samn-Perelli fatigue scale.4 Bourgeois-Bougrine in France also found that each additional sector was equivalent to an increase of 0.48 on the visual analog scale of fatigue.3 Take-offs and landings are critical
phase of flight that requires high concentration and
intense conversation between pilots and Air Traffic Controller (ATC).2,4 Thus several repeated sectors in a short haul operation can cause cumulative fatigue that will impair a pilot’s cognitive function leading to accidents or incidents.17
Other dominant factors of fatigue were unplanned
flight time and sleep restriction. Each additional unplanned flight time in the last 30 days and sleep
restriction increased FSS. This result was consistent with the studies in UK and BALPA pilots.2,5 By flying
unplanned flights, pilots had less rest period, which
cumulatively lead to sleep restriction and increase the risk for fatigue.
The results of multivariate analysis showed that the
frequency of unplanned flights, flight time in the last 24 hours and 7 days, and flight duty time in the
last 24 hours were not dominant factors of fatigue. These results were not consistent with the study by Bourgeois-Bougrine in France which revealed that
each additional flight time in 4 days was significantly
correlated with higher visual analog scale of fatigue.3 Powell in New Zealand also revealed that
each additional flight duty time was significantly
correlated with higher Samn-Perelli fatigue scale.4 The explanation for this dissimilarity was probably the different characteristic and measurement of
fatigue, and although some subjects may fly the same flight time or flight duty time, each subjects flew different numbers of sectors. That is probably
why the number of sector was the highest factor to
significantly increase fatigue.
Personal factors at home and managerial support were not dominant factors of fatigue. These results were not consistent with Deros in Malaysia which revealed that fatigue in Malaysian pilots was due to trouble sleeping because of personal worries.18 While Steptoe revealed that subjects with low perception of organizational justice were less likely Table 3. The dominant factors related to fatigue in short-haul
commercial Indonesian pilots (n=239)
Number of sectors in 24 hours
0.371 0.270;0.472 0.000
Epworth Sleepiness Scale 0.043 0.011;0.075 0.008
Unplanned flight time 0.033 0.017;0.048 0.000
to have lowered fatigue scale.5 These differences were explained by Yuliana who studied the same population in 2013. It was stated that pilots were highly intellectual and rational people who had the ability to use coping strategy such as comfort in religion that will decrease distress level as much as 51%.10 But this requires further study to investigate the effects of distress and coping strategy on fatigue.
This study revealed that fatigue was a multi-factorial physiologic condition that was caused by an imbalance between workload and recovery sleep. Fatigue could impair a pilot’s cognitive function to safely operate an aircraft. Therefore, it is important for pilots to get enough rest-period, understand their fatigue level
before considering a flight duty especially unplanned flights, assemble a good Crew Resource Management
(CRM), and notably manage safety culture and safety
report for every flight duty (pilots must be free to
express their concern and share their thoughts of
every flight safety related conditions).
As a member ICAO, Indonesia strives to implement FRMS to our regulations. This study was conducted
as the first step of FRMS implementation, to gather
data and information of fatigue in short-haul operation.9 Further studies are suggested to establish the presence of fatigue in different operations and organize a cooperative arrangement between The Ministry of Transportation Republic of Indonesia, every operating airline in Indonesia, as well as airport operator to work in harmony for adopting every step of FRMS as amended by the ICAO.
In conclusion, additional number of sectors in 24
hours, additional unplanned flight times within 30
days, and sleep restriction increased the risk of fatigue among short-haul commercial pilots in Indonesia.
Acknowledgment
The authors sincerely thank The Director General of Civil Aviation, Ministry of Transportation for facilitating this study, and to all commercial pilots who willingly took time to participate and contribute invaluably in this study.
REFERENCES
1. Costa G. Fatigue and biological rhythms. In: Wise JA, Hopkin VD, J GD, editors. Handbook of aviation human factor. Second Edition. Boca Raton, Florida: CRC Press Taylor & Francis Group; 2010: p. 11-1-23.
2. Jackson CA, Earl L. Prevalence of fatigue among commercial pilots. Occup Med. 2006;56:263–8.
3. Bourgeois-bougrine S, Carbon P, Gounelle C, et al. Perceived fatigue for short- and long-haul flights : A Survey of 739 airline pilots. Aviat space environ med. 2003;74:1072-7.
4. Powell DMC, Spencer MB, Holland D, et al. Pilot fatigue in short-haul operations: effects of number of sectors, duty length, and time of day. Aviat space environ med. 2007 Jul;78:698–701.
5. Steptoe A, Bostock S. A survey of fatigue and well-being among commercial airline pilots. Final Report 7th February 2011. UCL psychology group department of epidemiology and public health, London, WC1E6BT: Survey commissioned by BALPA. 2011:1–39.
6. International Standards and Recommended Practices. International Civil Aviation Organization (ICAO). Annex 6 to the Convention on International Civil Aviation. Operation of Aircraft Part I International Commercial Air Transport-Aero planes. Attachment A. Flight time and flight duty period limitations. Eight Edition. July 2001. ICAO; 2001:p.ATT1-2.
7. Kuntjoroadi W, Safitri N. Analysis of competitive strategy in the commercial aviation business competition. Business bureaucracy. J Ilmu Adm dan Organ. 2009;16:45–52.
8. Civil Aviation Safety Regulations (PKPS) part 121 (amdt.8). Certification and operating requirements: domestic, flag, and supplemental air carriers. Subpart Q flight and duty time limitation and rest requirements. Nomor: PM Year 2013 Republik Indonesia; 2013:p. Q–1 – 4. Indonesian.
9. International Civil Aviation Organization (ICAO). Fatigue risk management systems implementation guide for operators. Appendix B. Montreal, Canada: ICAO; 2011:p. l.1–26.
10. Yuliana, Widyahening IS, Mustopo WI., Basuki B. The effect of total flight hours and other dominant factors on the risk of distress in civilian pilots in Indonesia. Health Science J Indones. 2015;2:17-22.
11. Caldwell JA, Mallis MM, Caldwell JL, et al. Fatigue countermeasures in aviation. Aviat Space Environ Med. 2009;80:29–59.
12. Rathjen T, Whitmore M, Mcguire K, et al. An introduction to human factors in aerospace. In: Davis JR, Johnson R, Stepanek J, Forgaty JA, editors. Fundamentals of aerospace medicine. Fourth edition. Philadelphia, USA: Lippincot Williams & Wilkins; 2008: p.491–515.
13. Hulley SB, Cummings SR, Browner WS, et al. Designing clinical research. Third edition. Philladelphia, USA: Lippincott Williams & Wilkins; 2001.
14. Reis C, Mestre C, Canhão H. Prevalence of fatigue in a group of airline pilots. Aviat space environ med. 2013 Aug 1;84:828–33.
16. Mallis MM, Banks S, Dinges DF. Aircrew fatigue, sleep need and circadian rhythmicity. Dalam: Salas E, Maurino D, editors. Human factors in aviation. Second edition. Burlington, USA: Elsevier Inc; 2010: 401–36. 17. Gander PH, Gregory KB, Graeber RC, et al. Flight crew
fatigue II: Short-haul fixed-wing air transport operations.
Aviat Space Environ Med. 1998;69 (9 Supplement). No.9. (September 1998):B8–15.