131
Lampiran 1
KUISIONER ANALISIS KUALITAS PELAYANAN TERHADAP
LOYALITAS PELANGGAN DAN KEPUASAN KERJA
I. IdentitasResponden
Nama
:
JenisKelamin :Laki-laki/Perempuan
Pekerjaan
:
A. PetunjukPengisian
Berilahtanda (
√
) seberapabesartingkatpersetujuanAndaterhadappertanyaanpertanyaan
berikut. Jawaban yang tersediaberupaskalaLikertyaituantara 1-5, yang
mempunyaiarti :
1 = SangatTidakSetuju
2 = TidakSetuju
3 = BiasaSaja/ Netral
4 = Setuju
5 = SangatSetuju
BuktiFisik
no
item
STS
TS
N
S
SS
132 2
RuangBelajar yang Nyaman
3
Kerapian Pakaian Karyawan
dan Pengajar
4
Teknologi Yang di gunakan
canggih
Kehandalan
no
item
STS
TS
N
S
SS
1
Kehandalan Dalam Memberikan
Jasa
2
Memiliki Jadwal yang Tetap
3
KetepatanWaktu Yang
133
DayaTanggap
no
item
STS
TS
N
S
SS
1
Cepat dan Tanggap
2
Kejelasan Produk Yang
Ditawarkan
3
Kesedian Untuk Membantu
4
Kemampuan Mengatasi
Keluhan
Jaminan
no
item
STS
TS
N
S
SS
1
Kemampuan dan Ketrampilan
Pegawai atau Pengajar
2
Rasa aman
3
Kesabaran dan Keramahan
134
no
item
STS
TS
N
S
SS
1
Memberikan Perhatian Kepada
Pelanggan
2
Pelayanan tanpa Memandang
Status
LoyalitasPelanggan
no
item
STS
TS
N
S
SS
1
Konsistensi Penggunaan Jasa
2
Merekomendasikan Kepada
Pihak lain
3
Tidak Beralih kepada Bimbingan
lain
KepuasanPelangggan
no
item
STS
TS
N
S
SS
1
Memproleh Jasa yang Bernilai
135
Lampiran 2
Uji Sampel
136
38 4 4 3 4 4 4 3 4 4 4 4 4 4 4
39 3 5 5 4 4 5 4 3 3 5 4 4 5 4
40 5 5 5 4 5 4 5 5 5 4 4 4 4 4
Lanjutan lampiran 2
Uji Sampel
137
Lanjutan lampiran 2
Uji Sampel
138
Lanjutan lampiran 2
Uji Sampel
141
Lampiran 3 - Uji Validitas dan Reabilitas
Uji validitas
Item-Total Statistics
Scale Mean if Item Deleted
Scale Variance if Item Deleted
Item-142 Uji Validitas (setelah diresidu)
Item-Total Statistics
Scale Mean if
Item Deleted
Scale Variance if
Item Deleted
Corrected
Item-Total Correlation
143
Uji Realibilitas
Reliability Statistics
Cronbach's Alpha N of Items
,935 28
144
Histogram Hipotesis 1
145 Hasil Analisis One Sample KS Test Hipotesis 1
One-Sample Kolmogorov-Smirnov Test
Unstandardized
Residual
N 80
Normal Parametersa,b Mean ,0000000
Std. Deviation ,36041191
Most Extreme Differences Absolute ,113
Positive ,080
Negative -,113
Test Statistic ,113
Asymp. Sig. (2-tailed) ,013c
a. Test distribution is Normal.
b. Calculated from data.
Hasil Analisis Instrumen Multikolinearitas Hipotesis 1 Coefficientsa
146 Scatterplot Dependent Variabel (Kepuasan Pelanggan) Hipotesis 1
Hasil instrumen Uji-t (Pengaruh parsial hipotesis 1) Coefficientsa
Model
Unstandardized Coefficients
Standardized
Coefficients
T Sig.
B Std. Error Beta
1 (Constant) 1,497 ,340 4,396 ,000
KUALITAS_LAYANAN ,629 ,086 ,637 7,295 ,000
147
Histogram Hipotesis II
Hasil Koefisien Determinasi (R2) Hipotesis 1 Model Summaryb
Model R R Square
Adjusted R
Square
Std. Error of the
Estimate
1 ,637a ,406 ,398 ,36271
a. Predictors: (Constant), KUALITAS_LAYANAN
b. Dependent Variable: KEPUASAN_PELANGGAN
148
Uji Normalitas Hipotesis II
Hasil Instrumen One Sample KS Test Hipotesis II
One-Sample Kolmogorov-Smirnov Test
Unstandardized Residual
N 80
Normal Parametersa,b Mean ,0000000
Std. Deviation ,23598929 Most Extreme Differences Absolute ,082 Positive ,064 Negative -,082
Test Statistic ,082
Asymp. Sig. (2-tailed) ,200c,d
149
Scatterplot Dependent Variabel
(Loyalitas Pelanggan) Hipotesis II
Hasil Analisis Instrumen Multikolinearitas Hipotesis II
Coefficientsa
Model
Unstandardized Coefficients
Standardized Coefficients
t Sig.
Collinearity Statistics
B Std. Error Beta Tolerance VIF
1 (Constant) ,516 ,223 2,313 ,023
KUALITAS_LAYAN
AN ,918 ,056 ,879 16,273 ,000 1,000 1,000
150
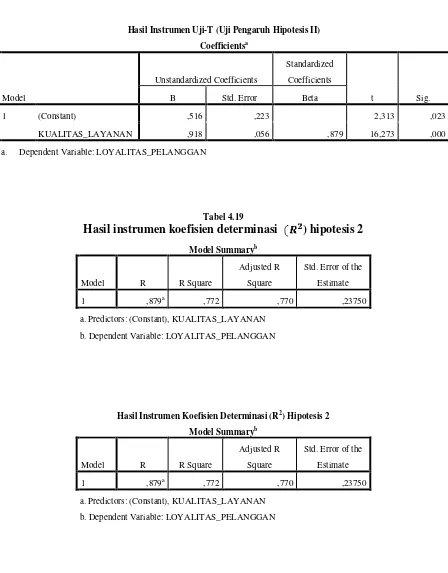
Hasil Instrumen Uji-T (Uji Pengaruh Hipotesis II)
Coefficientsa
Model
Unstandardized Coefficients
Standardized
a. Dependent Variable: LOYALITAS_PELANGGAN
Tabel 4.19
Hasil instrumen koefisien determinasi
) hipotesis 2
Model Summaryb
Model R R Square
Adjusted R Square
Std. Error of the Estimate
1 ,879a ,772 ,770 ,23750
a. Predictors: (Constant), KUALITAS_LAYANAN b. Dependent Variable: LOYALITAS_PELANGGAN
Hasil Instrumen Koefisien Determinasi (R2) Hipotesis 2
Model Summaryb
Model R R Square
Adjusted R Square
Std. Error of the Estimate
1 ,879a ,772 ,770 ,23750
151
Lampiran 6- Uji Asumsi Klasik Hipotesis 3
152
Uji Normalitas Hipotesis III
Hasil Analisis Instrumen One Sample KS – Test Hipotesis III
One-Sample Kolmogorov-Smirnov Test
Unstandardized Residual
N 80
Normal Parametersa,b Mean ,0000000 Std. Deviation ,23598929 Most Extreme Differences Absolute ,082 Positive ,064 Negative -,115
Test Statistic 1.179
Asymp. Sig. (2-tailed) ,125c,d
a. Test distribution is Normal. b. Calculated from data.
Hasil Analisis Instrumen Multikolinearitas Hipotesis III
Coefficientsa
Model
Unstandardized Coefficients
Standardized Coefficients
t Sig.
Collinearity Statistics
B Std. Error Beta Tolerance VIF
1 (Constant) ,516 ,223 2,313 ,023
KUALITAS_LAYAN
AN ,918 ,056 ,879 16,273 ,000 1,000 1,000
153
Scatterplot Dependent Variable
(Loyalitas Pelanggan) Hipotesis III
Hasil Uji T Hipotesis III
Coefficientsa
Model
Unstandardized Coefficients
Standardized Coefficients
T Sig. B Std. Error Beta
1 (Constant) 1,959 ,410 4,780 ,000
KEPUASAN_PELANGGAN ,545 ,103 ,515 5,301 ,000
154
Hasi Instrumen Determinasi ) Hipotesis III
Model Summaryb
Model R R Square
Adjusted R Square
Std. Error of the Estimate
1 ,515a ,265 ,255 ,42689
a. Predictors: (Constant), KEPUASAN_PELANGGAN b. Dependent Variable: LOYALITAS_PELANGGAN
Lampiran 5- Uji Asumsi Klasik Analisis Jalur
Hasil Instrumen Uji-F (Uji Serempak) Hipotesis IV
ANOVAa
Model Sum of Squares Df Mean Square F Sig.
1 Regression 14,497 2 7,249 173,929 ,000b
Residual 3,209 77 ,042
Total 17,706 79
a. Dependent Variable: KUALITAS_LAYANAN
b. Predictors: (Constant), LOYALITAS_PELANGGAN, KEPUASAN_PELANGGAN
Uji Ketepatan Predictor
Descriptive Statistics
N Minimum Maximum Mean Std. Deviation
155
Uji Ketepatan Predictor
Model Summary
Model R R Square
Adjusted R Square
Std. Error of the Estimate
1 ,905a ,819 ,814 ,20415
c. Predictors: (Constant), LOYALITAS_PELANGGAN, KEPUASAN_PELANGGAN
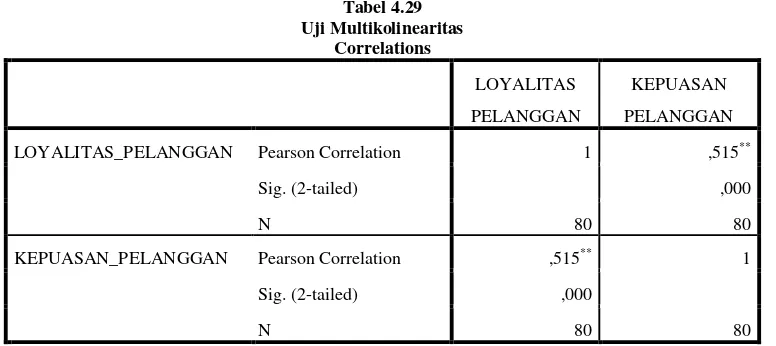
Tabel 4.29 Uji Multikolinearitas
Correlations
LOYALITAS PELANGGAN
KEPUASAN PELANGGAN
LOYALITAS_PELANGGAN Pearson Correlation 1 ,515**
Sig. (2-tailed) ,000
N 80 80
KEPUASAN_PELANGGAN Pearson Correlation ,515** 1
Sig. (2-tailed) ,000
N 80 80
**. Correlation is significant at the 0.01 level (2-tailed).
156
Uji Normalitas Hipotesis IV
157
Hasil instrument determinasi hipotesis IV
Model Summary
Model R R Square
Adjusted R Square
Std. Error of the Estimate
1 ,905a ,819 ,814 ,20415
a. Predictors: (Constant), LOYALITAS_PELANGGAN, KEPUASAN_PELANGGAN
Hasil Instrumen Uji-F (Uji Serempak) Hipotesis IV
ANOVAa
Model Sum of Squares Df Mean Square F Sig.
1 Regression 14,497 2 7,249 173,929 ,000b
Residual 3,209 77 ,042
158
Hasil Instrumen Uji-T (Uji parsial) hipotesis IV
Coefficientsa
Model
Unstandardized Coefficients
Standardized
a. Dependent Variable: KUALITAS_LAYANAN
Menghitung Koefisien Korelasi
Correlations
LOYALITAS_PE LANGGAN
KEPUASAN_PE LANGGAN
LOYALITAS_PELANGGAN Pearson Correlation 1 ,515**
Sig. (2-tailed) ,000
N 80 80
KEPUASAN_PELANGGAN Pearson Correlation ,515** 1
Sig. (2-tailed) ,000
N 80 80
**. Correlation is significant at the 0.01 level (2-tailed).