Page 1 of 7 17 Februari 2016
Samuel Equity Research
Company Update
Ultrajaya Milk Industry
Bloomberg: ULTJ.IJ | Reuters: ULTJ.JKDISCLAIMER: Analyst Certification: The views expressed in this research accurately reflect the personal views of the analyst(s) about the subject securities or issuers and no part of the
compensation of the analyst(s) was, is, or will be directly or indirectly related to the inclusion of specific recommendation s or views in this research. The analyst(s) principally responsible for the preparation of this research has taken reasonable care to achieve and maintain independence and objectivity in making any recommendations. This document is for information only and for the use of the recipient. It is not to be reproduced or copied or made available to others. Under no circumstances is it to be considered as an offer to sell or solicitation to buy any security. Any recommendation contained in this report may not be suitable for all investors. Moreover, although the infor mation contained herein has been obtained from sources
Continuing Improvement
Pelemahan harga susu bubuk yang disebabkan salah satunya oleh penurunan permintaan dari China, kami lihat akan memberikan benefit pada kinerja operasional ULTJ tahun ini. Rendahnya harga susu bubuk dibarengi dengan potensi berlanjutnya penguatan nilai tukar rupiah serta peningkatan daya beli masyarakat menjadi tiga katalis utama yang kami harapkan akan mendorong ULTJ untuk membukukan peningkatan pendapatan setara dengan angka proyeksi kami. Kami juga masih menjadikan rendahnya tingkat konsumsi susu per kapita dan kekuatan ekuitas merek ULTJ sebagai dua kekuatan utama penggerak pertumbuhan marjin kedepannya. Kami mempertahankan sudut pandang positif kami pada kinerja ULTJ FY16 dan memberikan rekomendasi BUY dengan target harga DCF 12M sebesar Rp4,800/lembar saham (16E’PE 20.9x dan 16E PBV 5.0x). Ekspektasi penguatan marjin. Catatan perbaikan kinerja marjin laba kotor ULTJ sejak
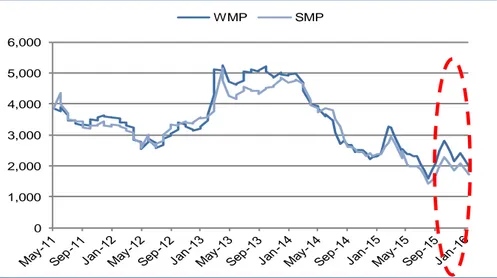
1H15 kami perkirakan akan terus berlanjut, utamanya didorong oleh masih rendahnya harga susu bubuk dunia hingga akhir Jan16. Harga susu bubuk telah mengalami penurunan tajam hingga mencapai sebesar -65% dari titik tertingginya sejak Apr13, seiring dengan pelemahan permintaan dari China sebagai pengimpor susu terbesar di dunia. Kondisi tersebut kami perkirakan masih akan berlanjut hingga akhir tahun ini dan akan mendorong potensi kenaikan marjin laba kotor ULTJ sebesar 17% sehingga mengakibatkan meningkatnya marjin laba operasi sebesar 60bps dan marjin laba bersih sebesar 40bps.
Rencana ekspansi pabrik untuk menjaga ketersediaan suplai susu. Salah satu
cara untuk meredam volatilitas harga susu di pasar adalah dengan mengatur ketersediaan suplai sapi. Kami melihat ULTJ cukup responsif di dalam mengatasi resiko keterbatasan suplai, salah satunya melalui pengembangan peternakan di Berastagi, Sumatera Utara. Pasca beroperasinya peternakan tersebut tahun ini, kami memperkirakan setidaknya akan terdapat penambahan sebanyak 23.000 kapasitas head farm dari 12.000 ekor sapi dan mendorong volume produksi susu naik sebesar 5% tahun ini.
Menanti kinerja FY15. Sambil menunggu keluarnya laporan keuangan FY15, kami
masih mempertahankan rekomendasi dan target harga terakhir kami (lihat yearbook 12/01/15). Namun, tidak menutup kemungkinan bagi kami untuk menaikkan target harga apabila hasil kinerja FY15 melebihi ekspektasi kami.
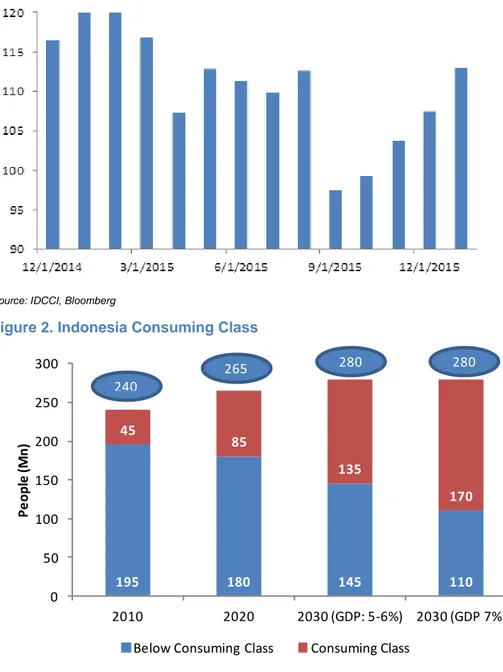
Maintain BUY. Kami meyakini permintaan susu masih akan bertumbuh kedepannya,
didukung oleh: (1). Potensi berlanjutnya kenaikan daya beli konsumen (2). Masih rendahnya tingkat konsumsi susu di Indonesia (13.04 liter per kapita per tahun vs rata-rata negara ASEAN sebesar 20 liter per tahun) dan (3) Jumlah kelas menengah masyarakat Indonesia yang terus meningkat. Kami memproyeksikan pendapatan ULTJ akan bertumbuh sebesar 15%YoY dengan kenaikan laba bersih sebesar 18.3%YoY Kekhawatiran kami terletak pada : (1) Pelemahan nilai tukar rupiah (2) Membaiknya permintaan susu bubuk dari China (3) Pertumbuhan volume penjualan dibawah ekspektasi (4) Meningkatnya persaingan minuman susu dalam kemasan (5) Likuiditas saham. Target Price Rp 4,800 Last price Rp 3,700 Potential Upside 29.7% JCI Index 4,745 Share issued (m n) 2,888 Market Cap. (Rpbn) 10,686 52-Weeks High/Low 4,300/3,460
Avg Daily Vol (m n) 0.06
Free Float 45.10%
Nom inal Value Rp 200
Book value/share ‘16 Rp 960
Relative to JCI Chart
Com pany Background
Shareholder Structure
PT Praw iraw idjaja Prakarsa 21%
Sabana Praw iraw idjaja 15%
Indolife Pensiontama 8%
PT AJ Central Asia Raya 8%
Public 45%
PT Ultrajaya Milk Industry and Trading Company operates in the food and beverage industry. The Company produces aseptic drinks such as liquid milk andtea, fruit juices and health drinks. Ultrajaya also produces butter, pow der milk and sw eet condensed milk.
BUY (Maintain)
70 170 270 370 470 570 670 770Nov-09 Nov-10 Nov-11 Nov-12 Nov-13 Nov-14 Nov-15
ULTJ JCI
Marlene Tanumihardja
+62 21 2854 8387
marlene@samuel.co.id
Forecast and Valuation (at closing price Rp3,700 per share)
Y/E Dec (Rpbn) 14A 15E 16E 17E
Sales 3,917 4,426 5,090 5,955 EBITDA 470 810 957 1,120 Net Profit 292 528 625 748 EPS (Rp/shr) 101 183 216 259 Dividend Yield (%) 0.3 0.3 0.5 0.6 BV per share (Rp/shr) 698 784 960 1,158 EV/EBITDA (x) 17.7 21.7 12.1 10.0 P/E Ratio (x) 36.6 20.2 17.1 14.3 P/BV Ratio (x) 4.7 3.9 3.2 2.7
Ultrajaya Milk Industry
ULTJ.IJ / ULTJ.JKFigure 1. Consumer Confidence Index
Source: IDCCI, Bloomberg
Figure 2. Indonesia Consuming Class
Source: Mc Kinsey
Figure 3. Milk Consumption per Capita (Liters per Annum)
195
180
145
110
45
85
135
170
0
50
100
150
200
250
300
2010
2020
2030 (GDP: 5-6%) 2030 (GDP 7%)
P
e
opl
e
(M
n)
Below Consuming Class
Consuming Class
240
265
280
280
13.4 22.1 33.7 50.9 10.0 20.0 30.0 40.0 50.0 60.0Ultrajaya Milk Industry
ULTJ.IJ / ULTJ.JKFigure 4. White Milk Powder and Skimmed Milk Powder Price (US$/MT)
Source: Bloomberg
Figure 5. Avg. milk powder prices for US$/ton and Rupiah/kg Aug’11 – Jan’16
Source: Bloomberg
Figure 6. Revenue growth, est. production growth, net margin 2009 – 2017E
Source: SSI estimates, Company data 0 1,000 2,000 3,000 4,000 5,000 6,000 WMP SMP 0 10,000 20,000 30,000 40,000 50,000 60,000 70,000 0 1,000 2,000 3,000 4,000 5,000 6,000 US$/ton (LHS) Rupiah/kg (RHS) 0.0% 5.0% 10.0% 15.0% 20.0% 25.0% 30.0% 35.0%
2009 2010 2011 2012 2013 2014 2015E 2016E 2017E Revenue growth Est. sales volume growth Net margin
Ultrajaya Milk Industry
ULTJ.IJ / ULTJ.JKFigure 7. Avg. milk powder cost Rp/kg vs. ULTJ gross margin up to 3Q15
Source: Bloomberg
Figure 8. Avg. milk powder cost Rp/kg vs. ULTJ gross margin up to 3Q15
Source: Company data, Bloomberg
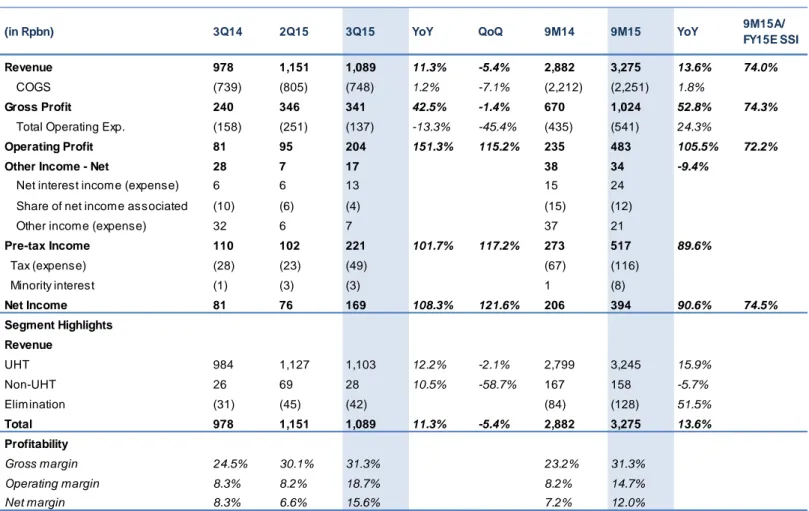
(in Rpbn) 3Q14 2Q15 3Q15 YoY QoQ 9M14 9M15 YoY 9M15A/
FY15E SSI
Revenue 978 1,151 1,089 11.3% -5.4% 2,882 3,275 13.6% 74.0%
COGS (739) (805) (748) 1.2% -7.1% (2,212) (2,251) 1.8%
Gross Profit 240 346 341 42.5% -1.4% 670 1,024 52.8% 74.3%
Total Operating Exp. (158) (251) (137) -13.3% -45.4% (435) (541) 24.3%
Operating Profit 81 95 204 151.3% 115.2% 235 483 105.5% 72.2%
Other Income - Net 28 7 17 38 34 -9.4%
Net interest income (expense) 6 6 13 15 24 Share of net income associated (10) (6) (4) (15) (12)
Other income (expense) 32 6 7 37 21
Pre-tax Income 110 102 221 101.7% 117.2% 273 517 89.6% Tax (expense) (28) (23) (49) (67) (116) Minority interest (1) (3) (3) 1 (8) Net Income 81 76 169 108.3% 121.6% 206 394 90.6% 74.5% Segment Highlights Revenue UHT 984 1,127 1,103 12.2% -2.1% 2,799 3,245 15.9% Non-UHT 26 69 28 10.5% -58.7% 167 158 -5.7% Elimination (31) (45) (42) (84) (128) 51.5% Total 978 1,151 1,089 11.3% -5.4% 2,882 3,275 13.6% Profitability Gross margin 24.5% 30.1% 31.3% 23.2% 31.3% Operating margin 8.3% 8.2% 18.7% 8.2% 14.7% Net margin 8.3% 6.6% 15.6% 7.2% 12.0% 0.0% 5.0% 10.0% 15.0% 20.0% 25.0% 30.0% 35.0% 0 10,000 20,000 30,000 40,000 50,000 60,000 1Q13 2Q13 3Q13 4Q13 1Q14 2Q14 3Q14 4Q14 1Q15 2Q15 3Q15 4Q15
Ultrajaya Milk Industry
ULTJ.IJ / ULTJ.JKFigure 9. Indonesia consumer valuation table as of close 16 February 2016 (excluding UNVR)
Source: SSI estimates, Bloomberg (*Excl. UNVR, except for PE ratio & EPS CAGR)
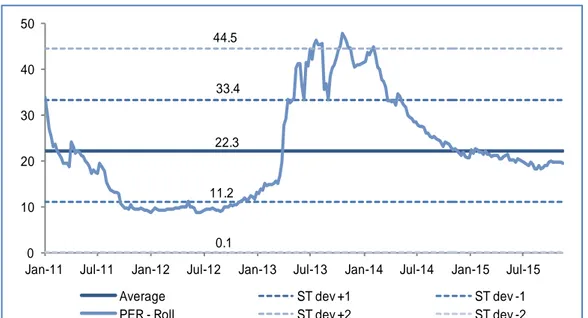
Figure 10. ULTJ’s forward PE Band
Source: SSI estimates, Bloomberg
Com pany Last Target Market cap. PEG ROE EPS CAGR
price price (Rp bn) 15E 16E (x) 15E 16E 15E 14A-16E
Unilever Indonesia (UNVR IJ) 41,500 39,000 316,645 54.7 48.9 8.8 58.5 51.5 122% 6% Kalbe Farma (KLBF IJ) 1,295 1,610 60,703 28.2 23.5 2.4 5.4 4.7 23% 12%
Indofood CBP (ICBP IJ) 15,500 15,600 90,380 26.4 23.0 1.2 5.8 5.2 17% 23%
Indofood SM (INDF IJ) 6,600 7,400 57,951 21.4 15.7 (8.7) 2.1 2.0 16% -2% Ultrajaya Milk (ULTJ IJ) 3,700 4,800 10,687 20.2 17.1 0.4 3.9 3.3 18% 46% Nippon Indosari Co. (ROTI IJ) 1,320 1,500 6,682 25.4 26.4 1.7 5.5 4.7 21% 15%
Weighted average* 42.4 37.3 (0.4) 5.1 4.5 19% 18% PE (x) PBV (x) 22.3 33.4 11.2 44.5 0.1 0 10 20 30 40 50
Jan-11 Jul-11 Jan-12 Jul-12 Jan-13 Jul-13 Jan-14 Jul-14 Jan-15 Jul-15
Average ST dev +1 ST dev -1
Ultrajaya Milk Industry
ULTJ.IJ / ULTJ.JKKey Financials
Recommendation History – Ultrajaya Milk Industry (ULTJ)
Rpbn 14A 15E 16E 17E Rpbn 14A 15E 16E 17E
Revenue 3,917 4,426 5,090 5,955 Net Income 292 528 625 748
COGS (2,980) (3,049) (3,475) (4,060) Depreciation & amortization 139 141 156 177 Gross profit 937 1,377 1,615 1,895 Working capital (315) (54) (13) (105) Gross margin (%) 23.9 31.1 31.7 31.8 Operating cash flow 116 616 768 819 Operating profit 327 669 801 942 Net - Capital expenditure (177) (150) (300) (315) Operating margin (%) 8.4 15.1 15.7 15.8 Other assets 8 (58) (100) (122)
EBITDA 470 810 957 1,120 Investing cash flow (168) (208) (400) (437)
EBITDA margin (%) 12.0 18.3 18.8 18.8 Net - Borrow ings (29) (14) (20) (22) Other income (expenses) 48 49 46 68 Other financing (41) (19) (53) (62) Pre-tax profit 376 717 846 1010 Financing cash flow (70) (33) (73) (84)
Income tax - net (92) (179) (212) (253) Net - Cash flow (122) 375 295 298
Net profit 292 528 625 748 Cash at beginning 611 489 864 1,159
Net profit margin (%) 7.4 11.9 12.3 12.6 Cash at ending 489 864 1,159 1,458
Yr-end Dec (Rpbn) 14A 15E 16E 17E Yr-end Dec 14A 15E 16E 17E
Cash & ST investment 489 864 1,159 1,458 ROE (%) 12.9 19.0 18.7 18.5 Receivables 407 458 523 610 ROA (%) 10.0 15.3 15.5 15.8 Inventories 714 738 727 794 Revenue grow th (%) 13.2 13.0 15.0 17.0 Others 31 43 37 40 EBITDA grow th (%) (18.2) 72.3 18.1 17.0
Total current assets 1,642 2,103 2,446 2,902 EPS grow th (%) -10.3 81.0 18.3 19.7
Net fixed assets 1,003 1,012 1,156 1,294 Interest coverage (x) n/a n/a n/a n/a Other assets 272 329 430 551 Debt to equity (%) 1.1 0.6 0.6 0.6
Total assets 2,917 3,445 4,032 4,747 Net gearing (%) -17.8% -28.4% -32.8% -35.1%
Payables 385 402 443 496
ST. debt and curr. maturity 25 18 21 24
Other current liabilities 81 96 91 89 Major Assumptions
LT. debt 0 0 0 0 Yr-end Dec 14A 15E 16E 17E
Other long term liabilities 101 96 91 86 ASP grow th est (%) 10.0 3.0 0.0 1.0
Total liabilities 652 671 686 716 Average Rupiah/US$ 11,885 13,500 13,600 13,200
Total equity 2,265 2,774 3,346 4,031 Milk pow der cost (US$/ton) 3,547 2,588 2,328 2,104
Profit and Loss Statement
Balance Sheet
Cash Flow
Key Ratios
Date Recommendation Close Price Target
6-Aug-15 Buy 3,900 4,800 12-May-15 Buy 4,030 4,800 9-Apr-15 Hold 3,995 4,000 7-Nov-14 Buy 3,800 4,525 4-Jul-14 Buy 4,005 4,470 17-Apr-14 Buy 4,040 5,300