CHAPTER IV
RESULT OF
THE STUDY AND DISCUSSION
This chapter discusses the questionnaire recapitulation result filled by the
users of English Education graduates of State Islamic Institute of Palangka Raya
that was directly distributed to the institutions where they are working. The results
of the research used questionnaire as the instrument for collecting the data. The
presented data consist of responses and central tendency.
A.
The Career of English Education Graduates
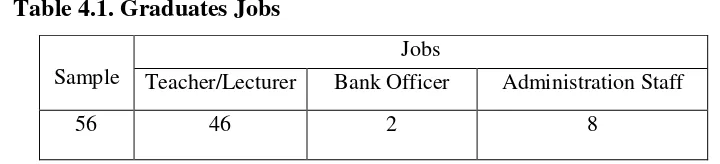
The jobs of English education graduates
Table 4.1. Graduates Jobs
Sample
Jobs
Teacher/Lecturer
Bank Officer
Administration Staff
56
46
2
8
B.
Users’Perception
on English Education Graduates Performances
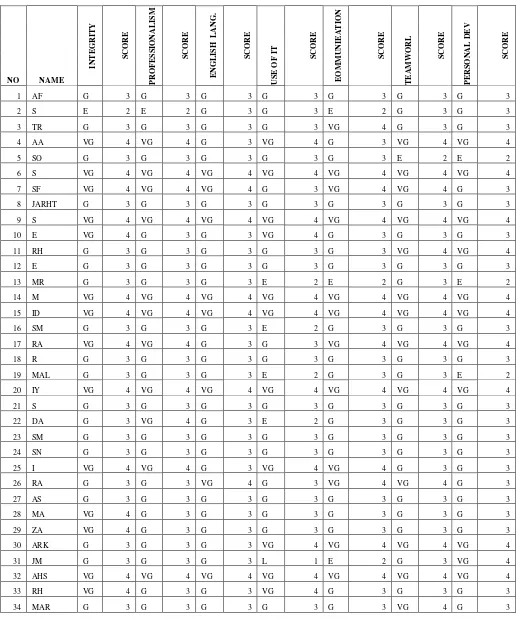
From all English Education graduates in Palangka Raya, many of them
are working in government instances and privates. The questionnaire
consists of seven aspects; integrity, professionalism, English language, the
use of information technology, communication, teamwork and personal
development. The recapitulation of
users’perception
is as shown in the table
below:
Table 4.3. Recapitulation of
graduateusers’perception
NO NAME
IN T E GR IT Y S C OR E PR OFE S S ION A L IS M S C OR E E N GLISH L A N G . S C OR E U S E OF I T S C OR E E OM M U N IE A T ION S C OR E T E A M WOR L S C OR E PE R S ON A L D E V S C OR E
1 AF G 3 G 3 G 3 G 3 G 3 G 3 G 3
2 S E 2 E 2 G 3 G 3 E 2 G 3 G 3
3 TR G 3 G 3 G 3 G 3 VG 4 G 3 G 3
4 AA VG 4 VG 4 G 3 VG 4 G 3 VG 4 VG 4
5 SO G 3 G 3 G 3 G 3 G 3 E 2 E 2
6 S VG 4 VG 4 VG 4 VG 4 VG 4 VG 4 VG 4
7 SF VG 4 VG 4 VG 4 G 3 VG 4 VG 4 G 3
8 JARHT G 3 G 3 G 3 G 3 G 3 G 3 G 3
9 S VG 4 VG 4 VG 4 VG 4 VG 4 VG 4 VG 4
10 E VG 4 G 3 G 3 VG 4 G 3 G 3 G 3
11 RH G 3 G 3 G 3 G 3 G 3 VG 4 VG 4
12 E G 3 G 3 G 3 G 3 G 3 G 3 G 3
13 MR G 3 G 3 G 3 E 2 E 2 G 3 E 2
14 M VG 4 VG 4 VG 4 VG 4 VG 4 VG 4 VG 4
15 ID VG 4 VG 4 VG 4 VG 4 VG 4 VG 4 VG 4
16 SM G 3 G 3 G 3 E 2 G 3 G 3 G 3
17 RA VG 4 VG 4 G 3 G 3 VG 4 VG 4 VG 4
18 R G 3 G 3 G 3 G 3 G 3 G 3 G 3
19 MAL G 3 G 3 G 3 E 2 G 3 G 3 E 2
20 IY VG 4 VG 4 VG 4 VG 4 VG 4 VG 4 VG 4
21 S G 3 G 3 G 3 G 3 G 3 G 3 G 3
22 DA G 3 VG 4 G 3 E 2 G 3 G 3 G 3
23 SM G 3 G 3 G 3 G 3 G 3 G 3 G 3
24 SN G 3 G 3 G 3 G 3 G 3 G 3 G 3
25 I VG 4 VG 4 G 3 VG 4 VG 4 G 3 G 3
26 RA G 3 G 3 VG 4 G 3 VG 4 VG 4 G 3
27 AS G 3 G 3 G 3 G 3 G 3 G 3 G 3
28 MA VG 4 G 3 G 3 G 3 G 3 G 3 G 3
29 ZA VG 4 G 3 G 3 G 3 G 3 G 3 G 3
30 ARK G 3 G 3 G 3 VG 4 VG 4 VG 4 VG 4
31 JM G 3 G 3 G 3 L 1 E 2 G 3 VG 4
32 AHS VG 4 VG 4 VG 4 VG 4 VG 4 VG 4 VG 4
33 RH VG 4 G 3 G 3 VG 4 G 3 G 3 G 3
35 NA VG 4 VG 4 VG 4 G 3 VG 4 VG 4 VG 4
36 AA G 3 G 3 G 3 G 3 G 3 G 3 G 3
37 RDC VG 4 VG 4 VG 4 G 3 G 3 VG 3 G 3
38 YK VG 4 G 3 G 3 G 3 VG 4 VG 3 VG 4
39 JSP G 3 G 3 G 3 G 3 G 3 E 2 G 3
40 IL G 3 G 3 G 3 G 3 G 3 G 4 G 3
41 AN G 3 G 3 G 3 E 2 G 3 G 4 G 3
42 IA G 3 G 3 G 3 E 2 G 3 G 4 G 3
43 ANJ VG 4 VG 4 VG 4 VG 4 VG 4 VG 4 VG 4
44 ADS VG 4 VG 4 VG 4 VG 4 VG 4 VG 4 VG 4
45 ESS VG 4 G 3 G 3 G 3 G 3 G 3 G 3
46 AS VG 4 VG 4 G 3 G 3 VG 4 VG 4 G 3
47 HNA G 3 G 3 G 3 G 3 G 3 G 3 E 2
48 MH G 3 G 3 G 3 G 3 VG 4 VG 4 G 3
49 S G 3 G 3 E 2 E 2 G 3 E 2 G 3
50 IA G 3 G 3 G 3 E 2 G 3 E 2 E 2
51 DF VG 4 VG 4 VG 4 G 3 VG 4 VG 4 VG 4
52 RS G 3 VG 4 VG 4 G 3 G 3 VG 4 G 3
53 NS G 3 G 3 G 3 G 3 G 3 G 3 G 3
54 Y VG 4 G 3 G 3 G 3 G 3 G 3 G 3
55 MRS VG 4 G 3 G 3 VG 4 VG 4 VG 4 G 3
56 AM VG 4 G 3 G 3 G 3 VG 4 VG 4 G 3
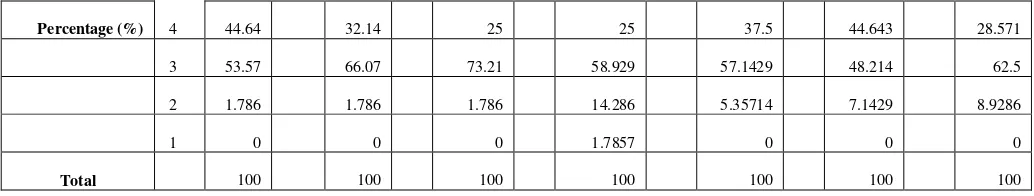
Mean 3.429 3.304 3.232 3.0714 3.32143 3.375 3.1964
VG 25 18 14 14 21 25 16
G 30 37 41 33 32 27 35
E 1 1 1 8 3 4 5
L 0 0 0 1 0 0 0
Modus 3 3 3 3 3 3 3
Percentage (%) 4 44.64 32.14 25 25 37.5 44.643 28.571
3 53.57 66.07 73.21 58.929 57.1429 48.214 62.5
2 1.786 1.786 1.786 14.286 5.35714 7.1429 8.9286
1 0 0 0 1.7857 0 0 0
Total 100 100 100 100 100 100 100
Table 4.3
shows the users’ perception of
all graduates with mean, median and
C.
Discussion
The followings are
users’perception
on English Education graduates performances:
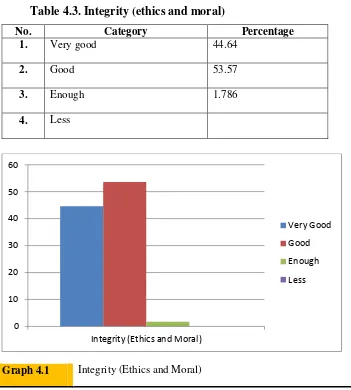
Table 4.3. Integrity (ethics and moral)
No.
Category
Percentage
1.
Very good
44.64
2.
Good
53.57
3.
Enough
1.786
4.
Less
Graph 4.1
Integrity (Ethics and Moral)
Graph 4.1 shows the
users’perception
on
graduates’
integrity related to the workfield the graduates
are working right now. From the graph above, in general the users assumed that graduates have good
integrity.
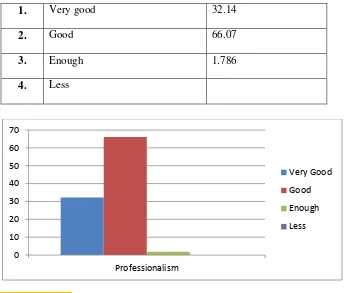
Table 4.4. Professionalism
No.
Category
Percentage
0
10
20
30
40
50
60
Integrity (Ethics and Moral)
Very Good
Good
Enough
3.
Enough
1.786
4.
Less
Graph 4.2
Professionalism
Graph4.2shows the
users’perception
on
graduates’
professionalism related to the workfield
the graduates are working right now. From the graph above, in general the users assumed that
graduates have good professionalism.
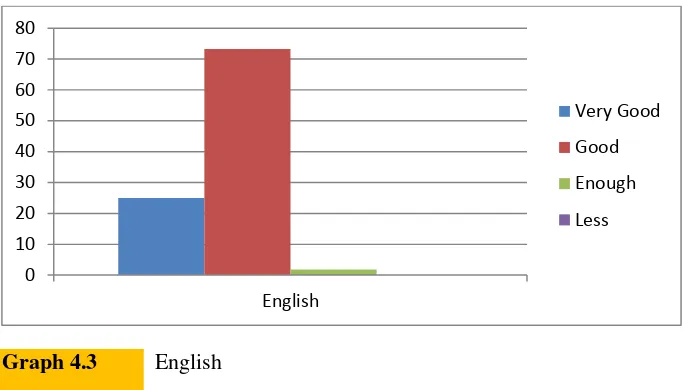
Table 4.5. English
No.
Category
Percentage
1.
Very good
25
2.
Good
73.21
3.
Enough
1.786
4.
Less
0
10
20
30
40
50
60
70
Professionalism
Very Good
Good
Enough
Graph 4.3
English
Graph 4.3 shows the
users’perception
on
graduates’
English related to the workfield the graduates are
working right now. From the graph above, in general the users assumed that graduates have good
English.
Table 4.6. Use of Information Technology
No.
Category
Percentage
1.
Very good
25
2.
Good
58.929
3.
Enough
14.286
4.
Less
1.7857
Graph 4.4
Use of Information Technology
Graph 4.4 shows the
users’perception
on
graduates’
use of information technology related to the
workfield the graduates are working right now. From the graph above, in general the users assumed
that graduates have good use of information technology.
0
10
20
30
40
50
60
70
80
English
Very Good
Good
Enough
Less
0
10
20
30
40
50
60
70
Use of Information Technology
Very Good
Good
Enough
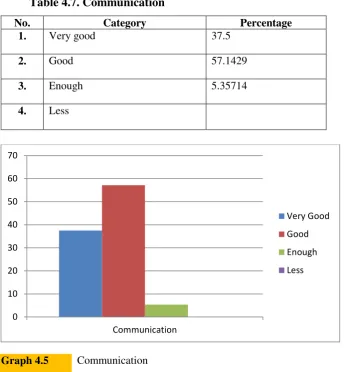
1.
Very good
37.5
2.
Good
57.1429
3.
Enough
5.35714
4.
Less
Graph 4.5
Communication
Graph 4.5 shows the
users’perception
on
graduates’
communication related to the workfield the
graduates are working right now. From the graph above, in general the users assumed that graduates
have good communication.
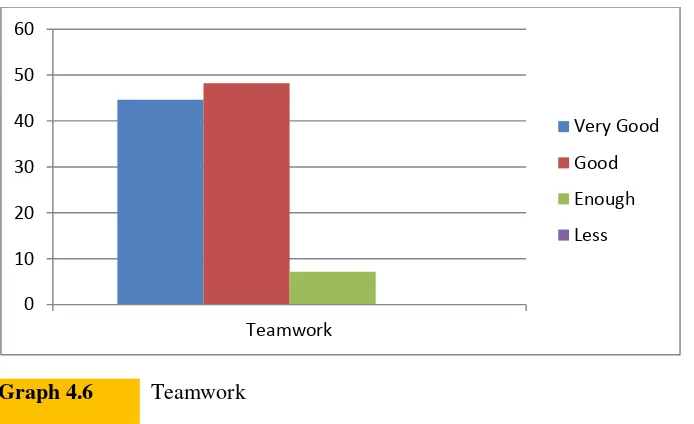
Table 4.8. Teamwork
No.
Category
Percentage
1.
Very good
44.643
2.
Good
48.214
3.
Enough
7.1429
4.
Less
0
10
20
30
40
50
60
70
Communication
Very Good
Good
Enough
Graph 4.6
Teamwork
Graph 4.6 shows the
users’perception
on
graduates’
teamwork related to the workfield the graduates
are working right now. From the graph above, in general the users assumed that graduates have good
teamwork.
Table 4.9. Personal Development
No.
Category
Percentage
1.
Very good
28.571
2.
Good
62.5
3.
Enough
8.9286
4.
Less
0
10
20
30
40
50
60
Teamwork
Very Good
Good
Enough
Less
0
10
20
30
40
50
60
70
Personal Development
Very Good
Good
Enough
Graph 4.7 shows the
users’perception
on
graduates’
personal development related to the workfield
the graduates are working right now. From the graph above, in general the users assumed that
graduates have good personal development.
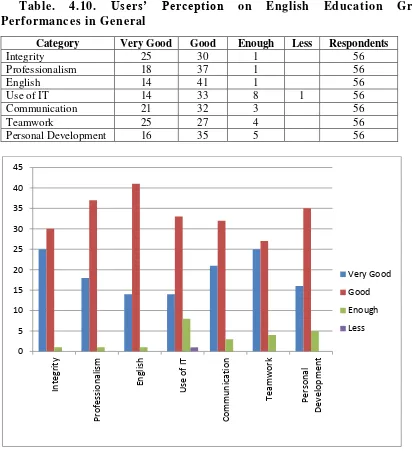
Table. 4.10.
Users’ Perception
on English Education Graduate
Performances in General
Category
Very Good
Good
Enough
Less
Respondents
Integrity
25
30
1
56
Professionalism
18
37
1
56
English
14
41
1
56
Use of IT
14
33
8
1
56
Communication
21
32
3
56
Teamwork
25
27
4
56
Personal Development
16
35
5
56
Graph 4.8 shows the
users’perception
on
graduates’
performances in general related to the
workfield the graduates are working right now. From the graph above, the users assumed that