The Big Data Transformation
Understanding Why Change Is Actually Good for Your Business
The Big Data Transformation
by Alice LaPlante
Copyright © 2017 O’Reilly Media Inc. All rights reserved. Printed in the United States of America.
Published by O’Reilly Media, Inc., 1005 Gravenstein Highway North, Sebastopol, CA 95472.
O’Reilly books may be purchased for educational, business, or sales promotional use. Online editions are also available for most titles (http://safaribooksonline.com). For more information, contact our corporate/institutional sales department: 800-998-9938 or
Editors: Tim McGovern and Debbie Hardin
Production Editor: Colleen Lobner
Copyeditor: Octal Publishing Inc.
Interior Designer: David Futato
Cover Designer: Randy Comer
Illustrator: Rebecca Demarest
Revision History for the First Edition
2016-11-03: First Release
The O’Reilly logo is a registered trademark of O’Reilly Media, Inc. The Big Data Transformation, the cover image, and related trade dress are trademarks of O’Reilly Media, Inc.
While the publisher and the author have used good faith efforts to ensure that the information and instructions contained in this work are accurate, the publisher and the author disclaim all responsibility for errors or omissions, including without limitation responsibility for damages resulting from the use of or reliance on this work. Use of the information and instructions contained in this work is at your own risk. If any code samples or other technology this work contains or describes is subject to open source licenses or the
intellectual property rights of others, it is your responsibility to ensure that your use thereof complies with such licenses and/or rights.
Chapter 1. Introduction
We are in the age of data. Recorded data is doubling in size every two years, and by 2020 we will have captured as many digital bits as there are stars in the universe, reaching a staggering 44 zettabytes, or 44 trillion gigabytes. Included in these figures is the business data generated by enterprise
Big Data: A Brief Primer
Gartner’s description of big data — which focuses on the “three Vs”: volume, velocity, and variety — has become commonplace. Big data has all of these characteristics. There’s a lot of it, it moves swiftly, and it comes from a diverse range of sources.
A more pragmatic definition is this: you know you have big data when you possess diverse datasets from multiple sources that are too large to cost-effectively manage and analyze within a reasonable timeframe when using your traditional IT infrastructures. This data can include structured data as found in relational databases as well as unstructured data such as documents, audio, and video.
IDG estimates that big data will drive the transformation of IT through 2025. Key decision-makers at enterprises understand this. Eighty percent of
enterprises have initiated big data–driven projects as top strategic priorities. And these projects are happening across virtually all industries. Table 1-1
lists just a few examples.
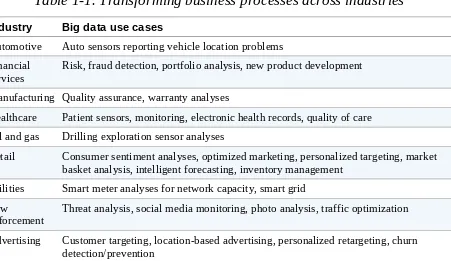
Table 1-1. Transforming business processes across industries
Industry Big data use cases
Automotive Auto sensors reporting vehicle location problems Financial
services Risk, fraud detection, portfolio analysis, new product development Manufacturing Quality assurance, warranty analyses
Healthcare Patient sensors, monitoring, electronic health records, quality of care Oil and gas Drilling exploration sensor analyses
Retail Consumer sentiment analyses, optimized marketing, personalized targeting, market basket analysis, intelligent forecasting, inventory management
Utilities Smart meter analyses for network capacity, smart grid Law
enforcement Threat analysis, social media monitoring, photo analysis, traffic optimization Advertising Customer targeting, location-based advertising, personalized retargeting, churn
A Crowded Marketplace for Big Data Analytical
Databases
Given all of the interest in big data, it’s no surprise that many technology vendors have jumped into the market, each with a solution that purportedly will help you reap value from your big data. Most of these products solve a piece of the big data puzzle. But — it’s very important to note — no one has the whole picture. It’s essential to have the right tool for the job. Gartner calls this “best-fit engineering.”
This is especially true when it comes to databases. Databases form the heart of big data. They’ve been around for a half century. But they have evolved almost beyond recognition during that time. Today’s databases for big data analytics are completely different animals than the mainframe databases from the 1960s and 1970s, although SQL has been a constant for the last 20 to 30 years.
There have been four primary waves in this database evolution. Mainframe databases
The first databases were fairly simple and used by government, financial services, and telecommunications organizations to process what (at the time) they thought were large volumes of transactions. But, there was no attempt to optimize either putting the data into the databases or getting it out again. And they were expensive — not every business could afford one.
Online transactional processing (OLTP) databases
The birth of the relational database using the client/server model finally brought affordable computing to all businesses. These databases became even more widely accessible through the Internet in the form of dynamic web applications and customer relationship management (CRM),
The next wave enabled businesses to combine transactional data — for example, from human resources, sales, and finance — together with operational software to gain analytical insight into their customers, employees, and operations. Several database vendors seized leadership roles during this time. Some were new and some were extensions of traditional OLTP databases. In addition, an entire industry that brought forth business intelligence (BI) as well as extract, transform, and load (ETL) tools was born.
Big data analytics platforms
During the fourth wave, leading businesses began recognizing that data is their most important asset. But handling the volume, variety, and velocity of big data far outstripped the capabilities of traditional data warehouses. In particular, previous waves of databases had focused on optimizing how to get data into the databases. These new databases were centered on getting actionable insight out of them. The result: today’s analytical databases can analyze massive volumes of data, both
structured and unstructured, at unprecedented speeds. Users can easily query the data, extract reports, and otherwise access the data to make better business decisions much faster than was possible previously. (Think hours instead of days and seconds/minutes instead of hours.) One example of an analytical database — the one we’ll explore in this document — is Vertica. Vertica is a massively parallel processing (MPP) database, which means it spreads the data across a cluster of servers, making it possible for systems to share the query-processing workload. Created by legendary database guru and Turing award winner Michael Stonebraker, and then acquired by HP, the Vertica Analytics Platform was purpose-built from its very first line of code to optimize big-data analytics.
Three things in particular set Vertica apart, according to Colin Mahony, senior vice president and general manager for Vertica:
Its creators saw how rapidly the volume of data was growing, and designed a system capable of scaling to handle it from the ground up.
Yes, You Need Another Database: Finding the
Right Tool for the Job
According to Gartner, data volumes are growing 30 percent to 40 percent annually, whereas IT budgets are only increasing by 4 percent. Businesses have more data to deal with than they have money. They probably have a traditional data warehouse, but the sheer size of the data coming in is
overwhelming it. They can go the data lake route, and set it up on Hadoop, which will save money while capturing all the data coming in, but it won’t help them much with the analytics that started off the entire cycle. This is why these businesses are turning to analytical databases.
Analytical databases typically sit next to the system of record — whether that’s Hadoop, Oracle, or Microsoft — to perform speedy analytics of big data.
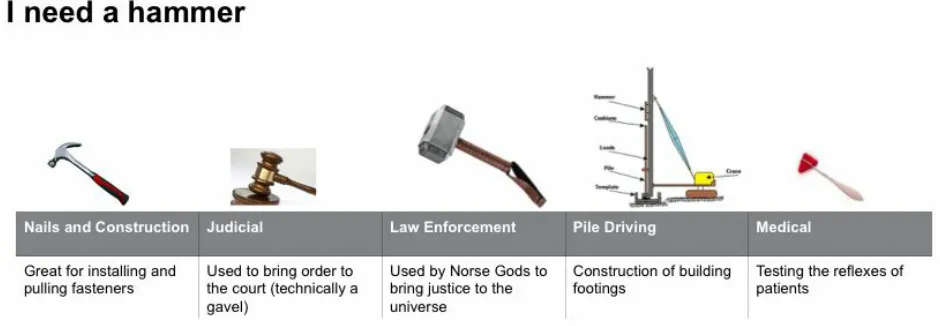
In short: people assume a database is a database, but that’s not true. Here’s a metaphor created by Steve Sarsfield, a product-marketing manager at Vertica, to articulate the situation (illustrated in Figure 1-1):
If you say “I need a hammer,” the correct tool you need is determined by what you’re going to do with it.
The same scenario is true for databases. Depending on what you want to do, you would choose a different database, whether an MPP analytical database like Vertica, an XML database, or a NoSQL database — you must choose the right tool for the job you need to do.
You should choose based upon three factors: structure, size, and analytics. Let’s look a little more closely at each:
Structure
Does your data fit into a nice, clean data model? Or will the schema lack clarity or be dynamic? In other words, do you need a database capable of handling both structured and unstructured data?
Size
Is your data “big data” or does it have the potential to grow into big data? If your answer is “yes,” you need an analytics database that can scale appropriately.
Analytics
What questions do you want to ask of the data? Short-running queries or deeper, longer-running or predictive queries?
Of course, you have other considerations, such as the total cost of ownership (TCO) based upon the cost per terabyte, your staff’s familiarity with the database technology, and the openness and community of the database in question.
Still, though, the three main considerations remain structure, size, and
Figure 1-2. Stretching the spectrum of what Vertica can do
In the end, the factors that drive your database decision are the same forces that drive IT decisions in general. You want to:
Increase revenues
You do this by investing in big-data analytics solutions that allow you to reach more customers, develop new product offerings, focus on
customer satisfaction, and understand your customers’ buying patterns. Enhance efficiency
You need to choose big data analytics solutions that reduce software-licensing costs, enable you to perform processes more efficiently, take advantage of new data sources effectively, and accelerate the speed at which that information is turned into knowledge.
Improve compliance
Sorting Through the Hype
There’s so much hype about big data that it can be difficult to know what to believe. We maintain that one size doesn’t fit all when it comes to big-data analytical databases. The top-performing organizations are those that have figured out how to optimize each part of their data pipelines and workloads with the right technologies.
The job of vendors in this market: to keep up with standards so that businesses don’t need to rip and replace their data schemas, queries, or frontend tools as their needs evolve.
Chapter 2. Where Do You Start?
Follow the Example of This
Data-Storage Company
So, you’re intrigued by big data. You even think you’ve identified a real business need for a big-data project. How do you articulate and justify the need to fund the initiative?
When selling big data to your company, you need to know your audience. Big data can deliver massive benefits to the business, but you must know your audience’s interests.
For example, you might know that big data gets you the following:
360-degree customer view (improving customer “stickiness”) via cloud services
Rapid iteration (improving product innovation) via engineering informatics
Force multipliers (reducing support costs) via support automation
But if others within the business don’t realize what these benefits mean to them, that’s when you need to begin evangelizing:
Envision the big-picture business value you could be getting from big data
Communicate that vision to the business and then explain what’s required from them to make it succeed
Think in terms of revenues, costs, competitiveness, and stickiness, among other benefits
hear.
Table 2-1. Know your audience
Analysts want: Business
owners want: IT professionalswant: Data scientistswant:
SQL and ODBC New revenue
streams Lower TCO from areduced footprint Sheer speed forlarge queries ACID for consistency Sheer speed for
critical answers MPP shared-nothing architecture
R for in-database analytics
The ability to integrate big-data solutions into current BI and reporting tools
Increased operational efficiency
Lower TCO from a
Aligning Technologists and Business
Stakeholders
Larry Lancaster, a former chief data scientist at a company offering hardware and software solutions for data storage and backup, thinks that getting
business strategists in line with what technologists know is right is a
universal challenge in IT. “Tech people talk in a language that the business people don’t understand,” says Lancaster. “You need someone to bridge the gap. Someone who understands from both sides what’s needed, and what will eventually be delivered,” he says.
The best way to win the hearts and minds of business stakeholders: show them what’s possible. “The answer is to find a problem, and make an example of fixing it,” says Lancaster.
The good news is that today’s business executives are well aware of the power of data. But the bad news is that there’s been a certain amount of disappointment in the marketplace. “We hear stories about companies that threw millions into Hadoop, but got nothing out of it,” laments Lancaster. These disappointments make executives reticent to invest large sums. Lancaster’s advice is to pick one of two strategies: either start small and slowly build success over time, or make an outrageous claim to get people’s attention. Here’s his advice on the gradual tactic:
The first approach is to find one use case, and work it up yourself, in a day or two. Don’t bother with complicated technology; use Excel. When you get results, work to gain visibility. Talk to people above you. Tell them you were able to analyze this data and that Bob in marketing got an extra 5 percent response rate, or that your support team closed cases 10 times faster.
Typically, all it takes is one or two persons to do what Lancaster calls “a little big-data magic” to convince people of the value of the technology.
Achieving the “Outrageous” with Big Data
Lancaster knows about taking the second route. As chief data scientist, he built an analytics environment from the ground up that completely eliminated Level 1 and Level 2 support tickets.Imagine telling a business that it could almost completely make routine support calls disappear. No one would pass up that opportunity. “You absolutely have their attention,” said Lancaster.
This company offered businesses a unique storage value proposition in what it calls predictive flash storage. Rather than forcing businesses to choose between hard drives (cheap but slow) and solid state drives, (SSDs — fast but expensive) for storage, they offered the best of both worlds. By using
predictive analytics, they built systems that were very smart about what data went onto the different types of storage. For example, data that businesses were going to read randomly went onto the SSDs. Data for sequential reads — or perhaps no reads at all — were put on the hard drives.
How did they accomplish all this? By collecting massive amounts of data from all the devices in the field through telemetry, and sending it back to its analytics database, Vertica, for analysis.
Lancaster said it would be very difficult — if not impossible — to size deployments or use the correct algorithms to make predictive storage products work without a tight feedback loop to engineering.
We delivered a successful product only because we collected enough information, which went straight to the engineers, who kept iterating and optimizing the product. No other storage vendor understands workloads better than us. They just don’t have the telemetry out there.
And the data generated by the telemetry was huge. The company were taking in 10,000 to 100,000 data points per minute from each array in the field. And when you have that much data and begin running analytics on it, you realize you could do a lot more, according to Lancaster.
to do bigger queries faster. We had a team of data scientists and didn’t want them twiddling their thumbs. That’s what brought us to Vertica.
Without Vertica helping to analyze the telemetry data, they would have had a traditional support team, opening cases on problems in the field, and
escalating harder issues to engineers, who would then need to simulate processes in the lab.
“We’re talking about a very labor-intensive, slow process,” said Lancaster, who believes that the entire company has a better understanding of the way storage works in the real world than any other storage vendor — simply because it has the data.
As a result of the Vertica deployment, this business opens and closes 80 percent of its support cases automatically. Ninety percent are automatically opened. There’s no need to call customers up and ask them to gather data or send log posts. Cases that would ordinarily take days to resolve get closed in an hour.
They also use Vertica to audit all of the storage that its customers have deployed to understand how much of it is protected. “We know with local snapshots, how much of it is replicated for disaster recovery, how much incremental space is required to increase retention time, and so on,” said Lancaster. This allows them to go to customers with proactive service
Monetizing Big Data
Lancaster believes that any company could find aspects of support,
marketing, or product engineering that could improve by at least two orders of magnitude in terms of efficiency, cost, and performance if it utilized data as much as his organization did.
More than that, businesses should be figuring out ways to monetize the data. For example, Lancaster’s company built a professional services offering that included dedicating an engineer to a customer account, not just for the
storage but also for the host side of the environment, to optimize reliability and performance. This offering was fairly expensive for customers to
purchase. In the end, because of analyses performed in Vertica, the
organization was able to automate nearly all of the service’s function. Yet customers were still willing to pay top dollar for it. Says Lancaster:
Enterprises would all sign up for it, so we were able to add 10 percent to our revenues simply by better leveraging the data we were already
collecting. Anyone could take their data and discover a similar revenue windfall.
Already, in most industries, there are wars as businesses race for a competitive edge based on data.
Why Vertica?
Lancaster said he first “fell in love with Vertica” because of the performance benefits it offered.
When you start thinking about collecting as many different data points as we like to collect, you have to recognize that you’re going to end up with a couple choices on a row store. Either you’re going to have very narrow tables — and a lot of them — or else you’re going to be wasting a lot of I/O overhead retrieving entire rows where you just need a couple of fields. But as he began to use Vertica more and more, he realized that the
performance benefits achievable were another order of magnitude beyond what you would expect with just the column-store efficiency.
It’s because Vertica allows you to do some very efficient types of encoding on your data. So all of the low cardinality columns that would have been wasting space in a row store end up taking almost no space at all.
According to Lancaster, Vertica is the data warehouse the market needed for 20 years, but didn’t have. “Aggressive encoding coming together with late materialization in a column store, I have to say, was a pivotal technological accomplishment that’s changed the database landscape dramatically,” he says.
On smaller Vertica queries, his team of data scientists were only experiencing subsecond latencies. On the large ones, it was getting sub-10-second
latencies.
It’s absolutely amazing. It’s game changing. People can sit at their desktops now, manipulate data, come up with new ideas and iterate without having to run a batch and go home. It’s a dramatic increase in productivity.
Choosing the Right Analytical Database
As you do your research, you’ll find that big data platforms are often suited for special purposes. But you want a general solution with lots of features, such as the following:
Clickstream
Sentiment
R
ODBC
SQL
ACID
Speed
Compression
In-database analytics
And you want it to support lots of use cases: Data science
BI
Tools
Cloud services
Informatics
smaller.
Even before being acquired by what was at that point HP, Vertica was the biggest big data pure-play analytical database. A feature-rich general solution, it had everything that Lancaster’s organization needed:
Scale-out MPP architecture
SQL database with ACID compliance
R-integrated window functions, distributed R
Vertica’s performance-first design makes big data smaller in motion with the following design features:
Column-store
Late materialization
Segmentation for data-local computation, à la MapReduce
Extensive encoding capabilities also make big data smaller on disk. In the case of the time-series data this storage company was producing, the storage footprint was reduced by approximately 25 times versus ingest;
approximately 17 times due to Vertica encoding; and approximately 1.5 times due to its own in-line compression, according to an IDC ROI analysis.
Even when it didn’t use in-line compression, the company still achieved approximately 25 times reduction in storage footprint with Vertica post
Look for the Hot Buttons
So, how do you get your company started on a big-data project?
“Just find a problem your business is having,” advised Lancaster. “Look for a hot button. And instead of hiring a new executive to solve that problem, hire a data scientist.”
Say your product is falling behind in the market — that means your feedback to engineering or product development isn’t fast enough. And if you’re
bleeding too much in support, that’s because you don’t have sufficient information about what’s happening in the field. “Bring in a data scientist,” advises Lancaster. “Solve the problem with data.”
Chapter 3. The Center of
Excellence Model: Advice from
Criteo
You have probably been reading and hearing about Centers of Excellence. But what are they?
A Center of Excellence (CoE) provides a central source of standardized products, expertise, and best practices for a particular functional area. It can also provide a business with visibility into quality and performance
parameters of the delivered product, service, or process. This helps to keep everyone informed and aligned with long-term business objectives.
Could you benefit from a big-data CoE? Criteo has, and it has some advice for those who would like to create one for their business.
According to Justin Coffey, a senior staff development lead at the
performance marketing technology company, whether you formally call it a CoE or not, your big-data analytics initiatives should be led by a team that promotes collaboration with and between users and technologists throughout your organization. This team should also identify and spread best practices around big-data analytics to drive business- or customer-valued results. Vertica uses the term “data democratization” to describe organizations that increase access to data from a variety of internal groups in this way.
That being said, even though the model tends to be variable across
companies, the work of the CoE tends to be quite similar, including (but not limited to) the following:
Defining a common set of best practices and work standards around big data
practices
Providing guidance and support to assist engineers, programmers, end users, and data scientists, and other stakeholders to implement these best practices
Coffey is fond of introducing Criteo as “the largest tech company you’ve never heard of.” The business drives conversions for advertisers across multiple online channels: mobile, banner ads, and email. Criteo pays for the display ads, charges for traffic to its advertisers, and optimizes for
conversions. Based in Paris, it has 2,200 employees in more than 30 offices worldwide, with more than 400 engineers and more than 100 data analysts. Criteo enables ecommerce companies to effectively engage and convert their customers by using large volumes of granular data. It has established one of the biggest European R&D centers dedicated to performance marketing technology in Paris and an international R&D hub in Palo Alto. By choosing Vertica, Criteo gets deep insights across tremendous data loads, enabling it to optimize the performance of its display ads delivered in real-time for each individual consumer across mobile, apps, and desktop.
The breadth and scale of Criteo’s analytics stack is breathtaking. Fifty billion total events are logged per day. Three billion banners are served per day. More than one billion unique users per month visit its advertisers’ websites. Its Hadoop cluster ingests more than 25 TB a day. The system makes 15 million predictions per second out of seven datacenters running more than 15,000 servers, with more than five petabytes under management.
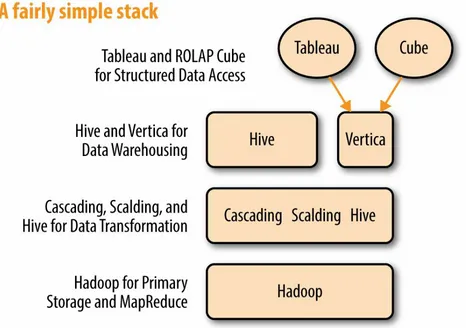
Overall, however, it’s a fairly simple stack, as Figure 3-1 illustrates. Criteo decided to use:
Hadoop to store raw data
Vertica database for data warehousing
Tableau as the frontend data analysis and reporting tool
right setup and optimization of the Tableau server was critical to ensure the best possible performance.
Figure 3-1. The performance marketing technology company’s big-data analytics stack
Criteo started by using Hadoop for internal analytics, but soon found that its users were unhappy with query performance, and that direct reporting on top of Hadoop was unrealistic. “We have petabytes available for querying and add 20 TB to it every day,” says Coffey.
Using a Hadoop framework as calculation engine and Vertica to analyze structured and unstructured data, Criteo generates intelligence and profit from big data. The company has experienced double-digit growth since its
Observed Coffey, “Vertica can do many things, but is best at accelerating ad hoc queries.” He made a decision to load the business-critical subset of the firm’s Hive data warehouse into Vertica, and to not allow data to be built or loaded from anywhere else.
The result: with a modicum of tuning, and nearly no day-to-day maintenance, analytic query throughput skyrocketed. Criteo loads about 2 TB of data per day into Vertica. It arrives mostly in daily batches and takes about an hour to load via Hadoop streaming jobs that use the Vertica command-line tool (vsql) to bulk insert.
Here are the recommended best practices from Criteo: Without question, the most important thing is to simplify
For example: sole-sourcing data for Vertica from Hadoop provides an implicit backup. It also allows for easy replication to multiple clusters. Because you can’t be an expert in everything, focus is key. Plus, it’s easier to train colleagues to contribute to a simple architecture. Optimizations tend to make systems complex
If your system is already distributed (for example, in Hadoop, Vertica), scale out (or perhaps up) until that no longer works. In Coffey’s opinion, it’s okay to waste some CPU cycles. “Hadoop was practically designed for it,” states Coffey. “Vertica lets us do things we were otherwise incapable of doing and with very little DBA overhead — we actually don’t have a Vertica database administrator — and our users
consistently tell us it’s their favorite tool we provide.”
Keeping the Business on the Right Big-Data
Path
Although Criteo doesn’t formally call it a “Center of Excellence,” it does have a central team dedicated to making sure that all activities around big-data analytics follow best practices. Says Coffey:
It fits the definition of a Center of Excellence because we have a mix of professionals who understand how databases work at the innermost level, and also how people are using the data in their business roles within the company.
The goal of the team: to respond quickly to business needs within the technical constraints of the architecture, and to act deliberately and
accordingly to create a tighter feedback loop on how the analytics stack is performing.
“We’re always looking for any acts we can take to scale the database to reach more users and help them improve their queries,” adds Coffey. “We also troubleshoot other aspects of the big data deployment.”
“For example, we have a current issue with a critical report,” he said, adding that his team is not responsible for report creation, but “we’re the people responsible for the data and the systems upon which the reports are run.” If the reports are poorly performing, or if the report creators are selling expectations that are not realistic, that is when his team gets involved. “Our team has a bird’s-eye view of all of this, so we look at the end-to-end complexity — which obviously includes Vertica and our reporting server — to optimize them and make it more reliable, to ensue that executives’
expectations are met,” states Coffey, who adds that sometimes less-than-intelligent requests are made of analysts by internal business “clients.”
In essence, the team does two things that any CoE would do: it gets involved in critical cases, and it proactively trains users to be better users of the
resources at hand.
The Risks of Not Having a CoE
“You risk falling into old patterns,” says Coffey. “Rather than taking
ownership of problems, your team can get impatient with analysts and users.” This is when database administrators (DBAs) get reputations for being
cranky curmudgeons.
Some companies attempt to control their big data initiatives in a distributed manner. “But if you don’t have a central team, you run into the same issues over and over again, with repetitive results and costs — both operational and technical,” says Coffey.
The Best Candidates for a Big Data CoE
The last thing you want is an old-school DBA who simply complains about the analysts and users, and would “get into fights that would last until they escalated to the director’s level,” says Coffey. “A CoE serves to avoid those situations.”
So, who do you want on your CoE team? Coffey says you want people with the right mix of technical and people skills. “What we look for are engineers interested in seeing things work in action, and making users happy,” he says. It’s an operational client-facing role; thus you look for people who enjoy providing value by quickly analyzing why something is or isn’t working. “If you find someone like that, hire them immediately,” says Coffey.
A slightly different kind of CoE candidate would be an analyst who shows a little more technical acumen along with people skills.
Chapter 4. Is Hadoop a Panacea
for All Things Big Data? YP
SMSays No
You can’t talk about big data without hearing about Hadoop. But it’s not necessarily for everyone. Businesses need to ensure that it fits their needs — or can be supplemented with other technologies — before committing to it. Just in case you’ve missed the hype — and there’s been a lot of it — Hadoop is a free, Java-based programming framework that supports the processing of large datasets in a distributed computing environment. It is part of the Apache project sponsored by the Apache Software Foundation. For many people, Hadoop is synonymous with big data. But it’s not for every big-data project. For example, Hadoop is an extremely cost-effective way to store and process large volumes of structured or unstructured data. It’s also designed to
optimize batch jobs. But fast it is not. Some industry observers have
compared it to sending a letter and waiting for a response by using the United States Postal Service — more affectionately known as “snail mail” — as opposed to texting someone in real time. When time isn’t a constraint,
Hadoop can be a boon. But for more urgent tasks, it’s not a big-data panacea. It’s definitely not a replacement for your legacy data warehouse, despite the tempting low cost. That’s because most relational databases are optimized to ingest and process data that comes in over time — say, transactions from an order-entry system. But Hadoop was specifically engineered to process huge amounts of data that it ingests in batch mode.
However, Hadoop is excellent to use as an extract, transform, and load (ETL) platform. Using it as a staging area and data integration vehicle, then feeding selected data into an analytical database like Vertica makes perfect sense. Businesses need to ignore the hype, look at their needs, and figure out for themselves if and where Hadoop fits into their big data initiatives. It’s an important and powerful technology that can make a difference between big data success and failure. But keep in mind that it’s still a work in progress, according to Bill Theisinger, vice president of engineering for platform data services at YPSM, formerly known as YellowPages.com.
YP focuses on helping small and medium-sized businesses (SMBs)
understand their customers better so that they can optimize marketing and ad campaigns. To achieve this, YP has developed a massive enterprise data lake using Hadoop with near-real-time reporting capabilities that pulls oceans of data and information from across new and legacy sources. Using powerful reporting and precise metrics from its data warehouse, YP helps its nearly half a million paying SMB advertisers deliver the best ad campaigns and continue to optimize their marketing.1
YP’s solutions can reach nearly 95% of U.S. Internet users, based on the use of YP distribution channels and the YP Local Ad Network (according to comScore Media Metrix Audience Duplication Report, November 2015). Hadoop is necessary to do this because of the sheer volume of data,
YP Transforms Itself Through Big Data
YP saw the writing on the wall years ago. Its traditional print business was in decline, so it began moving local business information online and
transforming itself into a digital marketing business. YP began investigating what the system requirements would be to provide value to advertisers. The company realized it needed to understand where consumers were looking online, what ads they were viewing when they searched, what they clicked on, and even which businesses they ended up calling or visiting — whether online or in person.
Not having the infrastructure in place to do all this, YP had to reinvent its IT environment. It needed to capture billions of clicks and impressions and searches every day. The environment also had to be scalable. “If we added a new partner, if we expanded the YP network, if we added hundreds,
thousands, or tens of thousands of new advertisers and consumers, we needed the infrastructure to be able to help us do that,” said Theisinger.
When Theisinger joined YP, Hadoop was at the very height of its hype cycle. But although it had been proven to help businesses that had large amounts of unstructured data, that wasn’t necessarily helpful to YP. The firm needed that data to be structured at some point in the data pipeline so that it could be reported on — both to advertisers, partners, and internally.
YP did what a lot of companies do: it combined Hadoop with an analytical database — it had chosen Vertica — so that it could move large volumes of unstructured data in Hadoop into structured environment and run queries and reports rapidly.
Today, YP runs approximately 10,000 jobs daily, both to process data and also for analytics. “That data represents about five to six petabytes of data that we’ve been able to capture about consumers, their behaviors, and
activities,” says Theisinger. That data is first ingested into Hadoop. It is then passed along to Vertica, and structured in a way that analysts, product
YP also uses the Hadoop-Vertica combination to optimize internal
operations. “We’ve been able to provide various teams internally — sales, marketing, and finance, for example — with insights into who’s clicking on various business listings, what types of users are viewing various businesses, who’s calling businesses, what their segmentation is, and what their
demographics look like,” said Theisinger. “This gives us a lot of insight.” Most of that work is done with Vertica.
YP’s customers want to see data in as near to real time as possible. “Small businesses rely on contact from customers. When a potential customer calls a small business and that small business isn’t able to actually get to the call or respond to that customer — perhaps they’re busy with another customer — it’s important for them to know that that call happened and to reach back out to the consumer,” says Theisinger. “To be able to do that as quickly as
possible is a hard-and-fast requirement.”
Which brings us back to the original question asked at the beginning of the chapter: Is Hadoop a panacea for big data? Theisinger says no.
“Hadoop is definitely central to our data processing environment. At one point, Hadoop was sufficient in terms of speed, but not today,” said Theisinger. “It’s becoming antiquated. And we haven’t seen tremendous advancements in the core technologies for analyzing data outside of the new tools that can extend its capabilities — for example, Spark — which are making alternative architectures like Spark leveraging Kafka real
alternatives.”
Additionally, YP has a lot more users who were familiar with SQL as the standard retrieval language and didn’t have the backgrounds to write their own scripts or interact with technologies like Hive or Spark.
And it was absolutely necessary to pair Hadoop with the Vertica MPP analytics database, Theisinger says.
Another reason for the Vertica solution: YP had to analyze an extremely high volume of transactions over a short period of time. The data was not batch-oriented, and to attempt to analyze it in Hive would have taken 10, 20, 30 minutes — or perhaps even hours — to accomplish.
“We can do it in a much shorter time in Vertica,” says Theisinger, who said that Vertica is “magnitudes faster.”
Hadoop solves many problems, but for analytics it is primarily an ETL tool suited to batch modes, agrees Justin Coffey, a senior staff development lead at Criteo, a performance marketing technology company based in Paris, which also uses Hadoop and Vertica.
“Hadoop is a complicated technology,” he says. “It requires expertise. If you have that expertise, it makes your life a lot easier for dealing with the
velocity, variety, and volume of data.”
However, Hadoop is not a panacea for big data. “Hadoop is structured for schema on read. To get the intelligence out of Hadoop, you need an MPP database like Vertica,” points out Coffey.
Larry Lancaster, whose take on kicking off a big-data project we explored in
Chapter 2, takes this attitude even further. “I can’t think of any problems where you would prefer to use Hadoop versus Vertica aside from raw file storage,” he says. “With Vertica, you get answers much faster, you take up much less space on your hardware, and it’s incredibly cost effective. And for performance, you’re talking four to five orders of magnitude improvement.”
YP follows industry-standard privacy practices in its use of targeted advertising by taking responsible measures to secure any information collected through its sites about YP consumers, while still providing them with products, services and communications relevant to their interests. YP’s privacy policy and practices are TRUSTe certified, and YP consumers are able to opt out of mobile location data collection at the device level and manage the use of their information by opting out of retargeted advertising.
Chapter 5. Cerner Scales for
Success
When done right, big-data initiatives only grow bigger. It’s almost inevitable that one big-data success in your business will lead to more and more use cases being identified. In short: you need to be prepared to scale.
Cerner Corporation learned this with its Millennium® platform. Based in
Kansas City, Cerner’s health information technology (HIT) solutions connect people and systems at more than 20,000 facilities worldwide. Working
together with its clients, Cerner is creating a future in which the healthcare system works to improve the wellbeing of both individuals and communities. Cerner Millennium is the company’s electronic medical records (EMR)
platform. It integrates nearly 60 solutions into a suite focused on electronic health record and clinical workflows. In most cases, Cerner provides Cerner Millennium to its customers as a hosted solution, running a considerable portion of the platform on Vertica servers and storage.
To ensure Cerner Millennium delivers the rapid response and high performance its users have come to expect, Cerner has built some 2,000 response-time measurement system (RTMS) timers into the Cerner
Millennium platform. These RTMS timers detect how long certain functions take. For example, how long does it take for a doctor to access or add patient information while in Cerner Millennium? Enter an order for medication? All these things are carefully tracked.
With permission from its clients, Cerner collects billions of RTMS records every month, analyzes them, and uses that information to measure
performance in Cerner Millennium to ensure the optimal ability of clinicians to provide quality care to patients. The timers are also used to optimize workflows and prioritize development investments.
Millennium, the company knew it would need to expand its legacy data warehouse to keep up with demand. But this option was simply not feasible. “We weren’t satisfied with the speed of its data analysis capabilities that enable us to proactively optimize Cerner Millennium timer data at an optimal rate. There was just too much data to successfully process it as it was
generated,” says Dan Woicke, director of enterprise system management at Cerner. “We had to find another way.”
One problem was that the RTMS data was simply not granular enough: the limitations of the legacy cluster meant Cerner could only sample and
summarize the data.
For example, if a physician opens PowerChart® — a component of Cerner
Millennium — Cerner records how long that took. But in the legacy
A Mammoth Proof of Concept
In 2012, Cerner performed a proof of concept (PoC) to find an analytics database that could scale to meet its growing needs.
It invited six MPP database vendors — IBM Netezza, Greenplum, Teradata, Oracle Exadata, SAP IQ, and Vertica — to run their databases through two use cases: one for an insert on a database called Health Facts™, and one involving an RTMS real-time insert of Cerner Millennium data.
After going through a very lengthy checklist of requirements during the PoC, Vertica scored the highest of all six of the databases.
At the top of the checklist was the ability to scale cost effectively as well as the ability to get a large number of concurrent users onto the system. “There were a lot of parameters that measured scalability within our checklist,” states Woicke.
According to Adam Agnew, software architect at Cerner, one of the reasons that the team was interested particularly in Vertica was that when doing scale tests during the PoC, the data would frequently be cached after the first call, so the data would become skewed the more they ran through the data. “A lot of the databases do this caching, so you’d see these big performance penalties on the first queries. But we needed to run dynamic queries, and get results really fast,” Agnew says.
So one of the things Cerner looked for across the six databases was how long the first call took, and on running random queries across the cluster to get around any caching that the vendors might or might not have turned on. Vertica passed all the tests.
Even though Cerner chose Vertica for its scalability, and even though it had estimated quite a lot of data volume growth four years ago at the time of the PoC, the growth has accelerated beyond expectations. As Woike states:
Cerner started out with a Vertica cluster on blade servers, with shared
storage. Today it has 20 dedicated DL380 servers, and has just purchased five more. Plan B for later in the year is to rack another 25 servers in a separate datacenter, for syncing and to have better disaster recovery capabilities. Now that Cerner has moved to the Vertica platform, it enters discrete records into the database. If PowerChart is launched 57 times, the statistics for all 57 times are put in the database. “We can see exactly which clinician did which task at which time — and you can see this is a much better strategy for
troubleshooting any problems,” says Woicke.
You can imagine that when a physician calls his or her help desk and says, ‘I’m Dr. X, and I’m having performance problems,’ the last thing we want to do is trouble that physician to repeat the process of opening PowerChart so we could try and troubleshoot the problem. We’d look at the timers for the hour in question, but because we didn’t have discrete records, nothing stood out.
Providing Better Patient Outcomes
One of the Vertica clusters runs a solution called HealtheIntent™, which gives patients the tools to better manage their own health. That cluster holds personal health information (PHI) and clinical data.
Woicke is in charge of the other, operational, Vertica cluster, which measures the different aspects of Cerner Millennium and Cerner Millennium
subcomponents. By performing analytics on that data, Cerner has an eagle’s-eye view into how its customers’ systems are performing.
Also running on the Vertica operational cluster in the operation is something called Health Facts®, which performs predictive analytics on patient
outcomes. It’s in the operational cluster because the data has been filtered so that it doesn’t have any patient information or PHI affiliated with it. But its predictive nature allows doctors to take advantage of the algorithms built into Cerner Millennium by Health Facts research in order to improve the quality of care of their patients.
One Health Facts success story has been the Cerner Millennium St. John Sepsis algorithm. Sepsis is a blood disease that doctors have only six to eight hours to treat before it turns fatal. By feeding approximately 30 different patient measurements into Health Facts, doctors get a coefficient that tells them if they need to begin immediate treatment for Sepsis. “Lives have been saved through that algorithm alone,” states Woicke. The creation of the
Tetralogy of Fallot Index — a tool to quantitatively determine survival while congenital heart disorder patients await surgery — assists the care team to make clinically appropriate, fair, and equitable decisions for scheduling patients for surgery. The system can also predict the likelihood of a child having a severe asthma attack and ending up in the emergency room within the next six months.
During the PoC, to test for scalability, Cerner attempted to simulate what would happen in a typical day of running Cerner Millennium for all
Facts inserts and running queries off the data,” says Woicke. Vertica wrote a script so that Cerner could simulate 200 to 500 concurrent users — the goal was to find the breaking point — querying RTMS data and Health Facts data simultaneously. As Woike points out:
One of the reasons we went with Vertica was the number of concurrent users we could have. Price, concurrency, and speed were the top
considerations, and Vertica did the best on those three.
Vertica: Helping to Keep the LightsOn
Then there’s how Vertica has helped with Cerner’s LightsOn Network®,
which Cerner began approximately a decade ago. The idea behind the web-based LightsOn Network is to allow clients to see the history of the
performance of Cerner Millennium at their sites. They can see what their usage patterns have been — how physicians and nurses and clinicians are actually using the system — and how doctors compare to other doctors in their skill at using the system.
“The idea is to teach people how to use Cerner Millennium better,” states Woicke. By querying Vertica, Cerner customers can see that it takes one doctor 14 clicks to write a standing order, whereas it should take only five. “So we can show the doctor the LightsOn Network and say, ‘see how you’re always going to so much trouble when prescribing this? Here’s a way to streamline the process so you only have to click a couple of times and the order is in.’”
Although the LightsOn Network has been doing this for years, it has only what has happened historically. But by getting a Tableau cluster up on
Vertica, Cerner Millennium will be able to show clients what they were doing minutes rather than days ago.
The LightsOn Network is a service offered to help clients manage their Cerner solutions, based on a decision Cerner made years ago to be very transparent about how well its systems were running at customer sites. “So we haven’t profited from the LightsOn Network directly, but as a key differentiator, it has helped us in the marketplace,” says Woicke.
Cerner Millennium also has a Vertica-based workflow analyzer that shows what use cases the customers’ clinicians are using and how many key clicks they’re using for their transactions. In the end, Vertica is helping Cerner increase the efficiency of the medical facility so that clinicians can focus on providing the best healthcare to patients.
into the cluster. The data is going to be stored locally, so if Cerner needs more processing power or more disk space to store information, it simply expands the cluster. Vertica behind the scenes will restripe that data accordingly, making sure that new nodes that come into in the cluster get their fair share of local storage. “So not only are we getting a scalability factor off the storage, but we’re also adding the CPU power that can address queries and insert quicker by having additional cycles to work with,” says Woicke. Agnew adds that:
This is why the industry is moving toward a distributed computing
platform. If you take that data, and stripe it across a series of servers, issue a query to an individual server, then a little bit of work can happen on every server across the cluster. You get enhanced performance with every node you add to the cluster, because you’re getting more processing, more memory, more CPU, and more disk.
The advantages Cerner has realized by moving to Vertica:
6,000 percent faster analysis of timers helps Cerner gain insight into how physicians and others use Cerner Millennium and make suggestions about using it more efficiently so that users become more efficient
clinicians
Rapid analysis of two million alerts daily enables Cerner to know what will happen, then head off problems before they occur
“Some Health Facts users would issue a query at 5 p.m. as they left for the day, hoping they would have a result when they returned at 8 a.m. the next morning. With Vertica, those query times are down to two or three minutes,” says Woicke. Here are yet other benefits:
Moving from reactive to proactive IT management
Enhancing clinician workflow efficiency
Improving patient safety and quality of care
Crunching the Numbers
Cerner has come a very long way. Before performing its PoC, the largest Cerner Millennium client added five million transactions per day into the summarized platform. “Now, some of our largest customers are pumping 30 million transactions a day into Vertica,” says Agnew. “We’re onboarding more clients, and our clients are growing individually, so it all adds up.” Not only is Cerner getting requests for new datasets from customers, but those customers are finding the data so useful that they’re asking for more frequent datasets — once a minute, for example, instead of every five minutes.
According to Woicke, these datasets are almost like breadcrumbs. Cerner can see what users are doing first, second, and third, and see what pathways they are taking through the system. Cerner can then make design decisions to help users get to functions faster.
In the LightsOn Network, for which data is collected on individual clinicians performing individual tasks, there’s also the opportunity to rank the
efficiency and effectiveness of individual Cerner Millennium customers. As Woike describes it:
From RTMS data, to key click data, to orders data, to charting data, not only can we compare physician to physician, but we can compare customer to customer. For example, we can compare one 500-bed hospital running on HPE hardware to another 500-bed hospital running on HPE hardware, and do a line-by-line comparison based on the number of hospitals in that group.
Vertica is also being used to monitor all the operations in the Cerner datacenter to measure uptime. Woike continues:
numbers and even to see the negative. We might ask, hey — why are we not receiving datasets from a particular client? So we use it for QA as well. But we’re looking at quality measures in real time.
In effect, there will be two paths for data. Cerner will continue to batch data in Vertica for visualization and analytical purposes, and then there will be a path to evaluate the data in cache memory. “That will let us measure uptimes up to the minute,” says Woicke, adding, “Now that we are able to analyze each and every discrete data record, we can concentrate on the outliers to improve the experience of each and every clinician on the system.”
Analyses at this level leads to greater efficiencies, which results in better health outcomes, says Woicke.
Table 5-1 shows how Cerner upgraded its Vertica cluster.
Table 5-1. Upgrading the cluster
Old blade cluster Current blade cluster
Servers 30 BL460c blade servers (150 TB cluster) 20 DL380p servers (250 TB cluster)
Logical cores 24 40
Memory 96 GB 256 GB
Storage 5 TB 12 TB
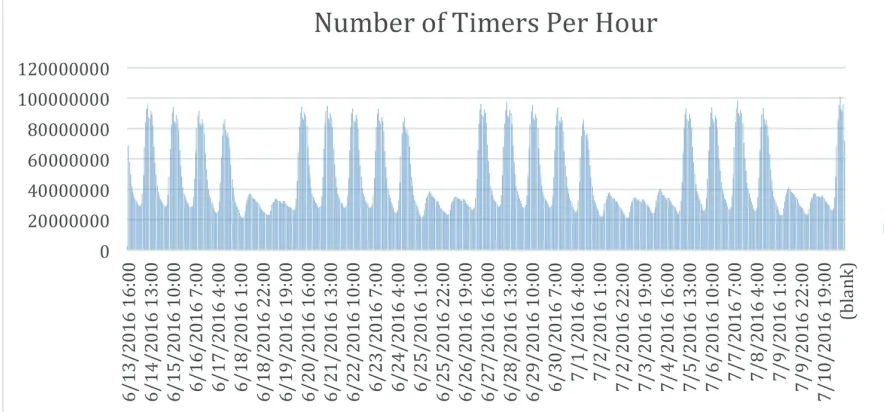
Figure 5-1. Nearly 30 billion RTMS timer metrics per day
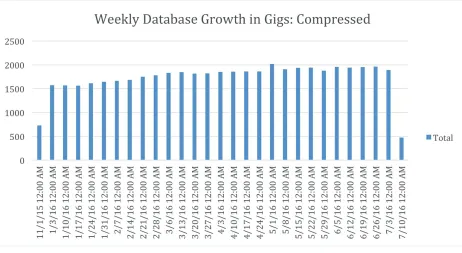
Cerner is growing the cluster by about 2 TB of compressed data (it was divided by two because of “buddy projections,” so there is really 4 TB on disk) in primary fact tables per week. This doesn’t include workflow, but Cerner does have tables in that schema with more than a trillion records in them. You can see how the work schedules coordinate with the workweek. Workdays had substantially higher transactions than weekends, as shown in
Figure 5-2.
Figure 5-2. Size of compressed partitions
Figure 5-3. Pumping five billion records through the system
Cerner uses a three-tier architecture, and with Vertica it can look at performance across the stack. As Agnew points out:
Originally, you could only look at the performance of the database, or the mid-tier, or maybe Citrix, but now we can join that data together to see some really neat things about how one tier of our environment affects other tiers. We can correlate that to RTMS timers and see there was a problem in a mid tier that put a lock on the database, but we can get closer to root cause than we could before.
the use cases for big-data analytics. “You’d think you’d reach a point where you have collected everything you wanted to collect,” says Woicke. “But that’s not necessarily true. We have people coming to us all the time with big-data projects for our Vertica clusters.”
Chapter 6. Whatever You Do,
Don’t Do This, Warns Etsy
Don’t Forget to Consider Your End User When
Designing Your Analytics System
“That is the most important thing that will drive the tools you choose,” said Chris Bohn, “CB,” a senior database engineer with Etsy, a marketplace where millions of people around the world connect, both online and offline, to
make, sell, and buy unique goods. Etsy was founded in 2005 and is headquartered in Brooklyn, New York.
Etsy uses Vertica to analyze a 130 TB database to discover new revenue opportunities. To improve performance by an order of magnitude, Etsy replaced its PostgreSQL system with Vertica to efficiently and quickly analyze more than 130 TB of data. Bohn says that the greatest benefits are accessibility and speed, such that use of the tool has spread to all
departments. “Queries that previously took many days to run now run in minutes,” says Bohn. This has increased companywide productivity.
But Etsy considered the end users of the analytics database before choosing Vertica — and those end users, it turned out, were mainly analysts.
Analysts and data scientists are very different people, says Bohn. Data scientists are going to be comfortable working with Hadoop, MapReduce, Scalding, and even Spark, whereas data analysts live in an SQL world. “If you put tools in place that they don’t have experience with, they won’t use them. It’s that simple,” states Bohn.
Bohn points to companies that built multimillion-dollar analytics systems using Hadoop, and the analysts refused to use them because it took so long to get an answer out of the system. Says Bohn:
Even if they use Hive — which is basically SQL on Hadoop — they have to keep in mind that every Hive query gets translated behind the scenes into a MapReduce job — creating a very slow response time. And because analysts use SQL in an iterative way — starting with one query and
Don’t Underestimate Demand for Big-Data
Analytics
After Etsy replaced its PostgreSQL business intelligence solution with
Vertica, it was astounded by the volume of demand for access to it. “Vertica gets results so quickly, everyone was piling on to use it,” said Bohn.
At first, Etsy had just its analyst team using Vertica, but then engineers asked to create dashboards, and the security team wanted to do some fingerprinting. “After that, it seemed like everyone was jumping on the Vertica bandwagon,” says Bohn. He’d thought he’d have maybe a dozen Vertica users. He now has more than 200.
“You have to consider that your big data analytics, if done right, is really going to take off,” stresses Bohn, who added that Etsy was continually renewing its Vertica license to buy more capacity. “We started with five nodes and 10 terabytes, moved to 30 terabytes and 20 nodes, and kept going. Now we’re pushing up against 130 terabytes and — again — need to add capacity.”
Don’t Be Naïve About How Fast Big-Data
Grows
It’s easy to underestimate the amount of data you will accumulate as well as the number of concurrent users. “We are collecting much more data than we thought,” Bohn pointd out. “We have all our clickstream data from people interacting with the website, and we’re partitioning it by day to handle the ever-growing volumes.”
And it’s not just more of the same data, but new types of data that
accumulates. When Etsy started out with its PostgreSQL database a decade ago, it hit the limits of one machine within a year. So, Etsy decided to do vertical sharding: for example, it took its forums, and gave them their own dedicated databases to relieve the pressure on the main system. That helped for another year. Then Etsy realized it also had to shard horizontally to handle all the traffic. To perform analytics, it had to get data from all those shards to a place where it could all live together and so that users could query across all of them. All that turned out to be very inefficient.
“In Vertica we marry our production data with our clickstream data for a complete picture of what’s going on,” says Bohn. The clickstream data gives Etsy information about what users are doing on the site, but Etsy also needed to extract the metadata about those users that told analysts where the users lived, how successful they were at selling, whether they purchase a lot themselves — and all that metadata had to be factored into the clickstream data.
Don’t Discard Data
Another mistake that some businesses make is not saving all of their data. “You never know what might come in handy,” declares Bohn. “Still, too many organizations throw data out because they don’t think they’ll get anything out of it.”
But — especially with Hadoop data lakes — it’s quite inexpensive to store data. “As long as you have a secure way to lock it down, keep it,” says Bohn. You may later find there’s gold in it.”
Etsy, for example, used traditional database methodologies of discarding data when a record was updated in its production system. “We had that problem — our production data was ‘loss-y,’” notes Bohn. For example, a user would list a product, but then later change the description of that product. When they did that, the production database updated the record and discarded the previous description.
Don’t Get Burdened with Too Much “Technical
Debt”
In a fast-moving technology arena like big-data analytics, it’s easy to become saddled with a product or solution that turns out to be a dead end, technically speaking. “I don’t think our analytics stack is going to be the same in five years,” asserts Bohn. “Keeping that in mind, we don’t want to get locked into something that doesn’t allow us to move when we decide the time is right.” Etsy had a lot of technical debt with its PostgreSQL BI machine, when it turned out not to be scalable. “We had to pay a price, in real dollars, to move to Vertica,” Bohn affirms.
Don’t Forget to Consider How You’re Going to
Get Data into Your New Database
One of Etsy’s biggest challenges was getting the data into Vertica. His team ended up building a lot of tools to accomplish this. “Without a way to get data into a database, that database — even one as good as Vertica — is like owning a Ferrari with an empty gas tank,” emphasizes Bohn. His team is especially proud of a tool they created, dubbed Schlep, a Yiddish word meaning, “To carry a heavy load a long distance.” Schlep was built into Vertica as an SQL function, so it was easy for the analysts to use to get the data into Vertica quickly and easily.
According to Bohn, the lesson is this: your data is your star, and this drives your purchasing decisions. He adds:
Do you use the cloud or bare iron in a colocation facility? This will matter, because to get data into the cloud you have to send it over the internet — which will be not as fast as if your big data analytical system is located right next to your production system.
The fact that Vertica is flexible enough to run in the cloud, in Hadoop, and on bare metal was another compelling reason for his purchase.
Etsy in fact uses Vertica as a frontend to its Hadoop system — a different approach than most companies. So it wrote Schlep and other tools to get production data into Vertica. Then, it had to figure out how to get the
production data from Vertica into Hadoop. It simply uses the Vertica HDFS connector to snapshot data from Vertica and transfer it over to Hadoop. “We’re still working on the architecture, and checking out technologies that are coming along,” says Bohn. He continues:
We believe Kafka, for example, will be around for a while. We’ve been really hammering it and it’s very reliable. Kafka may be one of those technologies that become core to our architecture. But deciding that is again related to remaining flexible to avoid technical debt.
Don’t Build the Great Wall of China Between
Your Data Engineering Department and the
Rest of the Company
“You can’t put the data engineering people in a far wing of the building and isolate them from everyone else,” stresses Bohn. “You need a lot of
cooperation and collaboration between them and the rest of the organization.” Bohn knows of one major company that wanted to use big-data analytics to evaluate the effectiveness of its products. But the users couldn’t get the data they wanted out of the system, so they had to go to the data scientists and ask them to run queries — which the data scientists didn’t consider to be a “real” aspect of their jobs. As Bohn recounts:
This company had a big challenge to make getting to the data more a self-service process, simply because the engineers and data engineers didn’t talk to each other.
This type of scenario cries out for a chief data officer, to ensure that the data gets distributed democratically, and that it goes where it is needed — so people who need it can get it without a hassle.
Don’t Go Big Before You’ve Tried It Small
Too many companies begin their big-data journeys with big budgets and excited CEOs, and attempt to tackle everything at once. Then, a year or 18 months down the road, they have nothing to show for it. It’s much better to go after a smaller, very specific goal and succeed, and then slowly build from there. You might have a hypothesis, and do an exercise to analyze the data to see if the hypothesis holds water. Even if the data doesn’t lead to what you expected, the exercise can be considered successful. Do more and moreDon’t Think Big Data Is Simply a Technical
Shift
About the Author
Alice LaPlante is an award-winning writer who has written about technology and the business of technology for more than 20 years. The former news editor of InfoWorld and contributing editor to ComputerWorld and
1. Introduction
Big Data: A Brief Primer
A Crowded Marketplace for Big Data Analytical Databases Yes, You Need Another Database: Finding the Right Tool for the Job
Sorting Through the Hype
2. Where Do You Start? Follow the Example of This Data-Storage Company
Aligning Technologists and Business Stakeholders Achieving the “Outrageous” with Big Data
Monetizing Big Data Why Vertica?
Choosing the Right Analytical Database Look for the Hot Buttons
3. The Center of Excellence Model: Advice from Criteo Keeping the Business on the Right Big-Data Path The Risks of Not Having a CoE
The Best Candidates for a Big Data CoE
4. Is Hadoop a Panacea for All Things Big Data? YPSM Says No YP Transforms Itself Through Big Data
5. Cerner Scales for Success
Providing Better Patient Outcomes Vertica: Helping to Keep the LightsOn Crunching the Numbers
6. Whatever You Do, Don’t Do This, Warns Etsy
Don’t Forget to Consider Your End User When Designing Your Analytics System
Don’t Underestimate Demand for Big-Data Analytics Don’t Be Naïve About How Fast Big-Data Grows Don’t Discard Data
Don’t Get Burdened with Too Much “Technical Debt”
Don’t Forget to Consider How You’re Going to Get Data into Your New Database
Don’t Build the Great Wall of China Between Your Data Engineering Department and the Rest of the Company Don’t Go Big Before You’ve Tried It Small