102
Agroland: The Agriculture Science Journal, 2016 December 3(2) : 102 – 106 ISSN : 2407 – 7585 E–ISSN : 2407 – 7593
COMPARATIVE ANALYSIS OF FARMING VARIETY OF PEANUT
NOLION 1 AND NOLION 2 IN THE DISTRICT OF SOUTH
TOTIKUM BANGGAI KEPULAUAN
Radia N. Bonenehu1) ,Made Antara2) , Rustam Abd Rauf2)
1) Departement of Agriculture and Horticulture Banggai Islands District Central Sulawesi Province,
e-mail : [email protected]
2) Lecturer and Researcher at Department of Agribusiness Faculty of Agriculture.University of Tadulako, Palu.
ABSTRACT
This study aims to: (1) Knowing large farm income peanut varieties Nolion 1 and Nolion 2 in District Totikum South Banggai Islands, and (2) Determine the ratio of production and farm income peanut varieties Nolion 1 and Nolion 2 in District Totikum South Banggai Islands, research type used in this research is descriptive analysis with comparative research method is ex post facto. Sampling is done by simple random sampling method (simple random sampling) take 15% of the population with sampling technique Proportional Stratified Random Sampling. Analysis of data using revenue analysis and comparative analysis / comparison of the average production and average farm income of farmers responder peanut varieties Nolion Nolion 1 and 2. The results show the average farmer's income respondents peanut farmers varieties Nolion 1 in one process location production research Rp 10,073,697- /ha and Rp.10,637,612,-/ha for varieties Nolion 2. The results of comparative analysis (Compare Independent samplest-test) is obtained, there are differences in average production and income of farmers varieties with varieties Nolion 1 and Nolion 2, on the
level of α 5%. Conclusion of the study that there is a difference in the average production and average farm income farm Nolion 1 peanut varieties and varieties of peanut farming Nolion 2. Key Words : Income, nolion variety 1 and nolion variety 2, production.
INTRODUCTION
Development of the agricultural sector very important in the national food sufficiency. The success of the development of this sector, especially food crops is expected to ensure food security rooted in the diversity of food resources, institutional, and local culture. According Adiratma (2004), the agricultural sector plays a very important in the economy of Indonesia. One of the agricultural commodities that can help increase the income and welfare of farmers is peanuts (Arachis hypogaea, L). Peanut is a commodity beans are grown in Indonesia.
The need and demand for peanuts from the processed food industry sector spur increased the income of farmers in different regions. Processed foods with raw
materials peanut experiencing increasing demand. Peanut production in the country over the last three decades showed positive growth. However, the production can not meet the demand increases, so the amount of imports also rose sharply peanuts. Demand for processed peanuts remain high every year (SitiNurShaliha, 2015).
Banggai Islands is one of the peanut production areas in Central Sulawesi province ranks first, which in 2015 recorded peanut production 1177.23 tons of harvested area of 776 ha is still far from production peanut provincial level reached 4942.76 tons 2,928 ha of harvested area, with the achievements of the productivity of 1,517 tons / ha lower than the productivity of peanut provincial level amounted to 1.688 ton/ha.
103 released varieties are varieties Nolion 1 by
the Minister of Agriculture of the Republic of Indonesia Number: 1178 / kpts / SR.12 / 11/2014 and Varieties Nolion 2 Decree of the Minister of Agriculture of the Republic of Indonesia Number: 1177 / kpts / SR.12 / District of South Totikum Banggai Islands. Location District of South Totikum determined intentionally (purposive), with the consideration that this district is peanut farmers planting peanut varieties Nolion1 and varieties Nolion 2.
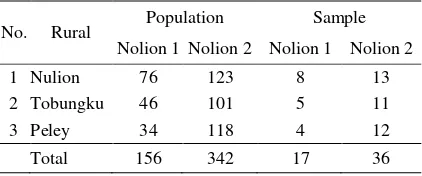
Results of preliminary observations at the study site obtained the total population peanut farmers varieties Nolion 1 and varieties Nolion 2 are located in District South Totikum sample of three villages, namely the village of 199 households Nulion, Tobungku village of 147 households, the village of 152 households Peley. The total population of 498 people.The state of relatively homogeneous population based on the vast land.
Sampling method was randomly simple (Simple Random Sampling) with sampling technique Proportional Stratified Random Sampling (Sugiyono, 2007).
n = number of samples (respondents) N = number of population samples obtained are as follows :
1. Number of respondents farmer farming peanut varieties Nolion 1 in the District I South Totikum = 16.60, rounded up to 17 people.
104
Comparative Analysis. hypothesis testing is done by using t-test two independent samples Separated variance (variance separated) (Sugiyono, 2007) defined as follows:
Where: t = the critical region. Description:
= Average production and farm income peanut varieties Nolion 1
= Average production and farm income peanut varieties Nolion 2
= Standard deviation of the sample combined
= Number of samples VareitasNolion 1 = Number of samples VareitasNolion 2 = Standard deviation of Respondents farming peanut varieties Nolion 1 and Nolion 2 means that there is no difference between the production and income of farmers peanut varieties Nolion 1 with Nolion 2 at 95% confidence level
● If t arithmetic˃ t-table, H1 accepted it means that there are differences in the production and income of farmers peanut varieties Nolion1 and varietiesNolion 2 at the 95% confidence level.
RESULTS AND DISCUSSION
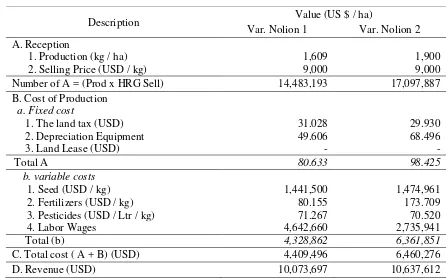
105 Table 2. Average Revenue, Costs, Production, Revenue and RC ratio Farmers Respondents Varieties Nolion 1 and varieties Nolion 2 Village Nulion, Tobungku and Peley per hectare, 2016
Description Value (US $ / ha)
Var. Nolion 1 Var. Nolion 2
A. Reception
1. Production (kg / ha) 1,609 1,900
2. Selling Price (USD / kg) 9,000 9,000
Number of A = (Prod x HRG Sell) 14,483,193 17,097,887
B. Cost of Production
a. Fixed cost
1. The land tax (USD) 31.028 29.930
2. Depreciation Equipment 49.606 68.496
3. Land Lease (USD) - -
Total A 80.633 98.425
b. variable costs
1. Seed (USD / kg) 1,441,500 1,474,961
2. Fertilizers (USD / kg) 80.155 173.709
3. Pesticides (USD / Ltr / kg) 71.267 70.520
4. Labor Wages 4,642,660 2,735,941
Total (b) 4,328,862 6,361,851
C. Total cost ( A + B) (USD) 4,409,496 6,460,276
D. Revenue (USD) 10,073,697 10,637,612
Source: Primary Data After Being Processed, 2016.
Analysis of Differences in Average Production Peanut. T test results are known differences in farm production Peanut Variety Nulion1 and Variety Nulion 2, homogeneity of variance test results p value = 0,000 (sig. 0.000) is less than 0.05, indicating reject Ho at level α 5% 2-way test, means that there are differences in production between Nolion 1 and Nolion2 in the village Nolion, Tobungku and Piley District of South Totikum, where the average production of respondents varieties Nolion 2 higher than the varieties Nolion 1. The value of t-test is obtained by - 1,749 smaller than t-table (0.05; 51) = 2.007.
The difference between the average production of varieties of peanut farming varieties Nolion 1 with peanut varieties Nolion 2, amounting to 291 kg of dry pods / ha, this happens because influenced by the factors of production (input). Technically peanut production rate is determined by the ability to manage through the four components of farming technology is the
use of seeds, fertilizers, pesticides and labor, on the other hand, the production of which was obtained largely determine the amount of income, while income levels are influenced by the cost of production and selling price.
106 According Saptana et al., (2010)
states that the use of labor intensive also related to the effort to address the risks interactively manage the farming seriously. This means that the addition of the use of labor will be to mitigate the risks of farming.
Analysis of Differences in Average Income. t test result differences in production and income in Table 2 can be known differences Peanut farm production Variety Nulion 1 and Variety Nulion 2, homogeneity of variance test results p value = 0,017 (sig.0.017) is less than 0.05, indicating reject Ho at level α of 5% 2-way test, it means that there is a difference in income between Nolion 1 and Nulion 2 in the village Nolion, Tobungku and the District Piley South Totikum, where the average income of respondents varieties Nolion 2 higher than the NulionNolion 1. The value of t-test is obtained by -6.481 smaller than t-table (0.05; 51) = 2.007.
The difference between the average production of varieties of peanut farming
Nulion Nolion 1 with peanut varieties Nolion 2, amount Rp. 563.915,-/ha.
CONCLUSIONS
Conclusion
Based on the results, it can be concluded that:
1. The average production of farm peanut varieties Nolion 1 amounted to 1,609 kg of dry pods/ha and an average production of farm peanut varieties Nolion 2 amounted to 1,900 kg of dry beans pods/ha Village Nulion, Tobungku and Peley District of South Totikum Banggai Islands.
2. The average income of farmers varieties of peanut farming varieties Nolion 1 Rp.10,073,697,-/ha, and the average income of farmers farming peanut varieties Nolion 2 Rp.10.637.612,-/ha in the village Nulion, Tobungku and Peley South Totikum Subdistrict, Banggai Islands. 3. There is a marked difference between
the average production and the average income of peanut farming varieties Nolion 1 with the average production of peanuts in varieties Nolion 2 in village Nolion, Tobungku and Peley sub districts of Totikum Selatan.
REFERENCES
Adiratma ER, 2004. Stop Planting Rice: Rice Farmers' Thinking Condition Indonesia and Efforts to Improve Welfare of Farmers. Sower Swadaya, Jakarta.
Siti Nur Shaliha, 2015. Outlook Food Peanut. In Leli Nuryati, Budi Waryanti, Noviati and Roch Widaningsih. J. ISSN-1907-1507. Data Center and Information Systems Agriculture. Ministry of Agriculture, Jakarta
Decree of the Minister of Agriculture, 2014. The Agriculture Decree No.1177 / kpts / SR.12 / 11/2014. Jakarta.
Sugiyono, 2007. Qualitative and Quantitative Research Methods R&D. Molds 19th. CV Alfabeta, Bandung
Soekartawi, 2002. Farming Systems Analysis. UI Press. Jakarta
Saptana, A. Daryanto., HK Daryanto and Kuntjoro. 2010. Risk Management Strategy Peasant Red Chili On