Selecting Transport Modes of Railway and
Road Based on Tariff and Travel Time
Tertib Sinulingga STMT Trisakti [email protected] [email protected]
Lily Surayya Eka Putri STMT Trisakti [email protected]
ABSTRACT
Introduction
As we have known, the commodities produced in Bandung and its surroundings are distributed to various places. One of the destinations is Tanjung Priok port, through which the commodities are subsequently distributed to other areas and overseas.
Regarding this, various goods need a place, such as a container, so that they can be transported safely. Thus, there are three routes of transporting containers using two kinds of vehicle, namely:
Route-1 : Railway (TPK Gedebage– Karawang–Bekasi–Tanjung Priok port/ Pasoso Terminal). Route-2 : Highway (Padalarang
highway–Cipularang highway– Cikampek highway–Tanjung Priok container terminal).
Route-3 : Highway and road (Bandung-Purwakarta road–(Bandung-Purwakarta– Cikampek road–Cikampek highway–Tanjung Priok port). From those three routes, Route-2 and Route-3 are considered more common, more effective and more eficient. It is because the level of transportation mode using container is proportionally different for each mode.
Based on the data obtained through a study on the eficiency improvement of container transport service from Gede Bage
Dry Port to Tanjung Priok port carried out by Center for Research and Development of Multimode Transport Management (Puslitbang Manajemen Transportasi Multimoda) in 2002, it is clear that the use of container grew signiicantly since 1988 until 1996—and decreased from 1997 to 2001. This is because the users are increasingly turn to use road transportation (trailer truck).
In line with the above description, travel time also causes the low usage level of train mode from TPK Gedebage to Tanjung Priok port. It can not be denied,
from various scientiic references, that travel time is one of the factors to be taken into account by the users of transport services, in addition to other factors such as cost, safety, comfort, reliability, and so on.
From the observation toward the data on container transport using railway, the result is as follows; length of route 213 km, travel time 640 minutes, and transport tariff from industrial center to TPK Gedebage Rp400,000/truck, TPK Gede Bage–Pasoso for 20 feet container Rp1,100,000/box and TPK Gede Bage– Pasoso for 40 feet container Rp1,650,000/ box. Meanwhile, the container transport by road should travel a route of 164 km, 320 minutes travel time and the transport tariff Sentra industri–Pelabuhan Tanjung Priok for 20 feet container Rp2,650,000 and 40 feet Rp3,350,000.
From the aspect of tariff, the opportunity of selecting the mode of transport by train is bigger than by truck. However, if seen from the travel time, the opportunity of selecting the mode of transport by road is more interesting. In fact, the use of truck is much more than of train.
Regarding the above description, the writer is interested in studying the selection of transport mode by railway and road based on the transport tariff and travel time from Bandung and its surroundings to Tanjung Priok port using applied research method and survey (Sugiyono, 2013). Therefore, the writer collects data by using
simple random sampling method, with the sample size based on the size developed by Issac and Michael (in Sugiyono, 2013),that is 20 feet container as follows:
- l2 with dk = 1, level of error 5%, - P = Q = 0,5,
- d = 0,05
- N = 1,499 drivers.
obtained is as many as 283 drivers. In the same way for 40 feet container, with the population (N) = 1,814, then the number of samples obtained is as many as 294 drivers. Results and Discussion
A. Selection of Transportation Mode
According to Jon D. Fricker and Robert K. Whitford (2004), transportation is a movement of people or goods from the origin place to a destination one. Whereas Edward K. Morlok (1984) explains that transportation is “an act, process, or thing of transporting or being transported.”
Subsequently, C.S Papacostas and P.D. Prevedouros (2001) explain that mode selection is about the attitude of a traveler in selecting his modes of transportation. Whereas according to Nicholas J. Garber, Lester A. Hoel (2009), mode selection is an aspect of analysis process on the demand that determines the number or the percentage of interzonal travelling using cars and transit. The latter is supported by Juan de Dios Ortuzar and Luis G. Willumsen (1994); there are two factors of mode selection related to the characteristics of transport facilities, namely:
1. Quantitative factors, such as:
a. Relative travel time of the vehicle (in the vehicle, waiting time, and going to each mode);
b. Relative cost (tax, fuel, and direct cost); and
c. Parking fee.
2. Qualitative factors, such as: a. comfort;
b. reliability; and c. safety.
According to Kittelson (1999), mode selection is a proportion of the total
travelling using various characteristics of vehicles. Whereas according to Edward K. Morlok (1984), mode selection depends on the mode characteristics relecting the cost that is made all the same in using those modes. In this case, such a cost inluences the inter-city mode selection in the same way. The important factors here are total travel time for each alternative mode from the origin place to the destination, total cost from the origin place to the destination, comfort in relation with the alternative, and the passenger safety.
In line with that, M. Nur Nasution (2003) explains that in selecting the transport mode for a certain product, the sender should take the following seven criteria into account:
1. the speed of delivery for door to door or building to building;
2. the frequency of scheduled delivery; 3. the obstacles in fulilling the schedule
on time;
4. the ability to handle transportation for various goods;
5. the number of transits and discharging/ loading;
6. the cost per ton-kilometer; and 7. the guarantee for damage or loss.
Considering various opinions mentioned above, transportation mode selection can be synthesized as the opportunity value or proportion of using each kind of transportation vehicle with the indicator of percentage which in this case illustrates the usage level of transportation mode desired by the user. The bigger the percentage, the higher interest of the user in selecting a certain mode of transportation. B. Transportation Tariff
statement clearly says that tariff is used to measure the service cost. Meanwhile, the supply and demand which altogether determine the price of various goods and services in economy are the prices and direction leading to the allocation of resources (N. Gregory Mankiw, 2003).
Subsequently, demand is a number of goods or products to be purchased by the consumers at certain prices in a certain period of time (Oka A Yuti, 2008). In this article, the service buyer is the consumer or the user of container transport service— while the price of a service can illustrate the consumer behavior; the higher the price of a service the lower the use of a transportation mode. In another word, it is the price of a service that inluences the consumer behavior. Whereas, tariff is the level of cost offered for the provided rules of a service (Regis J Bates, Donald W. Gregory, 2001).
Based on the above explanation, we should be careful in using the words price, tariff, and cost. Here, tariff is always related to various kinds of service, while if related to the use of transportation service, tariff is the most common term used.
From several opinions above, the writer synthesizes that a transporting tariff is the degree of a currency to be sacriiced for a container transportation service, and it is offered by the transportation service provider with the indicator of rupiah/unit. The value of rupiah/teu illustrates the transportation tariff. The higher the value of rupiah/teu the higher the transportation tariff.
C. Travel Time
According to Jon D Kendal, Donghyun Park, Radholph Tan (1997), the assessment of travel time is the differential basic for the time consumed during the travel between the useful tume and the unuseful one. In this case, travel time consists of (1) usefule time; running time
of the vehicle and time for discharging/ loading; and (2) unuseful time; waiting time, goods storage, and so on.
Subsequently, the total travel time in the transportation planning is the length of time passing through the route. In this case, the route from the origin place to the destination—including waiting time and movement in the mode-changing sites and the inal destination (Kittelson, 1999).
According to Edward K. Morlok (1984), “time” can be considered as cost. Therefore, in the transportation economy, travel time is one the factors that inluence the attitude toward the supply and demand of container transportation service. In this case, time is one of the transportation cost components that can describe the consumer behavior; the longer the travel the lower the usage level of a transportation mode.
From several opinions above, travel time can be synthesized as the length of time consumed to pass through the routes relating the origin palce to the destination. Here, travel time consists of moving time, waiting time, processing time in the mode-changing place with the indicator of number value and uni of time (second, minute, hour, and so forth). In this article, the travel time indicator is minutes/teus. This value illustrates the travel time with which the higher the unit of value, the longer travel time to be passed through.
The development of transportation services is an effort to minimize the transportation cost (travel time). According to Roddirigue et al. (2009), there is a corelation among the transportation cost, the travel distance, and the selection of transportation mode to be used. The transportation mode of road is commonly used for short distance, railway transport for middle distance, and sea and air transport for long distance.
Each of the transportation by road, railway, and sea respectively has the cost fuction C1, C2 dan C3. Land transportation has the lower cost function for short distance compare to railway and sea for midle and air transportation for long distance. At point D.1 will be proitable if use land transportation and both railway and land transportation will reach it’s proitable until point D.2 and the rest will be proitable if use sea and air tarnportation. The Distances for point D.1 are equel to 500 km and point D.2 for 1000 – 1.500.000 km.
D. Analysis on the Relation between Transportation Tariff and Travel Time and Their Inluence on the Ratio or Opportunity of Selecting the Mode of Railway Transport
1. Analysis Description
Many factors should be taken into account to select the mode of transportation such as tariff, time, safety, comfort, and so on. However, various scientiic references state that the model for mode selection are commonly tariff and travel time. Therefore, this analysis on mode selection is based on tariff and travel time. The results of this research on 972 respondents of container truck drivers are as follows:
a. From the production center to Container Terminal there are 38 drivers of 20 feet container truck, and 40 drivers of 40 feet container truck. The total number
of drivers is 78 people;
b. From the production center to Tanjung Priok port there are 332 drivers of 20 feet container truck, and 562 drivers of 40 feet container truck. The total number of drivers is 894 people.
In zone-1 (Cimahi) no container is found to be transported by train, thus this zone is not used in the analysis.
Subsequently, the observation shows that the use of train is relatively lower than the use of truck. Therefor, the ratio between the usage level of train and truck passing through Cipularang becomes the dependent variable (Y). The ratio between the usage level of train and truck caused by the difference of tariff (X1) and travel time (X2).
From the data recapitulation, the tariff between 20 feet containers and 40 feet containers is signiicantly different. Thus, in the analysis on the mode selection 20 feet containers and 40 feet containers are separated. The variables are Y20, X120, X220 for 20 feet containers and Y40, X140, X240 for 40 feet containers.
2. Regression Analysis
a. Requirement Test
b. Coeficient of Determination R2,
t Test and F Test (ANOVA)
Coeficient of determination indicates the size of contribution or the percentage of the independent variable’s inluence on the dependent variable. For the inluence of one or two independent variables on the dependent variable, the coeficient of determination is R2 (Adjusted R Square)
which is the result of squaring the value of R. Whereas for the correlation of more than two independent variables on the dependent variable, the coeficient of determination is adjusted R2.
Subsequently, to know whether the correlation between one independent variable and dependent variable is signiicant or not, t Test is carried out. Based on the result of that test, it is clear that the correlation between independent variable and the dependent is signiicant and the result can be seen in Table I below. c. Regression Equation
From the data analysis there is a fact, that in the simple (separated) regression analysis the three independent variables have strong correlation with and signiicant
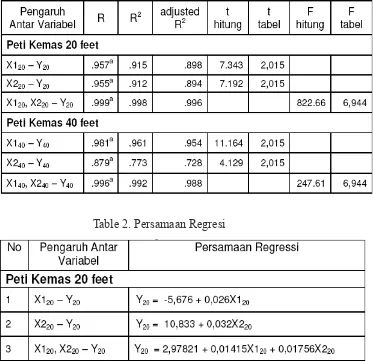
Table 1. Pengaruh Antar Variabel
inluence on the dependent variable. It also inds the ratio of usage level between traion and truck. The variable of tariff difference signiicantly inluences the variable of the ratio of usage level between train and truck. Likewise, the variable of the difference of travel time has a signiicant inluence on the variable of the ratio of usage level between train and truck.
In the multiple regression analysis it is seen that both of the independent variables (altogether) have signiicant inluence on the dependent variable. This indicates that the difference of tariff and the difference of travel time altogether signiicantly inluence or contribute to the ratio of the usage level between train and truck. The regression equation of each model can be seen completely in Table II above.
Based on the discussion above, it is found that the tariff difference for transporting 20 feet containers (X120) will signiicantly inluence the comparison of selecting transportation mode of railway (Y20) and the value of R2 = 0.915. Whereas
the difference of travel time tariffs (X120) of 20 feet containers signiicantly inluences the comparison between selecting railway transportation mode (Y20) with R2 = 0.912.
In this case, the Fcal value of the tariff difference variable and the travel time of 20 feet container altogether is 822.66. After that, the selection of railway mode and road can be determined based on the transport tariff and the travel time. Therefore, the regression analysis obtains a regression model of 20 feet container which results ini a constant 2.97821, coeficient of transport tariff difference 0.01415 and coeficient of travel time difference 0.01756. This value is then turned into the value of the model of selecting the transportation mode of railway and road to become a constant 2,104,742 rupiah and the value of time difference is 12,409.894 rupiah/minute.
Meanwhile, the tariff difference of transporting 40 feet container (X140)
signiicantly inluences the comparison between selecting railway transportation mode (Y40) and the value of R2 = 0.961.
The difference of travel time tariff for 20 feet container (X40) signiicantly inluences the comparison between selecting railway transportation mode (Y40) and the value of R2 = 0.773; 7. In this case, the F
cal of the
tariff difference and travel time for 40 feet container variables altogether is 247.61. Subsequently, the selection of railway and road modes can be determined based on the transportation tariff and the travel time. Using regression analysis, we obtain the regression model for 40 feet container that results in a constant -1.792, coeficient of transportation tariff difference 0.0091852, and coeficient of travel time difference 0.0050148. These values are then turned into a value of the selection model of railway and road transportation modes with a constant -1.950.882,94 rupiah and a value of time difference 5,459.6525 rupiah/ minute.
3. Analysis on the Mode Selection
As we know, it is very possible for users of container transport service from Bandung and its surroundings to Tanjung Priok port to choose 2 (two) modes of transportation, namely railway (train) and road (truck) transportation modes since both of the modes have an opportunity to carry containers. In this research, the opportunity value is determined only by tariff and travel time.
In order to make a model of each opportunity value of transportation mode usage, both railway and road, especially from the above regression equation, we obtain a model of mode selection or opportunity value or a proportion of using each mode as follows:
a. 20 feet container
difference of travel time (∆t) between truck and train. In this case, the difference of tariff is divided by 10,000 rupiah, and the model is:
If the difference of tariff is not divided by 10,000 rupiah, then the model is as follows:
Meanwhile the opportunity value of using truck is:
ρtruk20 = 1 – ρka20
Both of the opportunity values are mutually nullifying. It means that if the opportunity value of using train for 20 feet container (ρka20) increases, then the opportunity value of using truck for 20 feet container (ρtruk20) will decrease and vice versa. How far these opportunity values are mutually nullifying is much determined by the service offer in terms of tariff and travel time of each container transportation mode. The total opportunity value of using both transportation modes is 1.
ρtruk20 + ρka20 = 1
b. 40 feet container
The opportunity value of using train (ρ ka40) is determined by the difference of transporation tariff (∆P40) and the difference of travel time (∆t) between truck and train. In this case, the difference of tariff is divided by 10,000 rupiah, and the model is:
If the difference of tariff is not divided by 10,000 rupiah, then the model is as follows:
Meanwhile the opportunity value of using truck is:
Both of the opportunity values are mutually nullifying. It means that if the opportunity value of using train for 40 feet container (ρka40) increases, then the opportunity value of using truck for 40 feet container (ρtruk20) will decrease and vice versa. How far these opportunity values are mutually nullifying is much determined by the service offer in terms of tariff and travel time of each container transportation mode.
The total opportunity value of using both transportation modes is 1 or 100%. Mathematically the equation is as follows:
Although the above-mentioned model has been obtained, however, it can not be used permanently. But in this analysis, the emphasize is what method can be used to obtain such a model. There are many considerations for this, i.e.:
• The inluence of luctuative economy condition;
• Policy on price related to the operational cost of transportation mode, such as increasing price of fuel; and
• Changes in the transportation network system, for example, the development of railway network such as station addition, track addition, highway development, etc.
Conclusion
The difference of transportation tariff for 20 feet and 40 feet containers, that is the difference between the tariffs of truck and of train, shows positive value or the tariff of truck > the tariff of train. Therefore, although the tariff of train is lower than of truck, but the usage level of train is relatively much lower than the usage level of truck.
The difference of travel time for 20 feet and 40 feet containers, and the difference of travel time between truck and train shows negative value or the travel time of truck < the travel time of train. This indicates that container transportation from Bandung and its surroundings to Tanjung Priok port will be faster if it uses truck rather than train.
The analysis model of selecting transportation mode of railway and road based on the transportation tariff and travel time has been able to describe the market position for both train and truck. Nowadays, it can be said explicitly that the market position of train is very weak.
The results of regression analysis and analysis on mode selection have proved the weak market position of train because the travel time of container becomes longer. There some reasons for this: (1) containers from industrial center to container terminal (TPK) should be loaded on truck irst; (2) the discharging and loading process at TPK Gedebage takes long time; and (3) the frequency of transportation Bandung-Jakarta is very limited.
Thus, it is better to improve the train services by shortening the travel time and minimizing the length of discharging and loading process at TPK Gedebage and TPK Pasoso by adding the stevedoring equipment (transtainer). In line with this, it is time to enhance the frequency of travel by train from Bandung to Jakarta through developing railway networks and so on.
Although the market position of train can be known through the analysis on the selection of railway and road transportation mode based on tariff and travel time, this model can not always be used. The users of this model are expected to monitor the transportation policy against that route, especially related to tariff and travel time. In another word, although the transportation mode selection model can predict a change, but after the change it should be re-examined. This should be done continuously.
Bibliography
Bates, Regis J and Donald W Gregory. 2001.
Voice and Data Communications Handbook.
Dios, Juan de and Luis G. Willumsen Steer Davies Gleave. 1994. Modelling Transport, secondEdition. Santiago, Chile and UK: Ortuzar-Departement of Transport Engeneering Pontiicia Universidad Catolica de Chile. Fricker, Jon D and Robert K. Whitford. 2004.
Fundamentals of Transportation Engineering A Multimodal Systems Approach, pearson (International Edition).Puerdue: School of Civel Engineering Purdue University. Garber, Nicolas J and Lester A. Hoel. 2009.
Trafic and Highway Engineering. Kittelson & Associates.1999. Transit Capacity and Quality of Service Manual. Texas: Texas Transportation Institute.
Mankiw, N Gregory. 2001. Pengantar Ekonomi, Second Edition, Book 2. Harvard: Harvard University.
Morlok, Edward K. 1984. Pengantar Teknik dan Perencanaan Transportasi.
Nasution, M. Nur. 2003. Manajemen Transportasi. Jakarta:
Papacostas, C.S. and P. D. Prevedouros. 2001. Transportation Engineering and Planning Third Edition. Honolulu,Hawaii: University of Hawaii at Manoa.
Sugiyono. 2013. Metode Penelitian Kuantitatif, Kualitatif dan R&D
(16th print). Bandung: Alfabeta Yuti, Oka A. 2008. Ekonomi Pariwisata.