This research examines the influence of agricultural commodity price movements on stock price and gross profit of food and beverage companies in Indonesia, as well as the effect of volatility prices of agricultural commodities. Using time series data of food and beverages (F&B) companies that are listed at the Indonesia Stock Exchange (IDX), this research calculating the event studies to find the abnormal returns. The results showed that the movement of agricultural commodity prices has a positive effect on stock prices of F&B companies, with the dominant influence of commodity prices of corn and sugar. Agricultural commodity prices also affect positively on gross profit F&B companies, with the dominant influence of commodity prices of corn and palm oil. The increase in prices of agricultural commodities simultaneously affect the value of a positive cumulative abnormal return for stocks of F&B companies. The results also showed that the decline of agricultural commodities simultaneously affect the value of negative cumulative abnormal return for stocks of F&B companies.
© 2013 IRJBS, All rights reserved.
Keywords: Abnormal Return, Agricultural Commodity, F&B Companies, Gross Profit, Stock Price
Corresponding author: [email protected]
Rofikoh Rokhim
*, Puguh Setiawan
** *Universitas Indonesia, Jakarta**PT Kapal Api Global
A R T I C L E I N F O A B S T R A C T
INTRODUCTION
During the last decade, a major agricultural commodity prices (soft commodities) in the world experienced significant price fluctuations. Data from the World Bank (2013) shows the price index of agricultural commodities from 2005 to 2011 has increased more than twofold. Some agricultural commodities become food product’s raw material for most of the population of the world, such as: sugar, palm oil, corn, and wheat. Fluctuations
in food prices has affected huge social and economic stability in the countries of the world. High inflation of agricultural commodities has affected the purchasing power of food products for most population of the world. For some F&B industries, agricultural commodities inflation and its derivatives have cut most of the company’s profit margin, because it directly affects raw materials cost contribute to 40-55% of total cost of the company (Lee, 2002). Moreover research Nazlioglu and
Vol. 6 | No. 1 ISSN: 2089-6271
The Influence of Agricultural Commodity
Soytas (2012) notes that agricultural commodities prices always depends on oil price and dollar. Commodities prices also have relations with poverty (Estrades and Terra, 2012) and macroeconomics conditions (Makin, 2013).
Gubler and Hertweck’s research (2013) shows that commodity price shocks are a very important driving force of macroeconomic fluctuations, second only to investment-specific technology shocks, particularly with respect to inflation. Neutral technology shocks and monetary policy shocks, on the other hand, seem less relevant at business cycle frequencies. Neutral technology shocks rather play an important role at low frequencies. Belke, Gordon and Volz (2012) investigates the relationship between global liquidity and commodity and food prices applying a global cointegrated vector-autoregressive model. They use different measures of global liquidity and various indices of commodity and food prices for the period 1980–2011. The results support the hypothesis that there is a positive long-run relation between global liquidity and the development of food and commodity prices, and that food and commodity prices adjust significantly to this cointegrating relation. Global liquidity, in contrast, does not adjust, it drives the relationship.
Oil price changes has great impact to agricultural commodities market. The responses of agricultural commodity prices to oil price changes depend greatly on whether they are caused oil supply shocks, aggregate demand shocks or other oil-specific shocks mainly driven by precautionary demand. Oil shocks can explain a minor friction of agricultural commodity price variations before the food crisis in 2006–2008, whereas in post-crisis period their explanatory abilities become much higher. After crisis, the contributions of oil-specific factors to variations in agricultural commodity prices are greater than those of aggregate demand shocks. Nazlioglu and Soytas (2011) examines the dynamic relationship between world oil prices and twenty four world agricultural commodity
prices, based on monthly prices ranging from January 1980 to February 2010, accounting for changes in the relative strength of US dollar in a panel setting. The empirical results provide strong evidence on the impact of world oil price changes on agricultural commodity prices. They find strong support for the role of world oil prices on prices of several agricultural commodities. The positive impact of a weak dollar on agricultural prices is also confirmed.
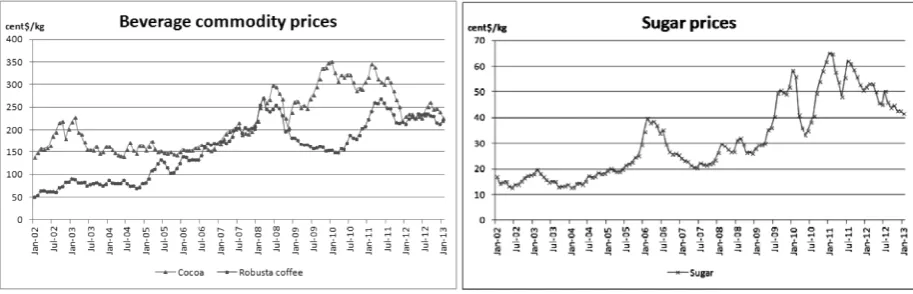
Fluctuations in agricultural commodity prices is very significant especially during the last ten years. All agricultural commodity prices increased significantly, both in the category of vegetable oils (such as palm oil and soybean oil), as well as in the category of grains such as corn and wheat (World Bank, 2013), as shown in Figure 1.
In the beverage category (such as chocolate and coffee Robusta) and other categories (such as sugar), commodity prices also increased by a similar trend with other agricultural commodities, as shown in Figure 2.
According to Schnepf (2009) the price is redress mechanisms linking major agricultural commodities through several levels of the market system to retail food products. The nature of agricultural commodity prices influence the price of retail food products in general depend on the size of its contribution to the retail price of food and the level of market competition. Schnepf identified three fundamental factors to describe the influence of agricultural commodity prices on retail food products, namely:
• Magnitude: the magnitude of the effect of price movements on all levels of the market to other levels
• The speed of the adjustment: if there is a delay in adjusting levels between marketing
Retail food prices adjust rapidly rising prices of agricultural commodities, and very slowly lower the prices of agricultural commodities when the price drops (Schnepf, 2009).
Furthermore Schnepf (2012) states that the price of retail food products is more influenced by consumer demand (which is strongly influenced by economic conditions), compared to changes in the price of agricultural commodities. This association varies depending on the content of agricultural commodities in the retail food products. According to Lee (2002), the increase in agricultural commodity prices have the greatest influence on rising prices of food products compared to other factors such as rising energy costs, the cost of production and service costs. Among all sectors of the food industry, meat packing industry, poultry processing and dairy
industry will have the biggest impact of the increase in input prices of agricultural commodities.
F&B industry is a sector that absorbs most agricultural commodities as its main raw material. According to Lee (2002), among all F&B industry, meat processing industry is sub-sectors that have the largest percentage of raw materials cost of agricultural commodities for 73.55% of the total sales value (its output), and the lowest is the fisheries and fish industry by 12.45%. Thus the effect of the increase in input prices of agricultural commodities (meat) will be more significant than the increase in input prices of agricultural commodities in other sectors.
As with Lee’s study (2002) who analyzed the contribution of agricultural commodity input prices in the retail food industry in the United Figure 1. Commodity price movements on vegetable oils and grains 2002-2013
States in 1992, Schnepf’s research (2009) with the data of 2006-2008 showed the manufacturing sector including poultry and dairy sectors with the contribution of agricultural commodities large. If Lee’s research put the meat processing sector as the industry contributing the largest agricultural commodity inputs, then Schnepf analyzed that meat processing sector only at number four. Schnepf (2009) included more aspects that affect the output price of food retail, including promotional expenses, taxes, and profit; compared to Lee (2002) which takes into account only the cost of goods sold.
Schnepf (2009) mentions the transmission of agricultural commodity prices to the retail food price movements (following the price movements of agricultural commodities), which is rapid movement directly in the first month after rising agricultural commodity prices, and a slow/pause occurred six months after the prices of agricultural commodities down. Price transmission to retail food products also occurs asymmetry, where the percentage of retail price reductions occurred not by the percentage increase in the retail price. This condition is mentioned Schnepf as sticky price in retail food products. Sticky price is influenced by several factors: consumer behavior, product turnover costs (switching costs), retail inventory management, retail costs due to price changes (relating to labeling and promotion) and market uncertainty. Research on the volatility of prices of agricultural commodities is also done by Bluedorn, Duttagupta, Pescatori and Snudden (2012), Paul and MacDonald (2000), and Schluter (1998), and further Conroy and Narula (2012) and Grant Thornton International (2011) reported the association with food firm’s performance.
Cashin, McDermott and Scott (2002) finds that there is an asymmetry in commodity price cycles, as price slumps last longer than price booms. How far prices fall in a slump is found to be slightly larger than how far they tend to rebound in a subsequent boom. In addition, for most commodities, the
probability of an end to a slump (boom) in prices is independent of the time already spent in the slump (boom). Browne and Cronin (2010) argue that long run and dynamic relationships should exist between commodity prices, consumer prices and money. Their empirical analysis shows equilibrium relationships existing between money, commodity prices and consumer prices, with both commodity and consumer prices proportional to the money supply in the long run. Persistence profiles reveal commodity prices initially overshooting their new equilibrium values in response to a money supply shock. They conclude that money has to be brought into analyses of the relationship between commodity prices and consumer prices.
Research Objective
This study aims to analyze the relationship between world agricultural commodity price movements with the movement of the stock price of food and beverage companies, analyze the effect of price movements of raw materials (agricultural commodities) on the financial performance particularly gross profit of F&B companies, to test the extent of significance relationship between variables in agricultural commodity prices with the variable gross profit and stock price of F&B companies, and analyze whether the increase/ decrease in the price of agricultural commodities caused the abnormal returns and cumulative abnormal return on stocks of F&B company in Indonesia. Financial data used in this research is gross profit because the gross profit is directly related to the cost of input material (agricultural commodities) in F&B industries. While the net profit data is not used in this research due to bias influenced by factors of interest, taxes and depreciation.
Research Scope
of agricultural commodities to be studied limited to: palm oil, wheat, corn, cocoa and sugar. The five of these commodities are highly significant effect on food price index movement in the world as well as being a major input for the F&B industry in Indonesia. F&B companies to be studied is selected to 15 companies listed on the IDX which is a consumer goods company and food services/ restaurant, and industrial goods were strongly associated with agricultural commodities as raw materials. Issuers that have a mix of business sectors (not just F&B, but also other business areas such as: cosmetics, animal feed or other), as well as venture issuers with bottled drinking water are not included in this study (because it is not associated with the commodity agriculture as an input cost).
METHODS Data Sampling
The data used in this study is a secondary data available from the following sources:
• Data agricultural commodity prices daily and
monthly for five commodity palm oil, wheat, corn, cocoa and sugar: obtained from the
World Bank and Thomson Reuters.
• Data daily and monthly stock price, and
the stock price index daily: obtained from Thomson Reuters
• Data quarterly gross profit company: obtained
from Thomson Reuters, the company’s website, and the IDX. The latest period data (3rd and 4th quarter of 2012) was not available in Thomson Reuters yet, so that gross profit data was taken from company’s website and IDX.
Daily data in commodity prices and stock prices are averaged over the period 2005-2012 per monthly and per three months to see the relationship between the prices of agricultural commodities and stock prices studied. Gross earnings data from company financial reports quarterly period 2005-2012 is used to see the effect of commodity prices on the financial performance of agricultural companies studied. Daily price data of agricultural commodities and stock prices during the period 2010-2011 are used to perform event study of the significant rise and decline in agricultural commodity prices.
Code Issuer name Listing date Sector Market capitalization*(IDR billion) Total asset**(IDR billion)
AISA Tiga Pilar Sejahtera Food Tbk 11-Jun-97 FMCG 2,107 3,698
CEKA Cahaya Kalbar Tbk 9-Jul-96 FMCG 714 1,002
DAVO Davomas Abadi Tbk 22-Dec-1994 FMCG 620 2,692
DLTA Delta Djakarta Tbk 12-Feb-84 FMCG 3,050 713
FAST Fast Food Indonesia Tbk 11-May-1993 Trade-Services 6,446 1,676
INDF Indofood Sukses Makmur Tbk 14-Jul-94 FMCG 47,414 56,784
MLBI Multi Bintang Indonesia Tbk 17-Jan-94 FMCG 14,854 1,063
MYOR Mayora Indah Tbk 4-Jul-90 FMCG 17,171 7,800
PSDN Prasidha Aneka Niaga Tbk 18-Oct-1994 FMCG 281 706
PTSP Pioneerindo Gourmet International Tbk 30-May-1994 Trade-Services 607 194
SIPD Sierad Produce Tbk 27-Dec-1996 Basic 498 3,082
SKLT Sekar Laut Tbk 8-Sep-93 FMCG 124 235
SMAR SMART Tbk 20-Nov-1992 Agriculture 19,244 16,219
STTP Siantar Top Tbk 16-Dec-1996 FMCG 1,048 1,103
ULTJ Ultra Jaya Milk Industry Tbk 2-Jul-90 FMCG 3,350 2,247
Data processing
The study consisted of three different parts of the study, so there are three different kinds of data processing to see the effect of price movements of agricultural commodities, which:
1. Influence of agricultural commodity prices on the company’s stock price
This study analyzed the relationship between the price movements of agricultural commodities with the stock price of food and beverage companies by using multiple linear regression with the general form of the regression model for this study are as follows:
PRICEj = β0 + β1 CORN + β2 WHEAT + β3 COCOA + β4 PALMOIL + β5 SUGAR +
ε
jWhere:
PRICEj is stock price of company j CORN is commodity price of corn
WHEAT is commodity price of wheat
COCOA is commodity price of cocoa
PALMOIL is commodity price of palmoil
SUGAR is commodity price of sugar
β0 is the intercept of the regression results
β1 , β2 , β3 , β4 , β5 is the coefficient of the regression
ε
j is variable error (residual)2. Influence of agricultural commodity prices on the company’s gross profit
This section analyzes the effect of agricultural commodity prices on gross profit of food and beverage companies by using multiple linear regression with the regression models are as follows:
PROFITj = β0 + β1 CORN + β2 WHEAT + β3
COCOA + β4 PALMOIL + β5 SUGAR +
ε
jWhere PROFITj is gross profit of company j, while all other coefficients and independent variables are the same with the first part regression.
3. Influence of agricultural commodity prices on abnormal return of company’s stock
According to Bodie, Kane and Marcus (2011: 381-383) abnormal return caused by an event can be estimated from the difference between the stock’s actual return with a benchmark. Many researchers have used the market model to estimate abnormal returns. Event study techniques are empirical financial research methods commonly used to examine the effect of an event on the company’s stock price. Event study techniques are also frequently used to examine the efficiency of the market related to the leaking of information to the market. Event study procedure is divided into four stages, namely:
1. Procedure design and data collection
At this stage, the event (occurrence), the determination of the period of events and data collection is defined. In this study, the first event that affects the abnormal return is defined as an incident in which an increase in the prices of agricultural commodities, the accumulation within five days are above 5%, so thin the first event (t0,1) occurred on 14 October 2010.
Conversely, second event is a drop in the prices of agricultural commodities, the accumulation within five days are more than 5%, and this second event (t0,2) occurred on 14 March 2011.
In this study the incidence of the period is specified [-30,30] or observed 30 days before and after the event, observation period in the first event of the 26 August to 26 November 2010, and from 27 January until 26 April 2011 for the second event. While the estimation period for modeling the expected return is [-300,-31], begin on 5 February 2010. Daily price data of agricultural commodities and daily closing stock prices are collected of the period 4 January 2010 until 30 December 2011.
2. Procedure time series
single index model as follows:
Ŕjt = αj + βj Ŕmt
Where Ŕjtis expected or predicted stock’s return of firm j in period t, and Ŕmt is market return (JCI) in period t, while α and βj are the coefficients obtained from the time series regression results for the observational data for 300 days. Having gained this market model is then carried the expected return estimation.
3. Procedure event study
At this stage, the estimated abnormal return of each stock were observed based on the expected return estimated in the previous stage (time series regression results). Abnormal return calculations performed by the following formula:
ARjt = Rjt - Ŕjt
Where ARjt is abnormal return of firm j in period t, while Rjt is actual return of stock’s firm j in period t. Then the calculation of average abnormal return (AAR) and cumulative average abnormal return (CAAR) is conducted with the following formula:
AARnt is average abnormal return of n
stocks in period t, CARj (t1,t2) is cumulative
abnormal return of stock’s firm j in period
t, and CAAR (t1,t2) is cumulative average
abnormal return for the period t1 to t2.
4. Analysis procedure
In the last stage, statistical test for the significance of the effect of the change event abnormal return before and after the incident, or the number of group shares. Furthermore done interpretation and
analysis of test results.
Hypothesis
In this study, there are several hypotheses that have been prepared on the purpose of the research related to the effects of agricultural commodity price movements on stock prices, gross profit, abnormal return and cumulative abnormal return on stocks of food and beverage companies. Here are six hypotheses, namely:
1. Increase in agricultural commodity prices affect the stock price of food and beverage companies
H0,1 : β1 = β2 = β3 = β4 = β5 = 0
2. Increase in agricultural commodity prices affect the gross profit of food and beverage companies
H0,2 : β1 = β2 = β3 = β4 = β5 = 0
3. Increase in all agricultural commodities prices at the same time more than 5% deliver positive average abnormal return (AAR)
H0,3 : AARt≤ 0
4. Increase in all agricultural commodities prices at the same time more than 5% deliver positive cumulative average abnormal return (CAAR)
H0,4 : CAARt≤ 0
5. Decrease in all agricultural commodities prices at the same time more than 5% deliver negative average abnormal return (AAR)
H0,5 : AARt ≥ 0
6. Decrease in all agricultural commodities prices at the same time more than 5% deliver negative cumulative average abnormal return (CAAR)
H0,6 : CAARt ≥ 0
Statistics Test
regression analysis is being conducted. To test the hypothesis used statistical test F and test t. To measure whether good or not the mathematical model used in the linear regression, the goodness of fit test is conducted by measuring the coefficient of determination (R2). All statistical tests on the method of linear regression was conducted using SPSS.
In the event study research, test t was used to test statistical hypothesis because the sample of companies used is less than 30. In this case it will compare whether the average of the specific sample groups larger or smaller than a value of zero. Statistical formula used is:
Where AARnt is average abnormal return of n stocks in period t, SARt is standard deviation of average abnormal return group stocks in period
t. CAARnt is cumulative average abnormal return stocks in period t, SCARt is standard deviation of cumulative average abnormal return group stocks in period t, and n is number of sample of food and beverage companies.
RESULTS AND DISCUSSION Descriptive Statistics
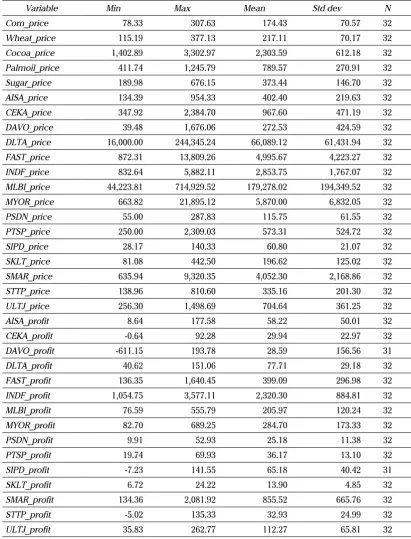
Descriptive statistics of all variables used in this study are presented in Table 2. Study was conducted on 15 samples of food companies (n = 15) and the number of time series observation period a total of 32 three-month period (t = 32).
Variable DAVO profit and SIPD profit is 31 data only, because the financial statements of both companies for 4th quarter 2012 period was not yet available. To detect the presence or absence of autocorrelation across variables the Durbin Watson test (DW test) was conducted using SPSS. If the value of DW statistic test approaching 2 then we can surmise that the residuals are not correlated, which means there’s no autocorrelation. DW
value 0 means there’s positive autocorrelation, while DW value 4 means means there’s negative autocorrelation.
The effect of agricultural commodity prices on the food company’s stock prices
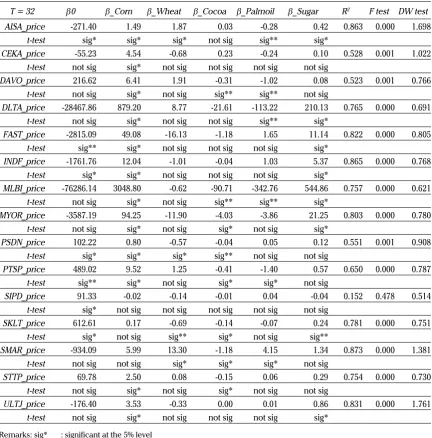
The regression results between variables in agricultural commodity prices with variable stock price of food companies is presented in Table 3.
In all observed food companies indicate that the regression models tested proved significant at the 5% significance level (F test), means that the null hypothesis is rejected, it means that at least one dependent variable that significantly affected the food company’s stock price variable, except on variable stock price PT Sierad Produce (SIPD). This can be explained because the issuer SIPD not directly related to the agricultural commodities variable being tested, namely oil palm, wheat, corn, cocoa and sugar. SIPD is an issuer whose business activities on farms and poultry processing industry, so the company’s performance is more heavily influenced by raw material input prices of poultry.
Regression model shows positive β coefficient of corn prices and sugar prices on all issuers (regardless SIPD). This means that the price of corn and sugar have positive effect on stock prices, which means the higher the price of corn and sugar prices will affect the food company’s stock price increases. t test of significance on the coefficient β corn and sugar prices shows most of the β coefficient is significant at the 5% significance level. The coefficient β corn prices is not significant only in regression models with issuers SIPD (Sierad), SKLT (Sekar Laut) and SMAR (SMART), while the coefficient β sugar prices is not significant in regression models with issuers CEKA (Cahaya Kalbar), DAVO (Davomas), PSDN (Prasidha), PTSP (Pioneerindo/CFC), SIPD (Sierad), SMAR (SMART) and STTP (Siantar Top).
and palm oil prices show largely negative effect on the regression models with food company’s stock price. However, the effect of wheat price, cocoa price and palm oil prices is largely insignificant. The results of t statistic test shows that coefficient
β wheat prices is significant at 5% significance level only at the issuer AISA (Tiga Pilar), PSDN
(Prasidha) and SMAR (SMART). While coefficient β
cocoa prices is significant only at the issuer MYOR (Mayora), PTSP (Pioneerindo/CFC), SKLT (Sekar Laut), SMAR (SMART) and STTP (Siantar Top), and the coefficient β palm oil prices is significant only at the issuer PTSP (Pioneerindo/CFC) and SMAR (SMART).
Variable Min Max Mean Std dev N
Corn_price 78.33 307.63 174.43 70.57 32
Wheat_price 115.19 377.13 217.11 70.17 32
Cocoa_price 1,402.89 3,302.97 2,303.59 612.18 32
Palmoil_price 411.74 1,245.79 789.57 270.91 32
Sugar_price 189.98 676.15 373.44 146.70 32
AISA_price 134.39 954.33 402.40 219.63 32
CEKA_price 347.92 2,384.70 967.60 471.19 32
DAVO_price 39.48 1,676.06 272.53 424.59 32
DLTA_price 16,000.00 244,345.24 66,089.12 61,431.94 32
FAST_price 872.31 13,809.26 4,995.67 4,223.27 32
INDF_price 832.64 5,882.11 2,853.75 1,767.07 32
MLBI_price 44,223.81 714,929.52 179,278.02 194,349.52 32
MYOR_price 663.82 21,895.12 5,870.00 6,832.05 32
PSDN_price 55.00 287.83 115.75 61.55 32
PTSP_price 250.00 2,309.03 573.31 524.72 32
SIPD_price 28.17 140.33 60.80 21.07 32
SKLT_price 81.08 442.50 196.62 125.02 32
SMAR_price 635.94 9,320.35 4,052.30 2,168.86 32
STTP_price 138.96 810.60 335.16 201.30 32
ULTJ_price 256.30 1,498.69 704.64 361.25 32
AISA_profit 8.64 177.58 58.22 50.01 32
CEKA_profit -0.64 92.28 29.94 22.97 32
DAVO_profit -611.15 193.78 28.59 156.56 31
DLTA_profit 40.62 151.06 77.71 29.18 32
FAST_profit 136.35 1,640.45 399.09 296.98 32
INDF_profit 1,054.75 3,577.11 2,320.30 884.81 32
MLBI_profit 76.59 555.79 205.97 120.24 32
MYOR_profit 82.70 689.25 284.70 173.33 32
PSDN_profit 9.91 52.93 25.18 11.38 32
PTSP_profit 19.74 69.93 36.17 13.10 32
SIPD_profit -7.23 141.55 65.18 40.42 31
SKLT_profit 6.72 24.22 13.90 4.85 32
SMAR_profit 134.36 2,081.92 855.52 665.76 32
STTP_profit -5.02 135.33 32.93 24.99 32
ULTJ_profit 35.83 262.77 112.27 65.81 32
Some food companies observed their input costs closely related to the price of agricultural commodities, but the regression model shown no significant effect on its stock price, for example CEKA (Cahaya Kalbar), DAVO (Davomas), INDF (Indofood), PSDN (Prasidha), SIPD (Sierad) and SMAR (SMART). This may be due to the issuer in addition to moving in the downstream processing industry, they are also engaged in upstream processing industry such as palm plantation, cocoa, poultry, coffee or wheat flour, so the
share price is not affected by commodity price movements upstream.
The effect of agricultural commodity prices on the food company’s gross profit
The second regression performed in this research is to look for the influence of agricultural commodity price movements on gross profit of food and beverage companies. Results of regression and statistical tests between the independent variables in agricultural commodity prices with the Table 3. Regression result between variables stock price and agricultural commodity price
T = 32 β0 β_Corn β_Wheat β_Cocoa β_Palmoil β_Sugar R2 F test DW test
AISA_price -271.40 1.49 1.87 0.03 -0.28 0.42 0.863 0.000 1.698
t-test sig* sig* sig* not sig sig** sig*
CEKA_price -55.23 4.54 -0.68 0.23 -0.24 0.10 0.528 0.001 1.022
t-test not sig sig* not sig not sig not sig not sig
DAVO_price 216.62 6.41 1.91 -0.31 -1.02 0.08 0.523 0.001 0.766
t-test not sig sig* not sig sig** sig** not sig
DLTA_price -28467.86 879.20 8.77 -21.61 -113.22 210.13 0.765 0.000 0.691
t-test not sig sig* not sig not sig sig** sig*
FAST_price -2815.09 49.08 -16.13 -1.18 1.65 11.14 0.822 0.000 0.805
t-test sig** sig* not sig not sig not sig sig*
INDF_price -1761.76 12.04 -1.01 -0.04 1.03 5.37 0.865 0.000 0.768
t-test sig* sig* not sig not sig not sig sig*
MLBI_price -76286.14 3048.80 -0.62 -90.71 -342.76 544.86 0.757 0.000 0.621
t-test not sig sig* not sig sig** sig** sig*
MYOR_price -3587.19 94.25 -11.90 -4.03 -3.86 21.25 0.803 0.000 0.780
t-test not sig sig* not sig sig* not sig sig*
PSDN_price 102.22 0.80 -0.57 -0.04 0.05 0.12 0.551 0.001 0.908
t-test sig* sig* sig* sig** not sig not sig
PTSP_price 489.02 9.52 1.25 -0.41 -1.40 0.57 0.650 0.000 0.787
t-test sig** sig* not sig sig* sig* not sig
SIPD_price 91.33 -0.02 -0.14 -0.01 0.04 -0.04 0.152 0.478 0.514
t-test sig* not sig not sig not sig not sig not sig
SKLT_price 612.61 0.17 -0.69 -0.14 -0.07 0.24 0.781 0.000 0.751
t-test sig* not sig sig** sig* not sig sig**
SMAR_price -934.09 5.99 13.30 -1.18 4.15 1.34 0.873 0.000 1.381
t-test not sig not sig sig* sig* sig* not sig
STTP_price 69.78 2.50 0.08 -0.15 0.06 0.29 0.754 0.000 0.730
t-test not sig sig* not sig sig* not sig not sig
ULTJ_price -176.40 3.53 -0.33 0.00 0.01 0.86 0.831 0.000 1.761
t-test not sig sig* not sig not sig not sig sig*
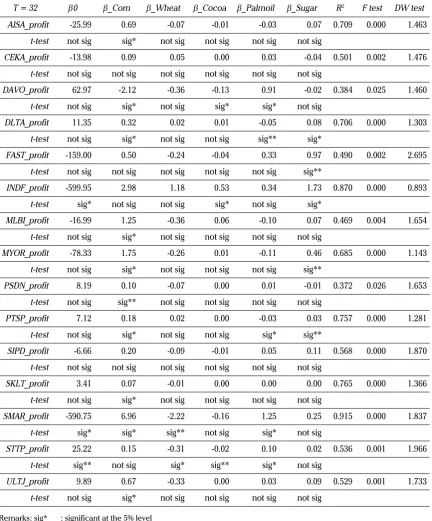
dependent variable gross profit of observed food company presented in Table 4.
All food company objects were observed indicate that the regression models tested proved statistically significant at the 5% significance level
(F test), means that the null hypothesis is rejected, it means that at least one variable in agricultural commodity prices significantly affect the variable gross profit of food company. In regression between the prices of agricultural commodities to the food company’s gross profit, the coefficient Tabel 4. Regression result between variables gross profit and agricultural commodity price
Remarks: sig* : significant at the 5% level sig** : significant at the 10% level not sig : not significant
T = 32 β0 β_Corn β_Wheat β_Cocoa β_Palmoil β_Sugar R2 F test DW test
AISA_profit -25.99 0.69 -0.07 -0.01 -0.03 0.07 0.709 0.000 1.463
t-test not sig sig* not sig not sig not sig not sig
CEKA_profit -13.98 0.09 0.05 0.00 0.03 -0.04 0.501 0.002 1.476
t-test not sig not sig not sig not sig not sig not sig
DAVO_profit 62.97 -2.12 -0.36 -0.13 0.91 -0.02 0.384 0.025 1.460
t-test not sig sig* not sig sig* sig* not sig
DLTA_profit 11.35 0.32 0.02 0.01 -0.05 0.08 0.706 0.000 1.303
t-test not sig sig* not sig not sig sig** sig*
FAST_profit -159.00 0.50 -0.24 -0.04 0.33 0.97 0.490 0.002 2.695
t-test not sig not sig not sig not sig not sig sig**
INDF_profit -599.95 2.98 1.18 0.53 0.34 1.73 0.870 0.000 0.893
t-test sig* not sig not sig sig* not sig sig*
MLBI_profit -16.99 1.25 -0.36 0.06 -0.10 0.07 0.469 0.004 1.654
t-test not sig sig* not sig not sig not sig not sig
MYOR_profit -78.33 1.75 -0.26 0.01 -0.11 0.46 0.685 0.000 1.143
t-test not sig sig* not sig not sig not sig sig**
PSDN_profit 8.19 0.10 -0.07 0.00 0.01 -0.01 0.372 0.026 1.653
t-test not sig sig** not sig not sig not sig not sig
PTSP_profit 7.12 0.18 0.02 0.00 -0.03 0.03 0.757 0.000 1.281
t-test not sig sig* not sig not sig sig* sig**
SIPD_profit -6.66 0.20 -0.09 -0.01 0.05 0.11 0.568 0.000 1.870
t-test not sig not sig not sig not sig not sig not sig
SKLT_profit 3.41 0.07 -0.01 0.00 0.00 0.00 0.765 0.000 1.366
t-test not sig sig* not sig not sig not sig not sig
SMAR_profit -590.75 6.96 -2.22 -0.16 1.25 0.25 0.915 0.000 1.837
t-test sig* sig* sig** not sig sig* not sig
STTP_profit 25.22 0.15 -0.31 -0.02 0.10 0.02 0.536 0.001 1.966
t-test sig** not sig sig* sig** sig* not sig
ULTJ_profit 9.89 0.67 -0.33 0.00 0.03 0.09 0.529 0.001 1.733
β of corn price and sugar prices showed mostly positive. This means that the price of corn and sugar have positive effect on gross profit of nearly all food companies observed, which means that the higher corn price and sugar prices will affect the food company’s gross profit increase. This may be explained by the results of Schnepf study (2009), which mentions the price of food and beverage consumer products with the term sticky price, in which food manufacturers will tend to quickly raise its product prices at current input prices (prices of agricultural commodities) rose, and will long lowered product prices when agricultural commodity prices fell. The coefficient
β corn prices only negative on the issuer DAVO (Davomas), while the coefficient β sugar prices is negative on issuer CEKA (Cahaya Kalbar), DAVO (Davomas) and PSDN (Prasidha).
But the results of the t test on the coefficient β
agricultural commodity prices largely showed no significant effect at the 5% significance level. This may be related to the purchasing strategies and procurement of raw materials of agricultural commodities in each of the observed food com-pany. Several food and beverage companies have implemented procedures hedging in the purchase of raw materials (agricultural commodities), such as futures and options contracts implementation of agricultural commodities through a broker.
The results of event study on fluctuating agricultural commodities prices
The calculation results of the average abnormal return (AAR) and cumulative average abnormal return (CAAR) in the first event (rising prices of agricultural commodities simultaneously) are shown in the following figures.
The calculation of CAAR seen that the rise in agricultural commodity prices simultaneously influence positive value of the cumulative abnormal return of food and beverage company’s stock price that are observed, and the trend of positive abnormal return prior to the event period
compared to the period after the event. The result of this calculation is in line with the results of the first regression to see the effect of the agricultural commodity price movements at a stock price of F&B companies, where there is a positive effect on agricultural commodity price movements on stock prices of food and beverage company in Indonesia.
Figure 3. Average AR in the event of increase agricultural commodity prices
Figure 4. Average CAR in the event of increase agricultural commodity prices
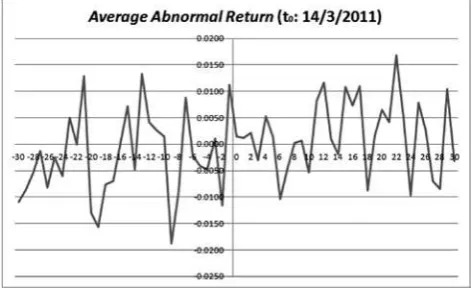
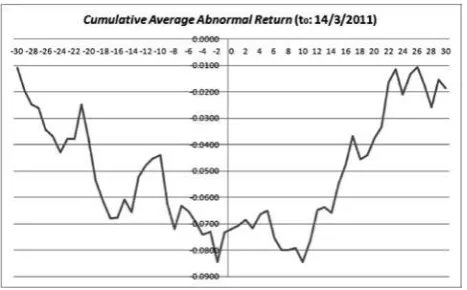
AAR and CAAR calculation results in the second event (drop in agricultural commodity prices simultaneously) are presented in Figure 5 and 6 above. CAAR calculation results in the second event is seen that the decline in agricultural commodity prices simultaneously influence negative value of the cumulative abnormal return of the stock price of food and beverage companies that are observed. Value of abnormal return before the event tend to show a negative value, while the value of abnormal returns after the event tend to be positive. The results of observations on which the second event is also in accordance with the results of the first regression, where there is a positive effect on agricultural commodity price movements on stock prices of food and beverage company in Indonesia.
The results of statistical t tests on the value of AAR in the first event, showed positive AAR values only within a period of two days before the event. But a statistical calculation shows that the result is not significant at the 5% significance level in the period around the event (t0). Several companies showed positive abnormal return value in the period before the event t-1, such as AISA (Tiga Pilar) 3.08%, MYOR (Mayora) 3.04%, PSDN (Prasidha) 9.09%, SIPD (Sierad) 3.51%, SMAR (SMART) 13.27%, and ULTJ (Ultra Jaya) 26.48%. But other issuers would indicate a negative value of the abnormal return in the period before the event t-1, such as
CEKA (Cahaya Kalbar) -4.00%, DAVO (Davomas) -11.75%, FAST (Fast Food/KFC) -17.16% and STTP (Siantar Top) -4.17%.
The results of statistical t tests on the value of CAAR in the first event, showed significant positive CAAR value at 5% significance level in the period around the event (t0). Even to t-25 before the event and t30 after the event, the positive value of CAAR is statistically significant on t test results. In the period before the event t-1, all issuers shows positive value of cumulative abnormal return unless the issuer DAVO (Davomas) that the CAR value is -24.24%. Some issuers shows that the CAR is very large, such as ULTJ (Ultra Jaya) 101.30%, SMAR (SMART) 68.15%, and CEKA (Cahaya Kalbar) 41.74%. This suggests that within a month, the event of simultaneously rise in agricultural commodity prices has affected abnormal return of ULTJ (Ultra Jaya) stock price to more than double of 101.30%, also indicated by the increase in the stock price ULTJ (Ultra Jaya) of Rp 730 per share on 26 August 2010 to Rp 3618.48 on 14 October 2010 (30 trading days).
The results of statistical t tests on the AAR value in the second event, showed the negative value of average abnormal return is only just before the event t-1 and t+2 after the event. But statistical test showed that the results are not significant at 5% significance level in the period around the event (t0). Most of the companies showed negative abnormal return value, but infact there are some companies that their abnormal return values are positive as DAVO (Davomas) 11.08% and FAST (Fast Food/KFC) 14.79%.
At statistical t test of CAAR value in the second event (drop in agricultural commodity prices simultaneously), showed negative and significant CAAR value at 5% significance level in the period around the event (t0). But the negative CAAR values indicate the results of statistical t tests only significant to t-10 before the event and t16 after the event, the significance of the effect is much Figure 6. Average CAR in the event of decline in agricultural
shorter than the effect of increase in agricultural commodity prices where influence the value of the positive CAAR longer. In this second event, almost all listed food company shows cumulative abnormal return value is negative, unless the issuer DAVO (Davomas) 13.51% and FAST (Fast Food/KFC) 4.44%. Lowest value of cumulative abnormal return is indicated by the issuer PTSP (Pioneerindo/CFC) -30.97%.
This event study results appears that simultaneous-ly increase and decrease in the price of agricultural commodities not significantly affect the value of the food company stock’s abnormal return. Increase in agricultural commodities turned out otherwise negative effect or no effect at all on the stock’s abnormal return of AISA (Tiga Pilar), CEKA (Cahaya Kalbar), DAVO (Davomas), DLTA (Delta Djakarta), FAST (Fast Food/KFC), INDF (Indofood), PSDN (Prasidha), PTSP (Pioneerindo/CFC), SKLT (Sekar Laut), STTP (Siantar Top) and ULTJ (Ultra Jaya). In the event of simultaneously decline in agricultural commodity prices should negatively affect the value of food company stock’s abnormal return, but it turns out there are some stocks that their AR positive values are DAVO (Davomas), INDF (Indofood), PSDN (Prasidha), SIPD (Sierad), SKLT (Sekar Laut) and ULTJ (Ultra Jaya). This is probably due to some of these stocks are relatively not very actively traded, so it is not too affected by the event. While the stock of Indofood effect turns negative, perhaps due to diversification of Indofood group business areas from upstream to downstream. For Ultra Jaya stock, effect of rising agricultural commodities against abnormal return is also negative, probably due to the increase of agricultural commodities occurs in soft commodities, oil and grain, while Ultra Jaya performance is more influenced by dairy commodities as inputs, so this does not affect investor sentiment. While the Davomas stock, it does look a trend which is inversely proportional to the price movements of agricultural commodities, as well as on the results of the regression of agricultural commodity prices with its stock price
and gross profit.
The second statistical test in this event study method is carried out on the effect of the event to cumulative abnormal return value of food companies stock. Both events either simultaneously increase or decrease in agricultural commodities price, looks significantly influence the CAR of food company, where the CAR value is positive in the event of simultaneously increase in agricultural commodities prices and vice versa negative when the decline in agricultural commodity prices. This is consistent with the results of a study presented by Schnepf (2009), which he calls the phenomenon sticky price at which retail food companies tend to maximize profits during periods of rising input prices of agricultural commodities by increasing retail selling prices immediately. But of all samples were observed, suggests Davomas stock as an exception. Davomas stock showed a negative CAR values when agricultural commodity price increases and positive CAR during the decline in agricultural commodity prices, this adds more to the fact that the movement of stock Davomas turned to other food company stocks. Stocks of other food companies, including the rarely traded stock, indicating that the direction of the CAR align with aggregate CAR value of food companies stocks.
MANAGERIAL IMPLICATIONS
Furthermore, based on these results, there are some suggestions that can be done by some parties to improve and follow-up the research results:
that are not listed on the Stock Exchange, the implementation of hedging techniques on purchase of agricultural commodities as inputs in the food and beverage industry in Indonesia.
2. Those investors can conduct an analysis of agricultural commodity price movements before making a decision to allocate funds invest in the stocks of agricultural industry sectors and food processing industry sectors. For investors who wish to trade stocks of agricultural sector (in particular sub-sectors food and beverage processing) on the Stock Exchange, we recommend to sell at the current prices of agricultural commodities were at highs and buying when the price of agricultural commodities at the lowest price level, of course to do more in-depth analysis of agricultural commodity prices which significantly affect the company’s stock price. 3. Those food and beverage processing
companies, could do a follow up on the strategy implementation of buying agricultural commodities, in order to be more integrated with the product sales strategy, associated with fluctuations in agricultural commodities price as inputs.
4. Those policy makers in government and in parliament, can perform analysis of world agricultural commodity price movements for any decisions related to the minimum pricing policy of the purchase to farmers or agricultural commodity imports, and its influence to the inflation rate in Indonesia.
CONCLUSION
Based on the data analysis and discussion that has been done, it can be taken some conclusions from this study are:
1. Agricultural commodity price movements affect stock price movements in food and beverage company listed in IDX. Dominant agricultural commodity prices affect stock prices in the food and beverage industry in IDX is corn and sugar. Price hike in corn and
sugar will be a positive influence on observed food company’s stock price increases.
2. Agricultural commodity price movements affect the gross profit of food and beverage company listed in IDX. Dominant agricultural commodity prices affect company’s gross profit is commodity prices of corn and palm oil, which positively influence. This explains the behavior of the food and beverage industry tend to quickly raise the price of the product at the time of input prices of agricultural commodities has increased, and will slowly lower the selling price when the price of inputs has decreased.
3. Statistics test results shows that the influence of agricultural commodity prices doesn’t have a significant effect only on PT Sierad Produce Tbk stock prices, because the dominant input of this company is poultry commodity, while observed agricultural commodities are other than poultry commodities. Influence commodity prices of wheat, cocoa and palm oil to the food company’s stock price largely insignificant, except in some issuers such as AISA (Tiga Pilar), PSDN (Prasidha), and SMAR (SMART) for wheat commodity, MYOR (Mayora), PTSP (Pioneerindo/CFC), SKLT (Sekar Laut), SMAR (SMART), and STTP (Siantar Top) for cocoa commodity, as ell as the PTSP (Pioneerindo/CFC) and SMAR (SMART) for palm oil commodity. This is probably due to some companies engaged in the food processing sector in addition to the downstream industry, they also move upstream (plantation of palm, cocoa, coffee, livestock), and some companies are also engaged in a wide range of food processing sub-sector. The increase in agricultural commodity prices has a positive effect on the food company’s gross profit increase, except cocoa price effect on gross profit issuers DAVO (Davomas) and palm oil prices on gross profit issuers PTSP (Pioneerindo/CFC) that otherwise negatively.
occurred simultaneously affect the positive value of average cumulative abnormal return (CAR) in the food and beverage company observed. Conversely, a decline in agricultural commodity prices that occurred simultaneously affect the negative value of the CAR in the food and beverage companies that
are observed. While the effect of simultaneously increases and decreases in agricultural commodities price is not visible significantly in average abnormal return (AR) in food and beverage companies that are observed.
R E F E R E N C E S
Belke, A., Gordon, I.G. and Volz, U. (2012). Effects of Global Liquidity on Commodity and Food Prices. World Development Journal.
Bluedorn, J., Duttagupta, R., Pescatori, A. and Snudden, S. (2012). World Economic Outlook: Growth Resuming, Danger Remain. Commodity Price Swings and Commodity Exporters. (Chapter 4, pp 125-169). International Monetary Fund. Bodie, Z., Kane, A. and Marcus, A.J. (2011). Investments and Portfolio Management. (9th ed.). New York: McGraw-Hill.
Browne, F., & Cronin, D. (2010). Commodity Prices, Money and Inflation. Journal of Economics and Business.
Cashin, P., McDermott, C.J. and Scott, A. (2002). Booms and Slumps in World Commodity Prices. Journal of Development Economics.
Conroy, P., & Narula, A. (2012). The Profit Margin Squeeze: Structural Strategies for Consumer Product Companies. Deloitte. Estrades, C., & Terra, M.I. (2012), Commodity Prices, Trade, and Poverty in Uruguay. Food Policy 37, pp 58-66.
Fabozzi, Frank (1999). Manajemen Investasi. Jilid 1. Salemba Empat, Jakarta.
Gubler, M., & Hertweck, M. (2013). Commodity Price Shocks and the Business Cycle: Structural Evidence for the U.S. Journal of International Money and Finance.
Grant Thornton International Business Report. (2011). Managing Through Uncertainty: Food and Beverage Industry in Transition.
Kumar, Pawan (2011). Indonesia Food & Agribusiness Outlook, Leading the Southeast Asian Growth Story. Utrecht: Rabobank International Food & Agribusiness Research and Advisory.
Lee, C. (2002). The Impact of Intermediate Input Price Changes on Food Prices: An Analysis of “From-the-Ground-Up” Effects.
Journal of Agribusiness.
Makin, A.J. (2013). Commodity Prices and Macroeconomy: An extended dependent economy approach. Journal of Asian Economics 24, pp 80-88.
Nazlioglu, S., & Soytas, U. (2011). Oil Price, Agricultural Commodity Prices, and the Dollar: A Panel Cointegration and Causality Analysis. Energy Economics Journal.
Pasaribu, R.B.F. (2008). Pengaruh Variabel Fundamental Terhadap Harga Saham Perusahaan Go Public di BEI. Jurnal Ekonomi dan Bisnis.
Paul, C. J. M., & MacDonald, J. M. (2000). Tracing the Effects of Agricultural Commodity Prices on Food Processing Costs.
Working Paper No. 00-032. Department of Agricultural and Resource Economics. University of California Davis. Ross, S. A., Westerfield, R.W. and Jaffe, J. (2010). Corporate Finance. (9th ed.). New York: McGraw-Hill.
Schluter, G., Lee, C. and LeBlanc, M. (1998). The Weakening Relationships Between Farm and Food Prices. American Journal of Agricultural Economics.