Learn to day-trade the E-mini S&P 500
Simple-as-123
I’ll Show You How to Day Trade
The E-Mini S&P in 60-90 Days…
Regardless of Market Direction!
Simple-as-123
#1 Knowledge:
You need to know what determines momentum.#2 Information:
You need timely, crucial information to help you determine when thatmomentum is the best time to make the trade, and when to get out in order to minimize your risk and maximize your profits.
#3 Belief:
You must have a belief in yourself that you can do it. It’s that belief in yourself that gets you to take action. You have to act on the first two ingredients (knowledge and information) in order to make this method work for you.Notes: Don't Ask Questions Now…Wait Till You Read This Manual First --I’ll explain what it all means as we go along in the manual!
New to the game?
If you are not an experienced day-trader, and don’t know the basics…please go to page 55
Know it all?
You might want to review the basics anyway…you just may learn something new!
Predicting the future is easy. It’s trying to figure out what’s going on now that’s hard
Table of Contents
Preface 4
Acknowledgements 5
Bio…Thought you’d never ask! 6
Introduction
How does it work 8
Knowledge 9
Information 10
Belief -- Discipline 11
Your Charts 13
Logging on to RealTime Charts 14 Loosen Up – US Stock Market Window 15 Keep a Diary if You Really Want to Learn 17
Short Hand 17
The Concept 19
Momentum 21
This is How I Do It 22
Preface
I had been trading for about five years, and had very little success with short or long term trading. I became fascinated with the idea of day trading. I was always looking for the Holy Grail and as we traders know, there is no such thing. We all spend way too much money for the hype that's out there, and with all the talk on the street about the money being made day-trading I started to look for a system or method to trade the S&P, but when I looked into the amount of margin you needed I quickly became disillusioned. I’m not in that league as it takes over $25,000.00 to trade one contract! I had heard of mini contracts and found you could trade the Emini S&P; it’s one-fifth the size of the big S&P; and is traded electronically on Globex with no need to talk over the phone to a broker. Well, it fit right into my style of trading. I guess I like the action, and I don't like all that research for trading long-term positions.
I started looking at charts and watching the news on CNBC everyday. I read everything on day trading that I could get my hands on. I think, because of all the stuff I had read about, such as fundamentals, technical analysis, and all those crazy indicators like RSI, Fibonacci numbers, Gann lines, Elliot waves, Stochastics, it would be just too difficult. Then I read an article written by one of my favorite teachers, Larry Williams and a co-author Miles Dunbar, they wrote an article for Futures Magazine, “Trading Strategies For the Future… The E-Mini Nasdaq 100” and in the article, he used an indices as an indicator, and in the same magazine article another writer used a different indices as an indicator. I said to myself…Self, why don’t you use both, as an indicator… the rest is history.
I did not have a losing trade for over a year when I first started, I was very conservative, and only went by what I perceived to be the perfect scenario to trade the E-mini. The method worked well during the big Bull Run in the late 90’s. You could not make a bad trade with this method if you tried! I kept trying to tweak it and find more days to trade it. I had quite a few friends and fellow traders wanting to try it so I began to teach the method during the most volatile time of the market. The method worked, but it took patience and discipline and a bigger drawdown.
I could write a whole chapter about trying all those crazy indicators. Man, all that stuff gave me brain cloud. I tried to put too much into it. I know now, after teaching students who knew nothing about trading, that they do much better than the experienced trader who has too much emotion and indicators to look at. This method is simple, and I will attempt to show you how simple it is in this manual. I will teach you just what you need to know, no more, and no less. Jake Bernstein said it takes ten years to develop a system or method ... we will see! As I write this we are in a bear market and it could be a whole new ballgame.
Remember the acronym "Kiss" ... Keep It Simple Stupid
Happy trading ... Simple-as-123Acknowledgments
To my wife Helen, the computer widow, who brought me my coffee each and every morning, and made sure I got the latest business news from the newspaper. For her patience, and love, I owe her a debt of gratitude. We could have been traveling all over the States, having a great time, but she never complained. Wow! … What a wife!
My daughter Renee, who took the time out of her busy day to help me proofread this manual, She holds down three jobs and has Ryan, her three-year-old son…who also tries to help me on the computer. When I’m trading, he likes to cheer me on. (I have to be very careful what I say…if you know what I mean.)
My soon to be son in law, Frank Giganti, who prods me on with his marketing insights and Sharon my second daughter, for all of her e-mail letters of encouragement and suggestions. She makes me laugh, and see the sunny side of life.
And to the rest of my family, Darlene my youngest daughter, her husband Greg and their two sons Joey, and Frankie, for their words of encouragement. And last but not least, my two sons Marshall and Michael who asked everyday, “What in the world are you doing up there dad?” I am so thankful for all of the traders who have touched my life with their opinion, suggestions, systems, methods, testimonials, and those who took the time to trade with me live, using the live charts on quote.com, and Yahoo! Messenger. It was a blast, guys! I really learned a lot about this method and myself with you on line.
A special thanks to Thom Huntington, who helped edit part of this manual.
Let’s not forget Lycos, Quote.com’s Live Charts, Yahoo, and paltalk for their great Messenger, and chat room software.
It's only when we truly know and understand that we don't know ... and had no way of knowing, that we know we have to find out what we don't know.
Thought you'd never ask!
Well it's been one hell of a ride! An adventure like a Tom Sawyer and Huckleberry Finn novel, and it's not over yet.
I was born in El Centro, California, about 100 miles east of San Diego, where my family moved when I was about seven years old. My dad had bought Acme Printing Co., one of the oldest printing firms here in San Diego, dating back to around 1905 or earlier.
After graduating from high school and volunteering for the draft, I was offered a chance to take my choice of any school the Army had to offer, so looking for the big bucks ($55.00 extra per month), I chose the Army Airborne. By the way, I don't recommend jumping out of a perfectly good airplane.
I went through jump school at Fort Campbell Kentucky, and was also given a chance to attend the Ranger School at Fort Benning, Georgia. That's what I get for being gung-ho, and fortunately for me, an armistice had been declared in the Korean War.
With my Honorable discharge from the Army in 1956, and the offer to pay me to go back to school, I was able to get my commercial pilot's license, and look for a job with the airlines here in San Diego. But no luck here; all of the pilots coming home from Korea got the jobs.
Joining my Father, I managed the family printing business. I met my lovely wife, got married, and had five children. I attended San Diego Junior College, and San Diego State College (it was not even a University in those days), taking classes in business and marketing. After my father's death, I owned Acme Printing Co. and other various business enterprises for over twenty years. I was very active in San Diego, joining various Civic organizations; San Diego Junior Chamber of Commerce, past chairman of the Aviation Committee, formed the San Diego Jaycee Flying Club, Past President of Harbor Lions, Flotilla 11, U.S. Coast Guard Power Squadron, Air Search and Rescue, Antique Air Craft Association, San Diego Aerospace Museum, and was a member of the San Diego Elks Lodge. Busy, busy, busy!
I started many various companies in the twenty years I was active in the printing business. Some of these businesses included American Traders Manufactures and Buyers (ATMAB - Anything To Make A Buck), Presto Prints of California, The Sand Box, Tattoos by Joyce, Joyce Enterprises Inc., M & J Marketing, Marshall Air, San Diego Sky Hawks Inc., and Typro Graphics.
I came out of retirement in 1986 after some bad investment decisions, and went to work as a manager of Paper Plus, a division of Unisource World Wide. I retired again after fourteen years in September 2000.
My many hobbies over the years include, backpacking, rebuilding antique aircraft, flying, boating, fishing, writing poetry, reading and watching Biography and the History channel, and last but not least, teaching day-trading.
Looking for additional income, I happened to receive a familiar mail order pamphlet in 1994. You know the one... how to get rich quick in the commodities and futures business.
I jumped right on in. Needless to say, I didn't get it. I kept looking for the Holy Grail! I read everything I could get my hands on, attending seminars and lectures on how to get rich. I spent a small fortune on books, systems, and methods by the likes of Ken Roberts, Jake Bernstein, Nick Van Nice, and our old favorite Larry Williams.
Nothing worked for me, except an education in the commodities and futures business. Still thinking that this is a possible way to make money at home, I read an article on day trading in Futures magazine. I tried paper trading some of the ideas presented in the article on the S&P; it just gave me brain cloud - way too much stuff to think about. In another article in Futures, Larry Williams and Miles Dunbar wrote about trading the Nasdaq 100 and looking at a divergence in the Dow. Another article in the same magazine written by Michael A. Mermer talked about using the Nasdaq 100 as a leading indicator for the S&P 500 futures and said it was a great day-trading vehicle. At first it did not really sink in until I started watching CNBC on television. They have those little arrows in a box showing the change in the Dow, Nasdaq, and S&P 500. A light went on for some reason and I started watching every morning, keeping my eye on the Dow and the Nasdaq. At first I was looking for the divergence, then I noticed that when both the Dow and Nasdaq were in sync, the S&P 500 followed.
Hey the rest is history!
Simple but not easy… fear and greed are your enemies; patience and discipline are your tools, practice is the only way to achieving your potential
Introduction
How does it work? … Simple-as-123
There are three indices that we look at after the market opens…and
through out the day, they tell me which way the E-mini S&P is
going. They are not indicators in the true sense of the word, but
that’s what I call them.
#1 The Dow #2 The Nasdaq #3 The S&P 500
Nuance: We don’t make a trade during the first half hour. (We let the market settle down and wait for the first reversal or momentum to build.) You will learn this by watching for the first thirty days or so; when to trade at the open or wait for an hour or two.
Please note the word
commodity
is used herein for the most part
interchangeably with the word
futures
. Futures contracts are now
traded on many goods and services that are not strictly commodities in
the traditional sense. The concepts, ideas, and descriptions in this
manual are applicable to futures whether the underlying “commodity”
is agricultural, financial, indices, industrial, foreign or domestic.
There is no scarcity of opportunity to make a living at what you love; there's only a scarcity of resolve to make it happen.
Wayne Dyer
Knowledge
c.) Books on the subject of trading futures:
Ken Roberts, Jake Bernstein, Larry Williams and Nick Van Nice (these were the guys who taught me the basics…and much more).
d.) Commodity Exchanges:
You may contact each exchange for a vast array of free publications regarding commodity trading, history, facts, and data…Most of the information for this manual was from their publications.
You should be familiar with trading futures. I have written the basic fundamentals of day trading here. Read it if you are not knowledgeable.
You can get all the knowledge you will ever need from the Commodity Exchanges, and your brokerage firm.
Things you must know:
• The Dow, Nasdaq, and the S&P (how it relates to this method.). • How to place your order. (We use Market orders.)
• Stop loss. (We use a mental stop loss.)
• The long and the short of it. (Buying and Selling.) • Risks. (Leverage, margin, too high, or too low.)
• Futures contract. (The calendar... The ES is every 4 quarters.) • Trading hours for the day session (Open, 9:30 – Close, 4:15 ET) • Open, high, low, and last. (Or price at the close.)
• Technical analysis. (You need to learn just a little bit.) • Price bar. (I prefer a 5-minute price bar.)
The way to get started is to quit talking and begin doing.
Information
How to get the information:
a.) Television on CNBC
or on your computer www.cnbc.com
b.) The Internet (your ISP):
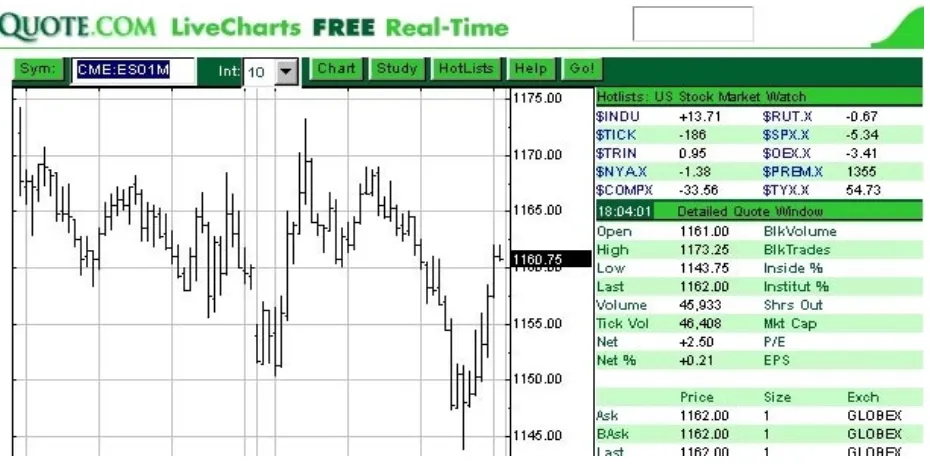
Go to www.quote.com See the chart illustration below.
Best seen on your computer, follow the instructions above the chart.
Instructions for live charts:
Use live charts, it’s on the home page’s menu bar and use the symbol ES01M. These letters and numbers represent the contract, year, and front month that are now being traded. This is for illustration purposes; the month and year you would actually use should be the current month, and year being traded.
Figure 1 Chart of the Emini S&P…June contract 2001.
You are searching for the magic key that will unlock the door to the source of power; and yet you have the key in your own hands and you may make use of it the moment you learn to control your thoughts.
Belief
• Self-discipline…Follow your strategy.
• Persistence…Stay in the game. Don’t quit after a few losses. • Consistency…Follow the plan on every trade.
• Self-Control…Fear and Greed. All psychological! • Knowledge…Understand how the market works.
Discipline:
a.) When in doubt stay out!
b.) Cut losses quickly. Winners always recognize when they are wrong and act accordingly. Losers rationalize and forget what they were really trying to accomplish.
c.) Learn from your mistakes. Have faith in what you’ve learned.
d.) KISS: keep it simple stupid. Do not try to learn about fundamentals. The only fundamental information I use is reports and Fed remarks that come out once in while. You can find these reports on CNBC and quote.com. Use very little technical analysis, and this method will be Simple-as-123!
e.) Attitude: Have confidence in your ability to act. Take responsibility for your own trades. f.) Study the psychology of trading. Learn how to deal with your emotions. You win some
and you lose some. But stay in the game, the next trade could be the big one that makes up for all those small losses. Ask yourself, “Am I psychologically and financially suited for day-trading?”
g.) Follow your plan. Write out your plan. The risk the reward, mental stop loss, exit target, and after you write it all down. Enter your order and proof read your order—twice. Twice I said!
h.) I am a day-trader! I am flat at the end of each day, no matter what. The most common mistake new and experienced traders make is holding losers. (Flat = HAVING no current market position.)
i.) Write on the blackboard 100 times—Discipline—
Discipline Discipline Discipline Discipline Discipline Discipline
Discipline Discipline Discipline Discipline Discipline Discipline
Discipline Discipline Discipline Discipline Discipline Discipline
Discipline Discipline Discipline Discipline Discipline Discipline
Discipline Discipline Discipline Discipline Discipline Discipline
Discipline Discipline Discipline Discipline Discipline Discipline
Discipline Discipline Discipline Discipline Discipline Discipline
Discipline Discipline Discipline Discipline Discipline Discipline
Discipline Discipline Discipline Discipline Discipline Discipline
Discipline Discipline Discipline Discipline Discipline Discipline
Discipline Discipline Discipline Discipline Discipline Discipline
Discipline Discipline Discipline Discipline Discipline Discipline
Discipline Discipline Discipline Discipline Discipline Discipline
Discipline Discipline Discipline Discipline Discipline Discipline
Discipline Discipline Discipline Discipline Discipline Discipline
Discipline Discipline Discipline Discipline Discipline Discipline
Discipline Discipline Discipline Discipline Discipline Discipline
To profit from good advice requires more wisdom than to give it.
Your Charts…
Use what you like, but please at least take a look at quote.com’s charts so you can see what I see to follow the method…after you see what I look at, then set up your platform to get the same information you need for this method.
Quote.com
These are the charts I use…I think they give you the best layout for my
method.
Take heed…quote.com is not very stable as I write this manual. I hope they will continue to improve and make it a more dependable platform.
My set-up
For my charts: I use 3 or * 4 charts on my screen.
1.) 5 min. ES chart with a 10 period moving average and volume indicator. 2.) 5 min. COMPX chart with a 10 period moving average indicator. 3.) 15 min. ES chart with a MACD indicator. I use the default settings.
* Once in while I will put up a 5 min. $INDU chart of the DOW using the 10 period moving average; it can bog down your computer if you don’t have a ton of Ram memory. The more memory you have for quote.com the more windows you can open up, but try to keep it simple.
I only use the default settings on quote.com indicators!
Logging On to RealTime Charts…
Go to www.quote.com
Click on log in, and follow the log in procedure. After you log on do the following:
Select “LiveCharts” from the menu bar.
(See illustration of the home page and also the chart)IMPORTANT Note:
These LiveCharts of the Emini S&P are only $9.95 per month plus exchange fees and are real-time.
It will support the following browsers:
Netscape 4.7 and above
Microsoft Internet Explorer 5.0, M.S.Outlook 5.0, and above
The LiveCharts applet is also supported on the following operating systems:
Windows 95/98 --Windows NT 4.0 and above, and Windows 2000. At the present time (Jan. 2002) they will not work on a Macintosh.
FAQ’s (Frequently asked Questions) on the quote.com live chart site. Read these it’s very, very important! It will explain most of the information in the different windows on the menu bar on the live chart.
A Little Trick
Most traders don’t know this little trick…just click on the window just below the clock, there is a colored bar that says Time, Price, Info, Exch., and Size, just click on the streaming data…You should now see a new window. This is my preference on my 15 minute ES chart! I can now see the Open, High, Low, and last, also the Price information…Ask, Best Ask, Last, Best Bid and Bid. And all that stuff in the upper window, which are the meat and potatoes for this method…all right in plain sight. Watch the Emini S&P stream in real time. For only $9.95 per month plus fees!
Ninety percent of those who fail are not actually defeated. They simply quit.
Loosen Up … I’ll Save You Some Time
On the right hand side of the chart…under the colored bar labeled…US Stock Market Watch…In the left hand part of the window is the following:
$INDU: It’s the Dow.
$TICK: It’s an indicator - number of stocks trading on up-ticks minus number of stocks trading on down ticks. It’s used to show strength or weakness in the market. If more stock trades occur on up-ticks…that is, at a price higher than the previous trade…than on downticks, the market is showing strength, which can be measured by the combined numbers. Values over +200 or so are bullish and –200 are bearish.
$TRIN: In general, if the result is greater than 1.10, the indicator is bearish. A value of 0.90 or less is considered bullish.
I like to see the TICK and the TRIN both going my way when I’m making a trade. Better safe than sorry!
$NYA.X: It’s the New York Stock Exchange.
$COMPX: It's the Nasdaq.
In the right hand part of the window: $RUT.X: It’s the Russell index.
$SPX.X: It’s the cash S&P 500 Index (the big S&P)
$OEX.X: It’s the commodity Index
$PREM.X: It’s the real-time difference between the active S&P futures contract and the index. They calculate this and send it out real-time.
VOLUME:
I use a simple moving average indicator on quote.com on my 5 minute ES chart; they also have a moving average and volume indicator…try it maybe it will just give you a clue when volume is effecting the market.
Be sure to watch the volume of the market carefully at price extremes. Declining volume usually means the market is not accepting these higher or lower prices and could indicate a turn. A market that is topping or bottoming out does not spend much time at the extremes, so there will be little volume at these points. I cannot stress the importance of daily volume enough. When volume is very low...you may get poor fills.
We want VOLUME!
REMEMBER:
Let the market determine the trend, and trade with the trend by buying on the way up or selling on the way down.
Patience is power. Patience is not an absence of action; it is "timing"; it waits on the right time to act, for the right principles and in the right way.
Keep A Diary If you really want to learn…
Make screen shots of your trades or print them out if your software has that feature. While paper trading, make screen shots of the chart and use the short hand below on computer post-it-notes, too show where the Dow and Nasdaq were, when you decided to make the trade.
To really learn this method in 90 days, take screen shots of the chart every 15 minutes; from the open up to 12:30 eastern time. It sounds like a lot of work but it’s simple; it will also keep you focused, and you will have an accurate record of where the Dow, Nasdaq, and Emini S&P over the course of the day. Now you can go back and look at your notes and see what really took place in that time frame.
It’s the best teacher and it’s free! If you have the patience, take all 28 shots for the day…or use my Trade Log and Time Zone and just write the information down every 15 minutes.
Learn this simple short hand to keep your Diary up-to date:
•
Dow
d
•
Nasdaq
n
•
Emini S&P
es
•
Up
+ or up
•
Down
- or dn
•
Channel
Ch
•
Powertrade
pt
•
Sideways (chop)
sw
•
Momentum
mom
•
Number of contracts
> 1
•
By the way
btw
•
Double top or bottom DT or DB
•
Triple top or bottom TT or TB
This is how it should look:
7:30
8:30
d+25
d+45
n+15
n+30
Interpretation of the shorthand; it should work like this:
At 7:30 the Dow was 25 points up and the Nasdaq was up 15 points, the Emini S&P was at 1330.00 and I bought 2 contracts. --- At 8:30 the Dow was 45 points up and the Nasdaq was up 30 points and I sold both contracts at 1334.00
Note:
You need to make those screen shots at the open and then every 15 minutes. It’s important! That way you can study what took place and see where you were when you decided to make the trade. Or you may see something unusual. Jot down a note and learn from it.
(Show a sample chart and note)
This is a reminder…just do it!
The minute you make the trade, make a screen shot of the chart and
your order. Your trading software may have this feature to print built
into the program.
Now you have a record just in case your brokerage firm posts an
error on your statement.
Luck is being prepared for the opportunity when it comes.
No matter what happens, keep on beginning and failing. Each time you fail, start all over again, and you will grow stronger until you find that you have accomplished a purpose…not the one you began with perhaps, but one you will be glad to remember.
The concept
…
when the Dow, Nasdaq and the Emini S&P 500 are all trending up or down, (otherwise known as synchronized) it can signal a time to make a trade. Waiting for the three to become synchronized can take awhile, so just be patient. What I am looking for ismomentum. It may take an hour or so. The idea is if the DOW and the Nasdaq are both going up, the E-miniS&P 500 will follow. That’s really all there is to it.
Here is something that is hard for most newbies (new traders) to understand, regarding in sync…if the Dow is up 50 points and the Nasdaq is down 25 points, and all of a sudden the Dow loses 25 points, that is momentum, and is really in sync with the Nasdaq. Having just lost 25 points, the numbers don’t have to match, just be moving in the same direction. One of my favorite starting points is to have the Dow trading at +25 and the Nasdaq at +15, and to have both moving in the same direction…with momentum.
What do I mean by momentum? When a market is moving quite a few points in just a few minutes that’s momentum. You will get the gist of it after watching the market for a few days. Try to pick a time when you would make the trade. See how you did after you made the decision to trade. Watch out for the nuances and the Time Zones at the end of this example.
I can’t emphasize how important it is to keep a diary on how you decided to make this trade. Use the short hand and write down at what point each of the three indicators were when you decided to make the trade. This will help you review your entry points after you have traded for a while. How long did you hold it and at what point did you decide to get out? I print out a copy of the order activity sheet from my broker after I make the trade and I jot down a few notes to indicate why I made and why I got out of the trade. The most important notes should be why you lost. Figure it out and write it down.
Let’s look at an example. The Dow is trading at 10500 and is up 50 points from the day before. The Nasdaq is up 25 points and the S&P is trading around 6 points or higher. All trending up or they can all be trending down. It's time to make a decision…let’s go for it! (For those of you who don’t watch the market or who do not know what I mean by up or down from the day before, or don’t know what a point is…I will explain this in the back of this manual. See the index for any questions you might have.)
(Note—Watch out for all of the time zones to be avoided? listed in chapter two.) Ok, ok! Each point of the E-Mini S&P is worth fifty bucks.
you have to lose $150.00 (3 points). Risk more if the bars are longer than 3 points. The point is you have to give this trade some room. You will learn when to pull the plug.
I like to make at least $200.00 dollars a day (4 points). The market needs to move up or down 4 points, using just one contract. Buy four contracts and take home $800.00. If I see the Dow, the Nasdaq, and the S&P still trending up or down in the same direction as my trade, I’ll let it ride. (See chart illustration 2.1) If the Dow starts trending too much in the opposite direction of my trade, and even though all of the indicators are in my favor (Called a pullback), I might make a decision to take my profits now. If I have two contracts I might sell one and let the other one ride. You’ll get the hang of it after you paper trade this method for two or three months.
There are days when all three indicators will not synchronize and you can’t make a trade, and there are days when the market will go against you. Try to take small losses and the big trades will come. Work with this method for a month or two and you will see what I mean. If you like to make high risk trades, I will teach you how to be an aggressive trader.
So why do we as future traders, care so much about the Dow, the Nasdaq and the S&P 500? … Because they are great leading indicators of the E-Mini S&P!
It is better to look ahead and prepare than to look back and regret.
Momentum
As defined in the dictionary:1. Symbol p Physics. A measure of the motion of a body equal to the product of its mass and velocity. Also called linear momentum.
2. An impetus of a physical object in motion. b. Impetus of a nonphysical process, such as an idea or a course of events: The soaring rise in interest rates finally appears to be losing momentum.
3. Philosophy. An essential or constituent element; a moment.
Pretty much covers it! … Huh?
This is what I mean about momentum!
The measure of the motion and movement of the indicators we are looking at; that we use to make a trade…Dow, Nasdaq, and Emini S&P.
This is the most difficult part of this method to understand, and it’s also very subjective. I cannot make it mechanical, as you will see when you start to paper trade.
I will try to cover how we use momentum in an example later in another chapter. Learning this skill is paramount to making the trade low risk. So pay close attention when we cover this subject. It’s the key to success! Takes lot’s of practice…you will see it for yourself.
Right now a moment of time is passing by! We must become that moment.
This is how I do it…
I have my computer all set up to make a trade with the software on the web site from my brokerage firm. It’s really quite simple! I watch CNBC for the morning news, CNBC also sends me an email after the market closes, called Money Wizard, (CNBC at cnbc.com and get Money Wizard at http://www.cnbc.com it has most of the market news, and it warns me of any reports that are coming out. I also read quote.com’s home page for their point of view. Then I click on live charts of the Emini S&P on quote.com. (I use the “All sessions” in the chart type) and look to see what the night traders were up too.
At the open of trading which is 9:30 EST I look to see if I can trade the open…maybe a gap trade or I see the Dow and Nasdaq in sync and moving like a rocket. If not, then I wait for the first half hour and look for the first reversal, or just let the market settle down. You can just read the paper, and have a cup of coffee, watch CNBC, and keep your eye on the three indicators on the lower right hand side of the TV screen. When you see the Dow and Nasdaq get in sync and you think you may have an opportunity to make a trade, then go look at the chart on your computer screen and prepare your order. Just remember the concept…Simple-as-123!
(Use a piece of artwork to show what it really looks like).
Figure 2 CNBC’s illustration showing the change in points from the day before.
Nothing stops the man who desires to achieve. Every obstacle is simply a course to develop his achievement muscle. It’s a strengthening of his powers of accomplishment.
Eric Butterworth Clergyman Dow ^
Trade Log with Time Zone
Make an Excel Form or whatever spreadsheet programs you use
of the file on page 24.
I will send you a pdf or the Excel file on request.
E-mail me at:
[email protected]
Or try my web site:
www.simple-as-123.com
Charts will go on this page
Habit is habit, and not to be flung out of the window by any man, but coaxed down stairs a step at a time.
Charts go here
Almost means not quite. Not quite means not right. Not right means wrong. Wrong means the opportunity to start again and get it right.
Globex
Commodity Traders Discussion Forum
E-mini trading, General comments
Gunter Kaiserauer posted this article on the Commodity Café (A trading forum I frequent after trading hours.) Thursday, 23 March 2000. Gunter is a broker, CTA, Educator, and is active on many trading forums. ([email protected])
“We often read comments about which brokerage house gives the better or worse fills, and slower or faster executions on e-mini contacts.
A few words of explanation:
E-mini contracts are traded on an electronic exchange. Once an order is entered into the Globex computer, only the computer decides how the transaction is being handled, and what fill you are going to get. There are no differences between having your account with one firm or another. In that respect, all brokerage firms are equal.
The computer processes the orders in the chronological sequence they were entered. Your fill should come back within 2-4 seconds, on a normal business day.
However, there are differences in other areas:
As far as “stops” are concerned, the Globex allows only “stop-limit” orders, not regular “stop” orders. To facilitate regular “stop” orders, another CME computer is used which stores your stop order and monitors the e-mini price. When your stop price is triggered, it converts our stop order into a market order. (Even though this process is done electronically, there is a tiny time delay involved in doing this).
Again, once your stop order has been entered into this system, your brokerage house is not any better or worse than another brokerage house. However not all brokerage firms are approved for this set-up. Those brokerage firms, who are not approved, use a clerk in their own offices to monitor prices and convert your stop order manually. Needless to say, this takes a bit longer than a completely electronic process.
Somebody made the comments today, that e-mini trading presents no risk to the brokerage firm. This, of course, is not true. A day-trader can wipe out his account in a matter of a few hours, if he is left to trade unsupervised.
Some firms (especially the ones that let small accounts trade online) control this risk by having a clerk intercept each online order and check it against account equity and the day’s earlier trading activity. Obviously, this takes away one of the main attractions of e-mini trading: speed.
Finally, there is the quality of the software. Not all online software works smoothly and efficiently. I have heard some horror stories to that respect, and we took in some ‘refugees’ from other firms, even though the other firm offered lower commissions.
Slippage on the e-mini S&P is generally less than on the big S&P. Although, from time to time the e-mini gets into an area void of resting orders. This can result in unusual distortions and unexpected slippage. The worst such case was a year, or so, ago, when Greenspan made an unexpected announcement which rattled the markets. Slippage on stop orders in the big S&P, on that day was in the neighborhood of 1200 points, whereas slippage in the e-mini was 3200 points.
The worst problem with e-mini trading is this: you don’t have a broker any more who you can blame for bad fills. That leaves only one guy to blame for your losses: yourself! For some traders, this can be a devastating experience.”
Gunter Kaiserauer Broker, CTA, Educator
There is only one group of people who don’t have problems and the’re all dead. Problems are a sign of life. So the more problems you have, the more alive you are.
Building A Trading Strategy…
Your Plan
Requires using technical analysis, fundamental analysis (very little) and some select indicators, e.g. the Dow, Nasdaq and the S&P 500. I call these indices indicators because we use them to find momentum to make the trade on the Emini S&P. The important factor is how to define the risk and the reward. After watching the TV for a few weeks you should have come to a conclusion of how far up or down the S&P can go in a day. If it has moved too far too fast at the open…the risk is too great for the reward. (See illustration 3.1) If it’s too far down, it probably won’t give you enough reward to pay for the commission and charges. It has to have room to move past resistance or below support to move any further up or down. Some other technical indicators I use are the MACD crossover, volume, gaps, and watching the trend line. The fundamental indicators might be some major news, i.e. Alan Greenspan! Fed reports about interest rates, reports on employment, gross national product, and consumer price index reports, just to name a few.
Understand why and how to use market commentary. Stay out of the market till the dust settles. Use the calendar to find out when these reports are due out, unless you want to become a gambler! Ask your broker about any market news, and what time they are going to be reported.
But be ready…if it’s good news it should trend up…if it’s bad news it probably will move down.
Hey we're not building a house here ya know! Hypothesize!
Choose some indicators you think may be potentially indicative of the market. By the way, the market may move very fast and then turn around and head back the other way. Look for an opportunity to get in. If this news is at the end of regular trading hours you better watch out at the open tomorrow, or the next trading day. Look for a gap move, or trade long on a day before any major holiday! It works most of time! Some people say that if the public thinks it will go up, it goes down and vice-a-versa…be a contrarian.
Choose a target price for an exit like 2 or 3 points, and a stop loss figure (I use 2 points for a stop loss, or look at the trading range to make my decision.). Don’t try to get every penny out of the market; it will just cost you money. You can’t pick tops and bottoms or we would all be rich. FOLLOW YOUR PLAN!
"The wise trader never ceases to study general conditions, to keep track of developments everywhere that are likely to affect or influence the course of the various markets."
Hey … It’s all in a day’s work!
Let’s look at my typical trading day…
This is my checklist …First thing’s first
My wife brings me my coffee…I take a look at the news on CNBC and I also look at the news column on quote.com just to see if there are any Fed or important reports out today. I read the business section from the newspaper if I get up early enough…Not likely!
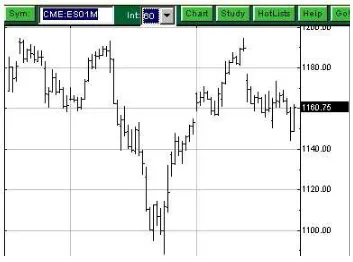
I leave my computer on twenty-four hours a day except on weekends (We have an energy crises here in San Diego so I now turn it off.) I keep my live charts running the E-mini S&P, using all sessions.
(See example of a live chart using all sessions.)
I get up around a half-hour before the opening bell. (9:00 o’clock Eastern time.) Which is early enough to see what the night traders were up-to. I look to see if there might be a gap up or down at the open and which way the trend is going. It could be up, down, or sideways. I am also interested in the location of the position within the trend. Is it at resistance, support, or in the middle somewhere from the day before?
Gaps? I only consider large gaps…4 to 6 points or better. If the market gaps lower on the opening it soon rises to fill the gap. I have an opportunity to buy at the open.
Here is a simple rule, we need one of our indicators to be on our side of the trade, and both are even better, and buy as the market rises to fill the gap, or sell the gap and wait for the downtrend to end. Try to capture 1 or 2 points. Don’t get greedy. Look to see if you can keep the trade going by keeping your eye on the Dow or Nasdaq. The minute you see a sign of weakness, get out of the trade. I use Stochastics, and wait for it to form a hook…you look at it, and you will see it i’m sure.
"The trend is your friend. It is - unless the trend is about to end."
Major holidays? The market usually is an up day before a major holiday. Follow the trend and sit back and wait. This may be the time to trade during the last hour. It takes practice though! Always have an exit planned.
Major news…that might affect the market? I take advantage of any big event. If it’s good news, buy…bad news sell. Prepare to exit and take the trade the other way also. It always changes direction after a few minutes…Usually!!!
CNBC…check my three indicators, the Dow, Nasdaq and S&P. Are they in sync? Any volatility; or volume problems?
Opening bell: one decision every day-trader has to make is whether or not to trade on the opening. The market seeks to establish a trend or stable price level during the first half hour or so. I let the dust settle, then look for my first opportunity to make a trade.If any of the above information is going to affect the market, I take it into consideration at the open, rather than wait the first hour or two. Use the Time zones and look for reversals, after the first half hour or so.
So what do we do? Anything…Something. So long as we just don’t sit there. If we screw up, start over. Try something else. If we wait until we’ve satisfied all the uncertainties, it may be too late.
Here are a few typical trades
12/17/99
Gap up at the open…Sold 2 contracts at 11:36 a.m. on a turn down at 1445.75 and had to wait until 2:50 p.m. to fill the gap at 1439.25 for a profit of $650.00 less commission. This was a tough trade and I had to go through a higher risk just to make the trade payoff. I let my emotions get the best of me but I was lucky I did not lose any money.
12/30/99
Gap up at the open…I missed the ride down to fill the gap, but bought 2 contracts at 11:58 a.m. at 1483.00 after it filled the gap. I took profits at 1488.75 as it looked like it was at resistance. Later in the day…1:44 p.m. I bought 2 contracts at support 1481.00 and exited at 2:13 p.m. at 1483.50, which looked like an easy $200.00. It was just a simple trend move at support and should move back up to resistance. Simple-as-123—Total profits for the day $825.00 less commission.
You need to keep your eye on the Dow and watch for any fast reversals, as that tends to affect the S&P. Do not, I repeat, do not trade gaps before any major holiday unless it is a gap down. When it gaps down, you buy when the bar penetrates the gap. Remember! Look at the risk-to-reward ratio. Plan your exit around those numbers. If the trade goes against you, get out as soon as possible. Give the S&P lots of room, at least $150.00 or use the trading range of each bar. Gaps, gaps, gaps…If you look at an Intra-day bar chart, you will notice that on gap openings the market often trades away from the gap for the first few minutes, then quickly reverses and "fills" the gap. For example, a market that gaps lower initially may trend downward, leading everyone to believe that a downtrend is in effect. After ten minutes or so, however, the price shoots to the upside, closes the gap and reverses again. Trading lower on the day. This scenario presents two options. You could buy the opening and then sell when the market rises back to the gap, or sell as the price fills the gap, expecting the downtrend to resume. If the opening gap is not filled within five or ten minutes, there is a strong possibility the early trend may be the dominant trend of the day. Remember, small gaps don’t work well. I only trade gaps when I have either the Dow or the Nasdaq going my way.
My personal preferences for day trading…Reversals and
Buying dips and selling rallies. …
But be careful of the time zones
!
Scalper – A trader who trades for small, short-term profits during the
course of the trading session, rarely carrying a position overnight.
If it starts to go the other way (I only risk 2 points) you would exit when you see your mental stop loss. Don’t let little pullbacks scare you though. You’ll get the hang of it. Keep your eye on the total market and check the TRIN, TICK, and make sure the NY Stock Exchange and the Russell Index is on your side of the trade. Check the MACD or Stochastics. They are all right there in front of you, and it only takes four seconds to check them out…remember your risk point…and always remember at around the lunch hour time zone we get what I call the 12 o’clock hop or flop. If the market is up it will move down, and if it’s down it will move up. It can last up to a few minutes or well over an hour and half. The commercials or brokers come back from lunch and they move the market further up or down. Be alert from 11:15 till 2:15. One other warning: try to get out of the market an hour before the close around 3:15 p.m. The probabilities of a successful trade diminish in these time frames due to the impulsive and reckless buying and selling by institutions just because they didn’t get their trading done earlier.
Nuance
We always trade with the trend of the total market, what I mean by that is … If the Dow, Nasdaq, Russell, NY, TICK, TRIN and Emini S&P are bullish we only trade to the upside, and vise-a-versa. Never trade against the total trend. There is no exception to this rule. Be patient and use discipline. We never sell rallies at resistance (rallies are when the trend is at support and starts to move up towards resistance) unless the total market is in a downtrend. And vice a versa! Another safe practice is to avoid trading when the market is making the new high or low of the day unless other indicators are in your favor.
Power trading…
Being aggressive
You will learn what Power trading is all about, it’s when we are trading, and the indicators are not in sync with one another. That is “Power trading.” It’s when we trade at the open, reversals, or during the 12 o’clock hop, or during the close. That is Power trading…Just remember it’s very risky! Probably the most risky trades you will ever make will be when you trade against the trend.
If you see the Dow or the Nasdaq out of sync (Not going in the same direction at the same time.) as an example using my shorthand:
getting into sync or at least it’s moving down, like the Nasdaq. If we keep seeing this movement then we have an opportunity to make a trade. We could sell one or two contracts and look for 2 or 3 points. It’s a little risky and I would give the trade a small risk of only 2 points. If you see any movement to the contrary then you would get out and hope for the best. It takes practice to trade when they are out of sync or when you are trading the 12 o’clock hop.
Knowing that the market moves up if it’s down during that time frame, you could wait for the market to make a double bottom or just make the turn. Take a high risk and trade the other way even if they are in sync. Once again use a small risk of only 2 points. This trade is very subjective. And takes lots of practice.
Only those who have to do simple things perfectly… will acquire the skill to do difficult things easily.
Computer Requirements
#1 Computer:
System requirements:
Pentium II or faster, Windows 95/98/NT, or higher, or Apple Macintosh II CI (Power PC is better). System 8.6 or greater. 64 megs of ram, (128 megs is better). Color/VGA Monitor with minimum screen size 800x600 (1020x768 recommended), 56k Baud Modem, (Cable or DSL is better). Netscape Navigator 4.7 or Microsoft Internet Explorer 5.0 or greater (as new technology emerges, computer requirements are sure to change.). Check with your brokerage firm.
#2 ISP: (Internet service provider)
I don’t recommend AOL…any service provider will do as long as you are happy with their service. I have had a lot of students recommend Earthlink.net (Cable or DSL is by far the best.).
#3 Broker:
Open an online trading account. I recommend a minimum $5000.00. You can trade two or more contracts, (depending on your brokerage firm) of the E-Mini S&P
Most brokerage firms usually require at least this much, but you may find one that will let you open an account with only $1000.00, such as www.proedgeonline.com (See the list of brokers I recommend in the back of the manual.)
#4 Software:
Your brokerage firm will have the necessary software to place your orders, and for your live charts I recommend quote.com…and it’s only $9.95 per month plus fees. They are a little un-stable as of to-date…I love the look and feel of them though, and I’ve been using them through thick and thin.
Patience is to keep trying…to keep trying till you get it. Discipline is knowing you get it…and the patience to make it happen.
Don’t Blame Me…
Putting Time on Your side
By Barry and Ryan Watkins Trading is not just a question of what the indicators are telling you, it also depends on timing. Here’s a breakdown of the most opportune trading periods throughout the day.
Trading isn’t just a matter of what; it’s a matter of when. Your analysis can lead you to what may turn out to be a correct assumption of the market’s direction But if you enter your trade too early or too late, your research won’t do much good.
The stock market makes several pauses or reversals every day. Identifying likely market reversal time zones is critical to maximizing profits for short-term traders. The ebb and flow of trading throughout the day is influenced by a number of factors, including the supply and demand situation before the open, when traders typically take lunch and the need for many traders to square away positions by the end of the day.
Because no two trading day are ever exactly the same, trading time zones are general guidelines … not rigid rules. When combined with other analysis tools, they can give you a better idea of when a trade may or may not be a good idea.
In the zone
On a normal trading day, the stock market is open 6.5 hours, or 390 minutes. The trading session can be divided into approximately 14 time periods, or zones. Each of these zones can be classified according to the colors of a traffic signal.
The red zones: These are the most dangerous times of the day to trade. There are two red-zone trading periods, which comprise a total of 200 minutes, or 51 percent, of the typical trading day.
For experienced traders, the first 20 to 30 minutes of the trading session can be a very profitable time, but for less experienced traders, it probably is the most dangerous period of the day.
The yellow zones: These six time zones represent typical (and approximate) times when the market pauses or reverses. These periods account for about 14 percent of the trading day.
Watching the clock
To illustrate the 14 time zones, we’ll walk through a typical trading day. But first, it’s important to remember there is no such thing as a risk-free trade. To generate a profit, the market must be moving, which also increases the risk. The largest profits usually occur during the most dangerous (volatile) times. Therefore, a market environment that is marked as red and dangerous for might be another trader’s dream market. It depends on your level of expertise and trading style. Figures 1 through 3 provide chart illustrations of the various zones.
Period 1: 9:30 to 9:50 a.m. EST (red zone)
The abundance of pre-market orders essentially gives the market makers and specialists “inside information” about the expected supply and demand in stock…and extreme advantage. To make the most of supply and demand imbalances, the market makers and specialists often open the stock much lower or higher, creating extremely large price gaps.
This might entice less-experienced traders to chase the stock. However, they often put on a trade only to watch the stock move against them shortly thereafter when the forces behind the early imbalance have disappeared. Depending on the volume it usually takes about 20 minutes for the market makers and specialists to fill the pre-market orders and make the most of those traders who were lured into the trap. After this period, more realistic prices should emerge.
back and the market maker or specialist (who shorted the stock at the inflated high price} will buy the shares back at a profit.
Period 2 9:50 to 10:10 a.m. (yellow zone)
Many of the bigger stocks (as well as the S&P 500 futures contract) often reverse around this time. Because all the opening orders have now been filled, more realistic prices based on immediate supply and demand are likely to emerge. If the stock isn’t extraordinarily strong, this can be a very profitable time of the day because the initial rally sets up the possibility of a short trade.
Usually, the longer it takes for the first reversal to occur, the more pre-market orders there were. The market remains stable throughout this period it usually also remains stable until the next yellow period (period 4).
Period 3: 10:10 to 10:25 a.m. (green zone)
The first green trading zone can start during the first yellow zone as prices have reversed and can stretch into the second yellow zone, which is the next likely reversal zone.
This zone is usually one of the safest periods to trade and will generally go in the opposite direction of period 1. For example, if a stock trades higher in period 1 it often reverses during period 2 and continues down during period 3, if prices move lower in period 3 the end of this period presents and opportunity to enter a low-risk long trade.
Period 4: 10:25 to 10:30 a.m. (yellow zone)
This zone often marks a pause in a strong market, but a full reversal can sometimes occur, going against what initially seemed to be a good long position. Reverse the reasoning if the market reaches this zone on lower prices. If you’re trading short-term, you should consider closing your position before the market enters this zone (but be ready to re-enter once it is over). If you’re trading longer-term, use stop-loss orders to protect your positions.
Period 5: 10:30 to 11:15 a.m. (green zone)
The Red Zone
Period 6: 11:15 to 2:15 p.m. (red zone)
Most traders likely would eliminate 50 percent of their bad trades if they refrained from trading during the midday doldrums.
This time zone is often referred to as the “midday doldrums” because activity dips when traders take their lunch breaks. On an up-trending day, you will often notice that prices start to sag, like air slowly leaking out of a tire. During this period prices show the least amount of follow-through because of the lack of volume.
Most traders likely would eliminate 50 percent of their bad trades if they refrained from trading midday. Instead they should monitor this period for price patterns that can act as setups for trades later in the day. For example, the lowest price before an afternoon breakdown often occurs between 1:30 and 2 p.m. EST. While this may or may not have any consequences for your trading later in the day, it still could be a good idea to mark it off, as an indication the market is behaving as it “should” Note that this time period is counted as one zone, although technically it is divided into two parts by a short yellow period (see below).
Period 7: 1:25 to 1:35 p.m. (yellow zone)
This is the weakest and least significant of the six reversal periods because it typically occurs in the middle of the midday doldrums. Volume can drop dramatically during this period; professional traders normally avoid it.
Period 8: 2:15 to 3:00 p.m. (green zone)
After the midday doldrums, this green time zone commences and continues until 3 p.m. EST when the Chicago bond market closes, This period can be very exciting to trade because it is often like a new trading day. Patterns that started to form during the lunch hours now find support from broader volume, resulting in frequent breakouts in both directions.
Period 9: 3 to 3:10 p.m. (yellow zone)
This reversal period coincides with the close of the Chicago bond market. Pay close attention during this time period reversals are common and often significant.
Reversals are often significant in the period after the close of the Chicago bond market.
Period 10: 3:10 to 3:25 p.m. (green zone)
A short period of relative calm between two significant reversal periods.
Period 11: 3:25 to 3:30 p.m. (yellow zone)
Like period 9, this reversal period is another high-probability reversal zone.
Period 12: 3:30 to 3:40 p.m. (green zone)
Another period of relative calm before the last reversal period of the day.
Period 13: 3:40 to 3:45 p.m. (yellow zone)
A major reason for this final reversal period of the day is many market makers and specialists settle their accounts for the day. Many day traders also exit their trades.
Period 14: 3:45 to 4 p.m. (green zone)
Quite often, the last 15 minutes of the day resemble period 10 (3:10 to 3:25 p.m.). Also, if the day was characterized by selling pressure, an upward hook in prices sometimes occurs right before the close {caused by increased buy-in to cover short positions).
Maintain perspective
These time zones were originally designed to indicate a high-probability reversal periods for the S&P 500 futures market, but they can be applied to individual stocks as well.
Snake-Eye Trading Method
This method applies the same techniques used by the professional Floor Traders and is based around what a 5 minute bar is indicating at any given time. It is a simple, yet very effective method of trading that does not rely on complicated, technical methodology or indicators.
Neither does it rely on or care what happened last month, last week, yesterday, or earlier today, but rather what is happening at this very moment with the current 5 min bar.
Determine this and trade accordingly
What are the professional Floor Traders doing right now?
What direction are they steering the market?
Where does the market want to go?
This trading method applies equally as well to both the S&P 500 and
the E-Mini S&P 500.
Chart Set Up
Set up and refer to these three charts only, no others:
Emini S&P…5 minute bar chart:
Set with a 8 period simple moving average set at “low” and 10 period simple moving average set “high” – configured with bars. This is the main chart used to look for trade set-ups.
Nasdaq (Compx) 5-minute candle chart:
Set with a 5 period simple moving average configured with candles. This chart is used to confirm a trade set-up only, and is not to trade from.
Emini S&P 15 minute bar chart
Dow
Refer to this index to observe changes in market direction.
(If you are using quote.com’s live charts, this index is in the Hotlists window in the upper left hand side ($INDU)).
For example, if the Dow is up 100 points, indicating the market is very strong to the upside, you should only be trading long positions (only trade in the direction of the trend). However, take care to regularly observe for reverse movement in the Dow index, in case it suddenly loses 30-40 points, indicating a weakening Dow and possible reversal in trend. This could now be signaling it would be safer to trade short than long (refer to the Time Zones for possible reversals periods).
Moving Averages
These are used to assist with determining the strength, weakness or neutrality of the market and which direction to play it.
When the price is trading above the 10 moving average line on the 5- minute chart, with at least one full price bar having closed above and sitting on top of the line, this indicates strength, signaling potential upside and possibly a long trade forming.
When the price is trading below the 8 moving average line on the 5- minute chart, with at least one full price bar having closed below and fully formed below the line, this indicates weakness, signaling potential downside and possibly a short trade forming.
Whenever the price bars trade above the 10 moving average line or below the 8 moving average line on the 1minute chart, this is a stronger confirmation of direction than when on the 5-minute chart.
Similarly, a complete green candle (white on quote.com’s charts) having fully closed above and sitting on top of the 5 moving average line on the Nasdaq ($COMPX) index, indicates strength, signaling potential upside. Conversely a red candle having closed below and fully formed below the 5 moving average line indicates weakness and potential downside. A closed green candle (white on quote.com’s charts) split half above and half below the 5 moving average indicates a strengthening bias to the upside and a similar red candle indicates a weakening to the downside.
Trend Direction
It is important to know this at all times, as you must always trade in the direction of the trend, never against it. Trend direction is mainly determined by reference to the 15-minute bar chart and where the price bars are trading in reference to the 8 and 10 moving averages, as previously explained.
be indicated by changes in the direction the moving average lines form, either pointing up, down or sideways.
The Nasdaq and Dow index numbers also provide a guide to the trend direction and it’s fluctuations.
Another indicator is that whenever the moving average lines on the 5- minute and 15-minute charts start to narrow, coming closer together; this often signals a change in direction is about to occur. This is generally followed by them widening again to form what looks like the shape of a mouth, prior to the change.
The Set - Up
To recognize a good set-up, you must first develop a “feel” for the market and the market flow. Go back to basics and literally forget all you have learned. Switch off your 1 – 3 minute charts, cast aside all of your indicators and simply watch the 5-minute bars, their behavior, formations and patterns.
Further training is required to accurately and consistently recognize the correct set-ups. However, the principal of the method relies on the current 5-minute bar’s inability to take out the previous bar (or bars) high for a “short” set-up and inability to take out a low in the case of a “long” set–up.
With experience and a high degree of concentration in watching the price activity during the formation of the current 5-minute bar, the immediate, short-term direction of the market can be determined with an uncanny accuracy.
By observing and counting the number of times the current price bar pushes in it’s attempt to take out the high or low of the previous bar (or bars), can provide a clue as to who is in control-the buyers or control-the sellers.
For example, if the price bar ticker pushes and pushes upwards at the top of the bar, failing to get any higher and is unable to take out the immediate, previous highs and then closes, it signals that it has hit resistance at this level and that the buyers are drying up and losing control. If the buyers have dried up, then the path of least resistance is down, as the sellers have now taken over control. This is a time to sell, as prices and the market are going down.
The same holds true when the price bar ticker pushes and pushes downwards at the bottom of the bar, failing to break through and getting support, indicating no more sellers, so the price is likely to reverse and go up. This is a time to buy as the market reverses; gains strength and prices start to immediately increase
.
Education is hanging around until you’ve caught on
The ratio of buyers to sellers is what determines the market direction at any given time.
If you see a possible set-up forming, never take your eyes off the bar, or you will miss the message it is giving you…you must watch it very closely. As soon as you have made the decision that it is a set-up, don’t hesitate, don’t wait, get in and take the trade.
Long Set–Up
To take a long trade (buy), the price bars must be trading above the 10 moving average line on the 5-minute Emini S&P bar chart, which indicates strength. At least one price bar must be fully formed, closed and sitting above on top of the line to allow a conservative trade – 2 bars for a more conservative trade.
The Nasdaq ($COMPX) must confirm the trade by displaying a green candle (white on quote.com’s chart) that is fully formed, closed and sitting above on top of the 5 moving average line. If it does not confirm, do not enter the trade.
The Dow index should be holding steady, or increasing.
The Nasdaq ($ COMPX) is used for confirmation only … do not trade from it.
Short Set-Up
To take a short trade (sell), the price bars must be trading below the 8 moving average line on the Emini S&P 500 5-minute bar chart, which indicates weakness. At least one price bar must be fully formed, closed and sitting below the line to allow a conservative trade – 2 bars for a more conservative trade.
The Nasdaq ($COMPX) must confirm the trade by displaying a red candle that is fully formed, closed and sitting below the 5 moving average line. If the Compx does not confirm, do not enter the trade.
The Dow index should be holding steady, or decreasing.
The Nasdaq ($ COMPX) is used for confirmation only … do not trade from it.
Stop Loss
As soon as a trade is entered into, immediately place a stop loss order for whatever amount suits your personal risk tolerance. The method allows at least 2 points. This is very important for peace of mind and to limit your downside risk.