FHWA/IN/JTRP-2005/17
PROCEDURES FOR THE ESTIMATION OF PAVEMENT AND BRIDGE PRESERVATION COSTS
FOR FISCAL PLANNING
By
Kumares C. Sinha
Olson Distinguished ProfessorSamuel Labi Visiting Assistant Professor
Marcela Rodriguez Gabriel Tine Rucci Dutta
Graduate Research Assistants
School of Civil Engineering Purdue University
Joint Transportation Research Program Project No. C-36-73W
File No.: 3-4-23 SPR-2810
Prepared in Cooperation with the Indiana Department of Transportation and
The U.S. Department of Transportation Federal Highway Administration
The contents of this report reflect the views of the authors who are responsible for the facts and the accuracy of the data presented herein. The contents do not necessarily reflect the official views of the Federal Highway Administration and the Indiana Department of Transportation. The report does not constitute a standard, a specification, or a regulation.
Purdue University West Lafayette, Indiana, 47907
14-3 7/05 JTRP-2005/17 INDOT Division of Research West Lafayette, IN 47906
INDOT Research Technology Transfer and Project Implementation Information
TRB Subject Code: 14-3 Financial Programming July 2005
Publication No.: FHWA/IN/JTRP-200517, SPR-2810 Final Report
Procedures for the Estimation of Pavement and
Bridge Preservation Costs for Fiscal Planning
Introduction
Facility preservation generally refers to the set of activities that are carried out to keep a facility in usable condition until the next reconstruction activity. For fiscal planning and programming, it is necessary to know the expected costs of preservation projects and how long they would last. Such information, coupled with minimum standards and facility inventory data, enables estimation of overall monetary needs for bridge and pavement
preservation, and can assist INDOT in undertaking appropriate programming and attendant financial planning over the long term. However, detailed engineering analyses are not possible every year because of the time and effort involved; therefore, simple procedures to broadly estimate annual pavement and bridge preservation needs are useful for long-term fiscal planning.
Findings
The study methodology consisted of first undertaking a full analysis based on engineering principles and detailed work in order to determine pavement and bridge needs for a period of time. Then simple procedures to estimate yearly pavement and bridge preservation costs were developed and the results were compared to the detailed engineering needs. Deterioration and cost models to establish engineering needs were developed using an array of statistical techniques including analysis of variance and regression analysis. Using the deterioration models, system inventory and minimum standards, the level of physical needs was
determined for the entire pavement and bridge network over the analysis period. Finally, using the identified physical needs and developed cost models, the monetary needs were estimated. An age-based approach (that considers fixed time intervals instead of deterioration trends and minimum standards) was used for the bridge preservation needs. Based on the historical expenditure records and the amount of work performed in the past, simple regression models were developed to estimate future annual pavement and bridge preservation needs. The results obtained proved to be consistent with the engineering analysis.
Implementation
The study results are useful for long-term planning and budgeting as INDOT’s Divisions of Policy and Fiscal Management and Planning will be able to schedule and monitor its
14-3 7/05 JTRP-2005/17 INDOT Division of Research West Lafayette, IN 47906
Prof. Kumares C. Sinha
Principal Investigator School of Civil Engineering Purdue University
West Lafayette, IN 47907-2051 Phone: (765) 494-2211
Fax: (765) 496-7996 E-mail: [email protected]
Indiana Department of Transportation
Division of Research 1205 Montgomery Street P.O. Box 2279
West Lafayette, IN 47906 Phone: (765) 463-1521 Fax: (765) 497-1665
Purdue University
Joint Transportation Research Program School of Civil Engineering
West Lafayette, IN 47907-1284 Phone: (765) 494-9310
Form DOT F 1700.7 (8-69) 1. Report No. 2. Government Accession No. 3. Recipient's Catalog No.
FHWA/IN/JTRP-2005/17
4. Title and Subtitle: Procedures for the Estimation of Pavement & Bridge
preservation Costs for Fiscal Planning and Programming
Report Date:
July 2005
6. Performing Organization Code
7. Author(s)
Kumares C. Sinha, Samuel Labi, Marcela Rodriguez, Gabriel Tine, Rucci Dutta
8. Performing Organization Report No.
FHWA/IN/JTRP-2005/17
9. Performing Organization Name and Address
Joint Transportation Research Program
550 Stadium Mall Drive, Purdue University, West Lafayette, IN 47907-1284
10. Work Unit No.
11. Contract or Grant No.
SPR-2810
12. Sponsoring Agency Name and Address
Indiana Department of Transportation, State Office Building, 100 N. Senate Ave. Indianapolis, IN 46204
13. Type of Report and Period Covered
Final Report
14. Sponsoring Agency Code
15. Supplementary Notes
Prepared in cooperation with the Indiana Department of Transportation and Federal Highway Administration.
16. Abstract
Facility preservation generally refers to the set of activities that are carried out to keep a facility in usable condition until the next reconstruction activity. For fiscal planning and programming, it is necessary to know the expected costs of preservation projects and how long they would last. Such information, coupled with minimum standards and facility inventory data enable estimation of overall monetary needs for bridge and pavement preservation, and would assist INDOT in undertaking appropriate programming and attendant financial planning over the long term. However, detailed engineering analyses are not possible every year because of the time and effort involved, therefore simple procedures to help estimate annual pavement and bridge preservation needs are useful for long-term fiscal planning.
The study methodology consisted of first undertaking a full analysis based on engineering principles and detailed work in order to determine pavement and bridge needs for a period of time. Then simple procedures to estimate yearly pavement and bridge preservation costs were developed and the results were compared to the detailed engineering needs. Deterioration and cost models to establish engineering needs were developed using an array of statistical techniques including analysis of variance and regression analysis. Using the deterioration models, system inventory and minimum standards, the level of physical needs was determined for the entire pavement and bridge network over the analysis period. Finally, using the identified physical needs and developed cost models, the monetary needs were estimated. An age-based approach (that considers fixed time intervals instead of deterioration trends and minimum standards) was used for the bridge preservation needs. Based on the historical expenditure records and the amount of work performed in the past, simple regression models were developed to estimate future annual pavement and bridge preservation needs. The results obtained proved to be consistent with the engineering analysis.
17. Key Words
Bridge Preservation, Pavement Preservation, Service Life, Preservation Cost, Rehabilitation, Maintenance
18. Distribution Statement
No restrictions. This document is available to the public through the National Technical Information Service, Springfield, VA 22161
19. Security Classif. (of this report)
Unclassified
20. Security Classif. (of this page)
Unclassified
21. No. of Pages
111
ACKNOWLEDGEMENTS
The authors wish to acknowledge the assistance provided by Messrs. Samy Noureldin, Gary
Eaton, David Holtz, Jaffar Golkhajeh, (all of INDOT) and Keith Hoernschemeyer (of FHWA), who
served on the Study Advisory Committee and provided valuable information at various stages of the
study. For the acquisition of bridge data, we appreciate the assistance provided by Messrs. Ron Scott,
Mike Jenkins, Dauda Ishola, and Bill Dittrich, all of INDOT. Regarding pavement data collection, we
acknowledge the efforts of Messrs. William Flora and Mike Yamin. The assistance of Dr. Bob
McCullouch and Aldy Haryopratomo are also acknowledged. We are also grateful to Dr. Barry
Partridge, Chief of INDOT Research Division, and Karen Hatke, JTRP Coordinator, for their
TABLE OF CONTENTS
LIST OF TABLES ... VII LIST OF FIGURES ... X CHAPTER 1 : INTRODUCTION ... 1
1.1 Background and Problem Statement 1
1.2 Objectives of the Study 2
1.3 Study Overview 3
1.4 Scope of the Study 3
1.5 Alternative Methodologies for Estimating Service Lives of Preservation Treatments 4 1.5.1 Estimation of Preservation Treatment Service Life Based on Time Interval 4 1.5.2 Estimation of Preservation Treatment Service Life Based on Facility erformance/Condition 5
CHAPTER 2 : LITERATURE REVIEW FOR PAVEMENT PRESERVATION NEEDS
ASSESSMENT... 8
2.1 Needs Assessment Methodologies 8
2.2 Review of Pavement Performance Models 9
2.3 Pavement Rehabilitation Costs 10
CHAPTER 3 : STUDY METHODOLOGY FOR PAVEMENT NEEDS ASSESSMENT... 12
3.1 Study Framework 12
3.2 Methodology 13
3.2.1 Defining the Jorizon Period 13
3.2.2 Establishment of Minimum Standards 13
3.2.3 Development of Pavement Deterioration Curves 13
3.2.4 Development of Preservation Cost Models 15
CHAPTER 4 : PAVEMENT SERVICE LIVES AND COST MODELS... 16
4.1 Pavement Design Life 16
4.2 Pavement Condition 16
4.2.1 Pavement Deterioration Rates 17
4.2.2 Pavement Treatments 19
4.3 Pavement Preservation Cost Models 21
CHAPTER 5 : PAVEMENT PRESERVATION NEEDS ANALYSIS ... 24
5.1 Collection and Processing of Data 24
5.2 Methodology 25
5.3 Interstate Initial Pavement Condition and Treatment 27
5.4 Non-Interstate NHS Pavement Condition and Initial Treatment 32
5.5 Non-Interstate Non-NHS Pavement Condition and Initial Treatment 34
5.6 Network Analysis Results 38
CHAPTER 6 : PROCEDURE FOR EVALUATING ANNUAL PAVEMENT PRESERVATION COST... 40
6.1 Total System Size Prediction 41
6.2 Percentage of system to be treated 42
6.3 Estimation of total preservation cost using unit cost per lane mile 43
6.4 Rehabilitation and Non rehabilitation cost 45
6.5 Preservation cost by Highway Class 47
CHAPTER 7 : DEVELOPMENT OF BRIDGE PRESERVATION COST MODELS... 49
7.1 Introduction 49
7.2 Cost Estimation of Bridge Replacement 50
7.2.1 Slab Bridge Replacement Cost Models 50
7.2.1 Slab Bridge Replacement Cost Models 51
7.2.2 Pre-stressed Beam Bridge Replacement Cost Models 54
7.2.3 Steel Bridge Replacement Cost 58
7.2.4 Summary and Conclusions for Bridge Replacement Cost Modeling 59
7.3 Cost Estimation for Bridge Rehabilitation Activities 61
7.3.1 Deck Rehabilitation Cost Model 62
7.3.2 Deck and Superstructure Rehabilitation Cost Model 64
7.3.3 Deck Replacement Cost Model 65
7.3.4 Deck Replacement + Superstructure Rehabilitation Cost Model 67
7.3.5 Superstructure Replacement Cost Model 69
7.3.6 Superstructure Replacement + Substructure Rehabilitation Cost Models 71
7.3.7 Bridge Widening Cost Model 73
7.3.8 Summary and Conclusions for Bridge Rehabilitation Cost Models 76
7.4 Overall Summary and Conclusions for Bridge Preservation Cost Models 78
CHAPTER 9 : BRIDGE PRESERVATION EXPENDITURES ... 83
9.1 Age-Based Needs 83 9.2 Estimated Needs Based on Historical Bridge Expenditures 87 9.2.1 Historical Expenditures 87 9.2.2 Projected Expenditure on the Basis of Historical Trends 88 9.3 Comparison of Age-Based Needs and Needs Based on Past Expenditure 89 CHAPTER 10 : SUMMARY AND CONCLUSIONS ... 92
10.1 Summary of Estimation Procedures 92 10.2 Conclusions 93 REFERENCES ... 95
APPENDIX A. PERFORMANCE CURVES ... 98
APPENDIX B. COST MODELS FOR ASPHALTIC CONCRETE PAVEMENTS ... 101
APPENDIX C. INDOT CONTRACTS UNIT PAVEMENT TREATMENT COSTS... 103
APPENDIX D. AAMEX MODEL CURVES... 105
LIST OF TABLES
Table 4-1 Design Life of Pavement Treatments... 16
Table 4-2 International Roughness Index... 17
Table 4-3 Terminal Pavement Serviceability Ratings ... 17
Table 4-4 Pavement Deterioration Rates ... 19
Table 4-5 Input Variables for Pavement Preservation Cost Models... 22
Table 4-6 Average Pavement Treatment Costs per Lane-Mile ... 22
Table 4-7 Average Annual Maintenance Costs per Lane-Mile ... 23
Table 5-1 Network Analysis Pavement Resurfacing Deficiency Levels ... 25
Table 5-2 Network Analysis Pavement Reconstruction Deficiency Levels ... 26
Table 5-3 Pavement Performance (IRI) Jumps after Treatment ... 27
Table 5-4 Interstate HMA Pavement Treatment Thresholds... 28
Table 5-5 Interstate PCC Pavement Treatment Thresholds... 29
Table 5-6 Interstate COMP Pavement Treatment Thresholds ... 30
Table 5-7 Non-Interstate NHS HMA Pavement Treatment Thresholds... 33
Table 5-8 Non-Interstate NHS PCC Pavement Treatment Thresholds... 33
Table 5-9 Non-Interstate NHS COMP Pavement Treatment Thresholds ... 34
Table 5-10 Non-Interstate, Non-NHS, HMA Pavement Treatment Thresholds... 35
Table 5-11 Non-Interstate Non-NHS PCC Pavement Treatment Thresholds... 36
Table 5-12 Non-Interstate Non-NHS COMP Pavement Treatment Thresholds ... 36
Table 5-13 Fifteen-year Pavement Condition Preservation Needs Scenario A... 38
Table 5-14 Fifteen-year Pavement Condition Preservation Needs Scenario B ... 39
Table 6-1 Comparison of actual and predicted pavement preservation costs for 2002 and 2003... 44
Table 6-2 Percentage of money spent on different highway classes (2000 and 2001) ... 47
Table 6-3 2008 Pavement Preservation Costs by Highway class ... 48
Table 7-1 Summary of Superstructure Replacement Cost Models for Slab Bridges ... 52
Table 7-2 Details of Best Superstructure Replacement Cost Model for Slab Bridges... 52
Table 7-3 Summary of the Substructure Replacement Cost Models for Slab Bridges ... 53
Table 7-5 Summary of Superstructure Replacement Cost Models for Pre-stressed Beam Bridges ... 55
Table 7-6 Details of Best Model for Superstructure Replacement Cost of Pre-stressed Beam Bridges ... 55
Table 7-7 Summary of Substructure Replacement Cost Models for Pre-stressed Beam Bridges... 56
Table 7-8 Details of Best Substructure Replacement Cost Model for Pre-stressed Beam Bridges... 56
Table 7-9 Summary of the Approach Cost Models for Pre-stressed Beam Bridge Replacement ... 57
Table 7-10 Details of Best Approach Cost Model for Pre-stressed Beam Bridge Replacement ... 57
Table 7-11 Summary of the “Other Cost” Models for Pre-stressed Beam Bridge Replacement ... 58
Table 7-12 Details of Best “Other Cost” Model for Beam Bridge Replacement... 58
Table 7-13 Descriptive Statistics of Replacement Unit Cost: for Steel Structure ... 59
Table 7-14 Summary of Bridge Replacement Cost for Concrete Bridges ... 60
Table 7-15 Summary of Deck Rehabilitation Primary Cost Models for all Bridge Types ... 62
Table 7-16 Summary of “Other Cost” Models for Deck Rehabilitation Contracts... 62
Table 7-17 Details of Best Deck Rehabilitation Primary Cost Model for all Bridge Types ... 63
Table 7-18 Details of Best Unit “Other Cost” Model for Deck Rehabilitation, all Bridge Types ... 63
Table 7-19 Summary of Primary Cost Models for Deck + Superstructure Rehabilitation for all Bridge Types... 64
Table 7-20 Details of the Best Primary Cost Model for Deck + Superstructure Rehabilitation for all Bridge Types... 65
Table 7-21 Descriptive Statistics for Deck Replacement Total Cost ... 66
Table 7-22 Descriptive Statistics for Deck Replacement Unit Cost... 66
Table 7-23 Descriptive Statistics for Deck Replacement + Superstructure + Substructure Rehabilitation Cost ... 67
Table 7-24 Descriptive Statistics for Deck Replacement + Superstructure + Substructure Rehabilitation Cost ... 67
Table 7-25 Summary of Deck Replacement + Superstructure Rehabilitation Primary Cost Models for all Bridge Types... 68
Table 7-26 Best Deck Replacement + Superstructure Rehabilitation Primary Cost Model for all Bridge Types... 68
Table 7-27 Summary of Deck Replacement + Super Rehabilitation “Other Cost” Models for all Bridge Types... 68
Table 7-29 Summary of Superstructure Replacement Primary Cost Models for all Bridge Types ... 69
Table 7-30 Details of Best Superstructure Replacement Primary Cost Model for all Bridge Types.... 70
Table 7-31 Summary of Superstructure Replacement “Other Cost” Models for all Bridge Types... 70
Table 7-32 Details of Best Superstructure Replacement “Other Cost” Model for all Bridge Types... 70
Table 7-33 Summary of Superstructure Replacement + Substructure Rehabilitation Primary Cost Models for all Bridge Types ... 71
Table 7-34 Details of Best Superstructure Replacement + Substructure Rehabilitation Primary Cost Model for all Bridge Types... 71
Table 7-35 Summary of Superstructure Replacement + Substructure Rehabilitation “Other Cost” Models ... 72
Table 7-36 Details of Best Superstructure Replacement + Substructure Rehabilitation “Other Cost” Model... 72
Table 7-37 Summary of Bridge Widening Primary Cost Models... 74
Table 7-38 Details of Best Bridge Widening Primary Cost Model for all Bridge Types... 74
Table 7-39 Summary of Bridge Widening “Other Cost” Models for all Bridge Types... 75
Table 7-40 Details of Best Bridge Widening “Other Cost” Model for all Bridge Types ... 75
Table 7-41 Summary of Rehabilitation Activity Cost Models ... 77
Table 8-1 Results of Age-Based Physical Needs Assessment of Concrete Bridges, 2004-2015 ... 81
Table 8-2 Results of Age-Based Physical Needs Assessment of Steel Bridges, 2004-2015... 82
Table 9-1 Age-Based Monetary Needs for Bridge Replacement, by Year and Structure Material ... 84
Table 9-2 Annual Deck Rehabilitation Needs by Structure Material ... 85
Table 9-3 Historical Bridge Expenditure from (1996-2003)...87
Table 9-4 Projected Bridge Expenditure from 2005 to 2015 ... 89
Table 9-5 Comparison of Needs Based on Past Expenditures and Needs Based on Age ... 90
Table C.0-1 Unit Pavement Treatment Costs ...103
LIST OF FIGURES
Figure 1-1 Alternative Methodologies for Service Life Determination ... 4
Figure 1-2 Estimation of Preservation Treatment Service Life based on Time Interval ... 5
Figure 1-3 Estimation of Preservation Treatment Service Life Based on Time-Series... 6
Figure 1-4 Estimation of Preservation Treatment Service Life Based on Cross-Sectional Condition Data... 7
Figure 3-1 Framework Used for Pavement Preservation Needs Assessment ... 12
Figure 3-2 Pavement Deterioration Curve ... 14
Figure 5-1 Distribution of Interstate Pavement as of Year 2001... 28
Figure 5-2 Methodology used for Excellent, Good and Good-To-Fair Pavements ... 31
Figure 5-3 Distribution of Non-Interstate NHS by Pavement Condition as of Year 2001 ... 32
Figure 5-4 Distribution of Non-Interstate Non-NHS by Pavement Condition as of Year 2001... 35
Figure 5-5 Methodology for Poor Pavements... 37
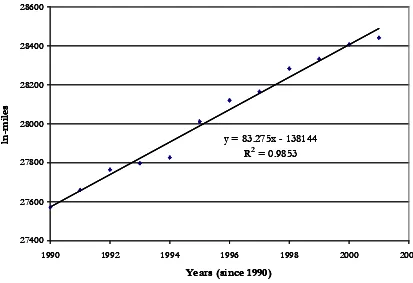
Figure 6-1 Indiana’s highway system size versus time ... 41
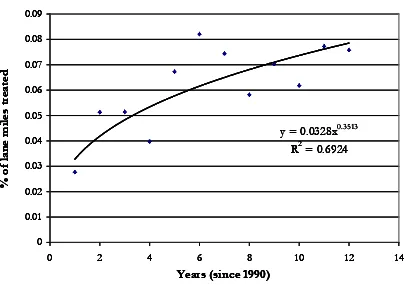
Figure 6-2 Percentage of system preserved versus time ... 42
Figure 6-3 Percentage of system rehabilitated versus time ... 45
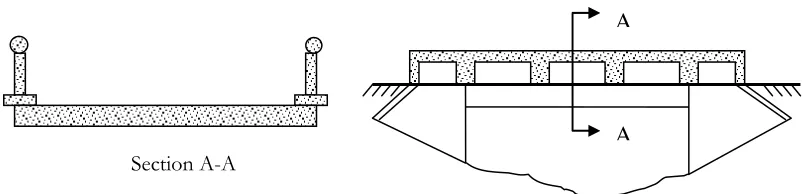
Figure 7-1 Schematic Illustration of Typical Concrete Slab Bridge Types ... 51
Figure 7-2 Schematic Illustration of Typical Pre-stressed Concrete Bridge Sections... 54
Figure 7-3 Comparison of Unit Cost of Bridge Replacement between Steel and Concrete Bridges ... 59
Figure 7-4 Classification of Rehabilitation Cost Models Developed in Present Study ... 61
Figure 7-5 Predicted and Actual Cost for Superstructure Replacement + Substructure Rehabilitation ... 73
Figure 8-1 Delineation of Bridge Age ... 79
Figure 9-1: Bridge Replacement Monetary Needs... 85
Figure 9-2 Bridge Rehabilitation Monetary Needs ... 86
Figure 9-3 Modeling Bridge Preservation Expenditure ... 88
CHAPTER 1 : INTRODUCTION
1.1 Background and Problem Statement
Facility preservation generally refers to the set of activities that are carried out to keep a facility
in usable condition until the next reconstruction activity. For fiscal planning and programming, it is
necessary to know the expected costs of preservation projects and how long they would last.
Knowledge of such costs and service lives of preservation treatments, coupled with established
minimum standards and facility inventory data (such as type, material, size, stage of deterioration and
other characteristics) enable estimation of overall physical and monetary needs for preserving the
state highway pavements and bridges. Such assessed needs would enable INDOT to undertake
appropriate programming and attendant financial planning over the long term. The long-range
financial plans would entail a projected cash flow schedule that indicates how much is needed and at
what time it is needed. As these estimates are to be made at planning stage, expected input data can
only include broad specification of project types along with data on unit costs, traffic characteristics,
climatic features, and other data related to highway pavement and bridge condition and usage.
The current version of pavement and bridge management software packages used by
INDOT incorporate several distinct types of preservation treatments. At the present time, it is not
certain that there exists a direct and comprehensive analysis of the costs and service lives of facility
preservation projects in a manner that would be consistent with INDOT’s financial planners,
particularly for the bridge projects. The cost and service life values currently in use may not properly
reflect current conditions, because technological (preservation techniques) and economic changes in
the transportation environment necessitate the re-estimation of highway facility preservation costs. It
is therefore necessary to collect and analyze detailed post-construction data from recent years to
develop appropriate models for pavement and bridge preservation. The development of such models
is the focal point of the present study.
The present study investigated the information needs for programming and fiscal planning
on project costs and service lives vis-à-vis the types of available information from the pavement and
estimate/predict the cost and service life of various pavement and bridge preservation activity types,
given facility characteristics such as functional class, material type, climatic region, and other
variables.
It is important to note that within each preservation life-cycle, any of several alternative
repair (maintenance and rehabilitation) strategies can be carried out. Therefore, the length of any
preservation life-cycle is not fixed, but depends on the maintenance strategy within that cycle:
generally, higher maintenance is associated with longer preservation life-cycles and vice versa.
However, beyond a certain point, increasing maintenance leads to decreasing cost-effectiveness,
therefore, for any given preservation type, there exists some optimal level of maintenance that should
be carried out within the preservation life-cycle. The present study utilizes results from an earlier
JTRP studies (Hodge et al., 2004; Rodriguez, 2004) that determined the preservation life-cycles
corresponding to different levels of life cycle repair effort.
The study product will help INDOT to schedule and monitor its preservation cash flows in
a more effective manner than what is possible at present. Also, the study provides a reliable and
simple set of procedures for estimating annual preservation costs for pavement and bridge projects.
It is expected that the study results will complement existing efforts by INDOT’s pavement and
bridge management systems in the provision of information related to preservation costs and service
lives.
1.2 Objectives of the Study
The objectives of the study were as follows:
1) To collect and collate historical records of costs and service lives of pavement preservation
and bridge replacement and rehabilitation projects,
2) To develop models for estimating service lives and costs of pavement preservation and bridge
related activities.
3) To establish a simple procedure for INDOT´s policy and fiscal management and
1.3 Study Overview
The study is divided into two parts: first for pavements, and second for bridges. For each of
these two facility types, the study investigated current service lives of pavements and bridges in the
Indiana state highway system. Updated cost models were also developed to assess the financial needs
for pavement and bridge over the 2005-2020 analysis period. This was carried out on the basis of:
system size, minimum standards, deterioration trends for pavement, age for bridges and cost models.
Simple procedures to estimate annual bridge and pavement expenditure were also developed. A
comparison was made of the predicted expenditure with the estimated needs over the analysis period.
1.4 Scope of the Study
Spatial: Only pavements and bridges on the state highway system were considered. As much as
possible, pavement sections and bridges at geographically diverse locations on the state network were
included to capture any possible regional/climatic differences.
Temporal: Historical data for pavement and bridge cost and service life modeling was taken from
projects executed between the years 1990-2003. This time period provided adequate time to evaluate
the service lives of such projects. Due regard was given to the effect of changes in interest rate or
construction price indices (CPI) within this period.
Project Types: Project types and their definitions were drawn from the planning and programming
divisions and conformed to the need of the policy and fiscal management division.
Facility Material Type and Other Considerations: The study developed cost and service models for the
types of bridges found on the state highway network, such as steel and reinforced-concrete bridges,
and the types of pavements such as full-depth asphalt, rigid, and composite pavements. Also, all
1.5 Alternative Methodologies for Estimating Service Lives of Preservation Treatments
There are several approaches that can be used to estimate the service life of pavement and bridge
preservation treatments, as shown in Figure 1-1.
1.5.1 Estimation of Preservation Treatment Service Life Based on Time Interval
This approach simply involves measurement of the time interval that passes between a preservation
treatment and the next similar or higher preservation treatment (Figure 1-2).
Figure 1-1 Alternative Methodologies for Service Life Determination
Service Life Estimation using Historical Data
Estimation based on Time Interval
How much time elapsed between
“successive” preservation treatments?
Using Time-Series
Performance Data
Estimation based on Performance/Condition
How much time passed before the treated facility
reverted to the state before treatment or to a
pre-specified threshold state?
Using
Cross-Sectional
Performance Data
Using Panel
Performance Data
Pre-specified General Threshold for all
Pavements in a Given Category Performance/Condition of
Service Life at Tx, SLX = TY -TX
For each of several pavement sections or bridges that received the given preservation treatment, the
service life can thus be determined, and expressed as an average value or as a function of facility type,
traffic and weather characteristics. The advantage of this approach lies in its economy: no pavement
performance/condition data is needed to establish service lives in this manner. However, for this
approach to work, preservation treatment contract records spanning a considerable span of time
should be available for each pavement or bridge. This is generally not the case at INDOT even
though the Research Team has made earnest efforts in obtaining data of this sort.
1.5.2 Estimation of Preservation Treatment Service Life Based on Facility
Performance/Condition
In this approach, service life of a preservation treatment can be determined by estimating the amount
of time that passed before the treated facility reverted to the state before treatment or to a
pre-specified threshold state. Three separate approaches can be followed as discussed below.
Time Series: In this approach, the performance/condition of each individual facility (pavement section
or bridge) that has received a specific preservation treatment is monitored over time. The time
interval between the time of treatment and the time at which condition falls below the condition
before treatment (Figure 1-3(a)) or a pre-specified condition (Figure 1-3(b)), is measured as the
service life of the preservation treatment. If a pre-specified condition is used, the facility condition at
time of treatment may be lower than that threshold (as shown in the illustration) or may be higher
than the threshold. This approach is data intensive: facility performance/condition data is needed
over a considerable span of time for each facility.
Figure 1-2 Estimation of Preservation Treatment Service Life Based on Time Interval Treatment
Treatment
SLX
Year TX Year TY
(a) (b)
This may be repeated for several facilities that received the treatment in question, and the service
lives thus obtained can simply be processed to give an average service life for that treatment, or may
be expressed as a function of facility type, traffic, weather and other attributes, for that preservation
treatment.
Cross Sectional: In this approach, the performance/condition (at any single given year only) of several
facilities that received a specific treatment is used. As such facilities typically have a wide range of
ages at the year in question, it is possible to obtain performance models that relate facility condition
to facility age. Using such functions, it is possible to determine the average service life associated with
the preservation treatment under investigation.
Panel Data: This approach, consistent with the pooling of data across years, is similar to that for
cross-sectional data, with the exception that performance data for more than one year, rather than
just one year, are used for developing performance models for facilities that received a specific
treatment. Such analysis is susceptible to problems of auto-correlation, and it is important that
appropriate statistical and econometric tools are employed to detect and correct for any such
problems.
Figure 1-4 Estimation of Preservation Treatment Service Life Based on Cross-Sectional
CHAPTER 2 : LITERATURE REVIEW FOR PAVEMENT PRESERVATION NEEDS ASSESSMENT
2.1 Needs Assessment Methodologies
Need can generally be attributed to investment targeted to address an identified deficiency or
maintain/operate existing facilities or transportation systems. (Hartgen, 1986). Need could be
backlog or current need and accruing or future need. This need could be physical (need to maintain
the physical condition) or monetary (cost associated with carrying out the physical needs). Physical
need arises when a pavement’s level of service falls below minimum tolerable conditions and thus
indicating a deficiency. The state and local agencies accountable for maintaining millions of miles of
the roadway pavements constantly seek tools to help them make cost-effective pavement repair
decisions. Many agencies have implemented a pavement management systems (PMS) that help them
assess and prioritize needs, and to optimize the use of available funds. From INDOT 2000-2025
Long Range Plan, it can be noted that INDOT places high priority on the preservation of the
existing road system as demonstrated by the policy planning of 1995 statewide plan (INDOT, 1999).
System preservation strategies can be developed, implemented and evaluated using the pavement
management system (PMS). INDOT’s Pavement Management System performs a pavement
performance analysis which includes an estimate of present and predicted performance for specific
pavement types and an estimation of the remaining service life of all pavements on the network. It
also carries out a network level analysis that estimates total costs to correct present and future
conditions of pavements across the network, and appropriate time periods, as determined by the
state, for these investment analyses. Thus, the PMS system at INDOT conducts pavement condition
analysis, pavement performance analysis and investment analysis to determine the needs for the
pavement network. Thus, the PMS system at INDOT conducts pavement condition analysis,
pavement performance analysis and investment analysis to determine the needs for the pavement
network. To manage this pavement system effectively, it is important to determine existing pavement
conditions and to predict remaining service life. These two aspects are some of the challenges facing
The needs assessment study conducted by the Oregon Department of Transportation
(ODOT) is a recent example of such efforts (Griffith et al., 2002). In this study, the pavement
preservation methodology was based on extrapolation of historical data. In order to create the
pavement preservation projection model, some basic assumptions were made. The pavement
preservation forecast was based on the use of asphalt concrete (AC) overlays/inlays on all highways
and the use of chip seals on low volume highways. Only three existing pavement types were
considered, namely Asphalt Concrete (AC), Jointed Concrete pavement (JCP) and Continuously
Reinforced Concrete Pavement (CRCP). Different preservation options were applied based on the
existing type of pavement, traffic volumes, and urban or rural location. Preservation options, such as
overlay, chip sealing, rubblizing were identified based on the existing surface type and functional class
of the road and a predetermined value of treatment thickness was used in the model to estimate
aggregate needs. The length of each highway segment in the ODOT system, as well as corresponding
paved surface width was entered into a spreadsheet and thus by multiplying both, the surface area
was determined. Knowing the surface area and thickness of the treatment, volumetric calculations of
required paving were made for each highway segment. Thus the aggregate physical needs for
pavement preservation was determined which was converted into monetary value by multiplying the
aggregate volume for a treatment with the standard unit cost associated with each treatment. The
preservation forecast model assumed a stable paving cycle in the 15-year period and did not consider
fluctuations in funding levels from year to year. The major limitation of such approach is that needs
are based on historical expenditure data which may not reflect actual requirements to maintain a
certain level of condition.
2.2 Review of Pavement Performance Models
Pavement performance models are generally represented by condition versus age
relationships. They reflect the deterioration patterns of the pavement section and thus help assess its
present and future condition. Such models can be used to estimate the time when a pavement will
reach a specified threshold condition and thus will require a preservation activity. The year in which a
pavement section deteriorates to unacceptable levels is determined by extrapolating pavement
deterioration curves for each type of pavement to be rehabilitated. As the concept of pavement
performance curve to predict deterioration and forecast service life has been widely employed
(NCHRP Synthesis 223), it was also utilized in the present study.
The rationale for using the performance curve approach is simple: a consistently well
maintained pavement (a gently sloping performance curve, yielding a large area under that curve)
provides the user greater benefits than a poorly maintained pavement (a steep performance curve
having a small underlying area). Because the benefits of a well-maintained pavement are numerous
and difficult to quantify in monetary terms, the area under the performance curve could be used as a
surrogate for user benefits. Another way of measuring benefit is to estimate the extended remaining
service life by carrying out that improvement, i.e., time taken for the pavement to deteriorate to a
certain threshold level (Geoffroy, 1996; Collura, 1993; Corvi et al, 1970).
2.3 Pavement Rehabilitation Costs
Rehabilitation policies are comprised of strategies that are simply a “collection” of one or
more maintenance treatment types carried out at various points in time on a given pavement. The
costs of the treatments are a necessary input to cost-effectiveness modeling, and they provide a
quantitative measure of the cost aspect of any strategy. Rehabilitation treatment cost models are
different from rehabilitation expenditure models in that the former are treatment specific, while the
latter are specific to a pavement section. Rehabilitation treatment cost models are therefore more
appropriate for assessing the costs of treatment strategies. Typically, factors that affect rehabilitation
expenditure belong to two groups: pavement attributes (such as type, functional class, location,
condition, etc.) and work source (in-house or by-contract) (Ben Akiva et al., 1990; Carnahan et al.,
1987).
Also, it has been observed that preservation treatment unit accomplishment cost (UAC)
models typically express the cost of a treatment in terms of dollars per unit output (tons, lane-miles,
linear miles, etc.) (Feighan and Sinha, 1987). For a given rehabilitation treatment, the variation in unit
accomplishment costs are typically due to variations in pavement attributes (such as location,
condition, etc) on one hand, and treatment attributes such as type (alternative material or process),
work source (in-house or by-contract) on the other hand. Using treatment levels and annualized cost
data for various rehabilitation treatments received by pavements within a study period, models are
usually developed to estimate the unit costs of various treatments. All costs indicated are in constant
dollar of the present year but can be updated to current values using the Highway Construction and
Maintenance Cost Indices.
The present study focused on estimating the agency costs associated with pavement
only for life-cycle cost analysis and ultimately for pavement repair project prioritization and selection,
but also for fiscal planning and budgeting.
In order to determine the costs for pavement preservation, equations can be developed that
model the cost of the preservation activity as a function of significant variables. Agency costs can be
obtained from historical data, either as an average value, or in the form of a model that estimates
costs as a function of the pavement type, functional class, length, width and thickness of the
preservation activity and other explanatory variables. For the identification of cost-effective
pavement projects, cost models should be developed using explanatory variables. However, for the
purpose of long range fiscal planning, procedures based on historical data may provide satisfactory
CHAPTER 3 : STUDY METHODOLOGY FOR PAVEMENT NEEDS ASSESSMENT
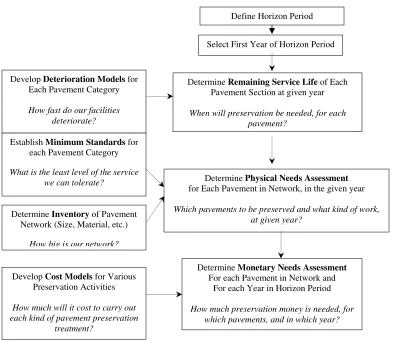
3.1 Study Framework
For estimating the pavement preservation needs on actual requirements, the following methodology,
as shown in Figure 3-1, was used.
Figure 3-1 Framework Used for Pavement Preservation Needs Assessment Develop Deterioration Models for
Each Pavement Category
How fast do our facilities deteriorate?
Determine Inventory of Pavement Network (Size, Material, etc.)
How big is our network? Establish Minimum Standards for
each Pavement Category What is the least level of the service
we can tolerate? Determine Physical Needs Assessment for Each Pavement in Network, in the given year
Which pavements to be preserved and what kind of work, at given year?
Determine Monetary Needs Assessment For each Pavement in Network and
For each Year in Horizon Period
How much preservation money is needed, for which pavements, and in which year? Develop Cost Models for Various
Preservation Activities
How much will it cost to carry out each kind of pavement preservation
treatment?
Determine Remaining Service Life of Each Pavement Section at given year
When will preservation be needed, for each pavement?
Define Horizon Period
3.2 Methodology
3.2.1 Defining the Jorizon Period
INDOT’s 2000-2025 long-range plan calls for the implementation of hundreds of capacity
expansion projects, with a total price tag of approximately $6.5 billion [INDOT, 1999]. This needs
assessment study can provide the information necessary to make cost-effective decisions about the
rehabilitation of the pavement network in the long term. This long term period of needs assessment
was defined in conjunction with INDOT’s long range plan, and hence the horizon period of 15
years, i.e. 2006-2020 was considered for the analysis. 2002 was considered as the base year for the
study.
3.2.2 Establishment of Minimum Standards
The use of condition triggers based on aggregate measures seems to be popular with many
agencies including INDOT. In such formulations, maintenance and rehabilitation treatments are
carried out any time the aggregate measure fall below certain thresholds or “trigger values”. An
advantage of using trigger values lies in their economy. There is no need to carry out field monitoring
of each indicator of pavement distresses. However, a disadvantage is that the aggregate measures
only give an indication of the overall pavement performance and fail to provide the distribution of
various distresses which can be used to determine the treatment types.
3.2.3 Development of Pavement Deterioration Curves
The current or most recent condition of pavement sections is reported for the Indiana state
highway system in terms of IRI and PSR. In the present study, based on the current and future
conditions, the network pavement performance trend was developed in terms of needs distribution.
The current age of the pavements was calculated by subtracting the base year from the year it was last
rehabilitated. This analysis was performed using trigger or minimum acceptable index (IRI) values.
Pavement sections with performance indices below the trigger level were identified as needs and
were recommended for rehabilitation treatments. The current age was identified on pavement
performance curve and thus the year when the pavement section would reach the minimum
threshold limit was estimated on the curve. Such determined year was an indicator of the service life
of the pavement. Thus, subtracting the current age from the service life provided the remaining
activity was due. All the forecasted preservation sections were summed up for a particular year,
which helped determine the total number of miles that need to be rehabilitated for each year for the
horizon period. This concept is explained in Figure 3-2.
The results of the analysis provide a useful tool to understand the current and future
conditions of the highway network. The remaining service lives of the pavements were also
determined by subtracting the current age of the pavements from the service (design) life values for
rehabilitated pavements given as default service life values in the Indiana Design Manual (.IDM).
This method is not very reliable because it gives a preset interval when the rehabilitation work needs
to be carried out in the future, irrespective of the condition of the pavement at that particular time
period. The pavements could deteriorate more or less depending upon the traffic and environmental
conditions. Hence the method based on conditions should be a better estimate of the remaining
service life of the rehabilitated pavements.
Figure 3-2 Pavement Deterioration Curve
(IRI
3.2.4 Development of Preservation Cost Models
Once the pavement sections that needed preservation were identified, or in other words the
total miles to be preserved each year were calculated, cost models were used for the assessment of
the monetary needs involved. The cost models were developed using unit preservation cost as the
dependent variable, as a function of various pavement preservation treatment attributes (such as road
width, new pavement thickness) and physical characteristics of the pavements (such as functional
CHAPTER 4 : PAVEMENT SERVICE LIVES AND COST MODELS
4.1 Pavement Design Life
Pavements are typically designed for 15 to 30-year design lives (INDOT, 1998). Table 4-1
presents the typical design life of various pavement treatments as provided by INDOT.
Pavement Treatment Design Life (years)
New PCCP
Concrete Pavement over Existing Pavement New Full Depth HMA
HMA Overlay over Rubblized PCCP HMA Overlay over Asphalt Pavement
HMA Overlay over Cracked and Seated PCCP HMA Overlay over CRC Pavement
HMA Overlay over Jointed Concrete, Sawed and Sealed Joints HMA Overlay over Jointed Concrete
PCCP Joint Sealing
Thin Mill and Resurface of Existing Asphalt
Concrete Pavement Rehabilitation (CPR) Techniques Microsurface Overlay Source: Indiana Design Manual, Chapter 52, 1998
4.2 Pavement Condition
Pavement condition influences user costs, such as vehicle operating costs, safety, and travel
time. Two measures of pavement condition were used in this research, the Pavement Serviceability
Rating (PSR) and the International Roughness Index (IRI). The Pavement Serviceability Rating
(PSR) is a subjective rating of pavement ride quality which requires visual inspection of the
0 to 5, where 0 is totally impassable or failed pavement and 5 is a pavement in excellent condition.
The manual assumes an initial serviceability index of 4.2.
IRI is a physical measure of the pavement ride quality and captures the “bumpiness” of the
pavement in terms of inches per mile. The higher the IRI value, the rougher is the ride. A review of
a set of sample data collected from INDOT suggests that a new flexible pavement would have an
initial IRI of 60 and typical new rigid pavement would have an initial IRI of 70. A summary of the
IRI index as provided by the Pavement Management Section of the Program Development Division
of INDOT is illustrated in Table 4-2.
Pavement Condition IRI Range
Excellent 60 – 100
Good 100- 150
Fair 150 – 200
Poor >200 INDOT, 2000
Over time, new pavements deteriorate due to traffic loads and weather effects, and the PSR
value decreases. A pavement is considered to have reached its terminal serviceability between a PSR
of 2.5 to 2.0, depending on its functional classification. A summary of terminal serviceability ratings
for pavements is shown in Table 4-3.
Pavement Classification PSR
Rural major collector and above 2.5 Rural minor collector and below 2.0 Urban arterials 2.5 Urban collectors and below 2.0 Source: INDOT Design Manual, Chapter 52, 1998
4.2.1 Pavement Deterioration Rates
Rehabilitation based on trigger values implies that a specific rehabilitation activity is carried
out anytime a selected measure of pavement condition reaches a certain threshold value. For the
measure of pavement performance, the pavement IRI values as of 2002 were considered. A
deterioration curve that depicts the rate of deterioration of pavements over time was plotted for nine Table 4-2 International Roughness Index
families of pavements, thus providing a tool with which the effective remaining service life of a
particular pavement could be predicted. The deterioration curves were plotted with age as the
X-variable and IRI as the Y-X-variable. The current age of the pavement was estimated by subtracting the
year when last work was done from the current year. With the knowledge of the current age of the
pavement, and the deterioration curve, the year when the pavement would reach the threshold value
could be established by extrapolating the curve. The performance curve showed IRI values varied
linearly with age. Statistical equations for the performance curves were obtained using a spreadsheet.
The trigger values for the pavement families were put in the equation and the corresponding age,
when the pavement would reach that trigger value, was obtained. This was referred as the needs year.
Thus, the current age was subtracted from the needs year to obtain the remaining service life of the
pavements. Details of the models are presented in Appendix A.
Pavement deterioration curves based on PSR (Pavement Serviceability Rating) were also
developed (Lamptey et al., 2004). The curves indicated that the average rate of deterioration for
Indiana pavements can be taken as 0.2 PSR per year. To determine the corresponding change in IRI
associated with a 0.2 PSR/year deterioration rate, Equation 4-1 (Gulen et al., 1994 and INDOT,
2000) relating IRI to PSR was used.
( IRI)
PSR
=
9
.
0
×
ε
−0.008747×Eq. 4-1
Using this equation, a new pavement with an initial PSR of 4.2 and a pavement deterioration
rate of 0.2 PSR/year has an equivalent change in IRI due to pavement deterioration of 6 IRI/year.
Using this method, a new pavement with a PSR of 4.2 would have a condition rating of 4.0 PSR after
one year. The pavement needs analysis for the network method is based on deterioration rates of 0.2
PSR/year and 0.3 PSR/year, which correspond to deterioration rates of 6 IRI/year and 8 IRI/year
respectively, using a PSR pf 4.2 as the starting condition. Table 4-4 illustrates the pavement
Deterioration Rate Condition After 1 Year Initial
Condition
Rating (PSR) ∆PSR/Year ∆IRI/Year PSR IRI
0.2 6 4.00 93
0.25 7 3.95 94
0.3 8 3.90 96
4.2 PSR
0.4 11 3.80 99
4.2.2 Pavement Treatments
There are many types of treatments that can be selected to improve the condition of
pavements as illustrated in Table 4-1. Descriptions of common pavement treatments as outlined in
the IDM and the April 2003 INDOT Memorandum entitled “FY-2004 Pavement Preservation
Guidance (Draft),” are discussed in the sections that follow. The terms “3R” and “4R,” when used
in a pavement treatment context, imply the following:
• 3R projects are used for rehabilitating the pavement. This is major pavement work
that will include pavement rehabilitation or reconstruction; shoulder work such as
patching and/or replacement; and limited pipe work and safety work. Work may
include curb or sidewalk work and minor realignment of the road centerline at
specific spot locations. No right-of-way acquisition is needed (INDOT, 2003).
• 4R projects are intended to replace the entire pavement structure. This is major
pavement work that generally requires the correction of all safety defects and
reconstruction of items outside the pavement structure. Work includes bringing the
road up to current geometric standards, upgrading all safety features, and upgrading
all drainage features. Work may include added travel lanes if authorized by the
INDOT LRP.
4.2.2.1 Preventive Maintenance Treatments
NCHRP Report 223 provides two convenient criteria for maintenance activities: urgency of
the activity and the effect of the activity. Geoffroy (1996) provided the following descriptions for
maintenance activities:
• Routine Maintenance: Day-to-day activities that are scheduled and whose timing is
within the control of maintenance personnel, such as moving and ditch cleaning.
“Routine maintenance” is a broad term often used to describe any activity that is
carried out on a routine basis, such as routine preventive maintenance, i.e., crack
sealing; routine corrective maintenance, i.e., patching; and non-pavement routine
maintenance, i.e., mowing and underdrain maintenance.
• Demand Maintenance: Urgent activities that must be done in response to an event
beyond the control of maintenance personnel, i.e., any emergency repair of a
pavement.
• Corrective Maintenance: Planned activities to repair deficiencies, i.e., shallow
patching to increase the structural capacity at a localized area.
• Preventive Maintenance: Planned activities that correct minor defects, slow down
future deterioration, and maintain and improve the functional condition of the
system while not substantially increasing the structural capacity.
Preventive Maintenance (PM) is intended to extend the life of the pavement by arresting
light deterioration, retarding progressive damage, and reducing the need for routine maintenance.
The proper time for PM is before the pavement experiences severe distress, structural problems, and
moisture or aging-related damage.
The commonly used PM treatments on asphalt surfaces include: chip sealing, crack sealing,
micro-surfacing, sand sealing, and thin hot-mix asphalt (HMA) overlays with or without milling.
Thin HMA overlays may involve a single course of 40 mm HMA. For concrete pavements, the
pavement could receive Concrete Pavement Rehabilitation (CPR) techniques, such as joint sealant
replacement, contract crack sealing, minor patching, and retrofit joint load transfer. Cleaning and
sealing of joints for PCC pavement includes inspecting contraction and longitudinal joints for loose,
missing, or depressed sealant. Defective sealants are removed and replaced. This prevents dirt and
4.2.2.2 Pavement Rehabilitation Partial 3-R
This treatment includes a new surface placed on the existing road to improve service. The
project is not constructed to the current 3R/4R standards (which could include alignment work).
The primary intent is to restore the surface of the road by several methods. Incidental work such as
curbs, drains, shoulders, guardrail or other facility improvements also may be included. This type of
work does not widen, modernize, or significantly upgrade the facility.
4.2.2.3 Pavement Replacement/Reconstruction
This treatment replaces existing mainline pavement with new pavement. The new pavement
may be wider than the existing or have a number of lanes that is different from the original.
Incidental work, such as grading, drains, shoulders, or guard rails, for the purpose of modernizing the
facility and enhancing safety may be included.
4.3 Pavement Preservation Cost Models
Cost models were developed from contract data provided by INDOT. Preservation project
costs were converted into unit costs (dollars/square-feet). Statistical regression technique (SPSS
software) was used to develop models for estimating preservation costs, as a function of the physical
characteristics of the pavement, such as the length and width of the pavement rehabilitation section,
thickness of repair work, functional class, pavement type, and location of the pavement: north or
south, PSI, surface milling and the year of the last rehabilitation work. Three types of cost models
were developed depending upon the type of pavement, i.e., Asphaltic Concrete, Portland Cement
Concrete and Composite. The NHS and Non-NHS classification was not found to be significant
since unit rehabilitation costs were almost the same for these two categories. Table 4-5 shows the
Table 4-5 Input Variables for Pavement Preservation Cost Models
Significant Non-Significant
Length Functional Class
Width Year of Rehab
Thickness PSI North Factor
South Factor Surface Milling
T-Statistics of each variable was used to determine the effect of each of the significant variable. The
details of the models are presented in Appendix B
Several sources were also investigated for Indiana-specific pavement treatment costs.
Average costs per lane-mile for treatments by pavement type were obtained from the JTRP project
entitled, “Life Cycle Cost Analysis for Pavement Design Procedures” (Lamptey et al., 2004). A list of
common pavement treatments and their costs per lane-mile is provided in Table 4-6. A complete
description of all of the pavement treatment costs is shown in Table C1 and Table C2 in Appendix
C.
Table 4-6 Average Pavement Treatment Costs per Lane-Mile
Treatment Flexible
Reconstruction/Replacement $ 1,394,329b $ 1,454,117b $ 1,394,329b Costs are expressed in Year 2002 constant dollars.
a. Labi and Sinha (2003).
b.Lamptey et al. (2004).
c.Assume PCC pavement is resurfaced with HMA.
4.4 Unit Costs of Highway Routine Maintenance
Average maintenance costs were obtained from models developed by Labi and Sinha (2003).
The average annual maintenance expenditure (AAMEX) models were developed for interstate and
pavement attributes. The models include all categories of maintenance. The expenditures were
reported in 1995 dollars per lane-mile and the average values are listed here:
• Interstate PCC – $1,093
• Interstates HMA –$1,100
• Non-Interstate HMA – $500
• Interstates COMP – $410
• Non-Interstate COMP - $590
Where two curves are provided for one road classification, the higher cost curve was used.
The average costs reflect the average of all pavement ages. The AAMEX models are illustrated in
Appendix D. The AAMEX values were adjusted to year 2002 dollars and are listed in Table 4-7.
Table 4-7 Average Annual Maintenance Costs per Lane-Mile
Facility Type Flexible Pavement (HMA)
Rigid (PCC)
Composite (COMP)
Interstate $1,335 $1,326 $497
Non Interstate $607 $1,326 $716
Labi and Sinha (2003).
Costs are expressed in Year 2002 dollars.
Maintenance costs were estimated in dollars per lane-mile as a function of PSI rather than
age. Unit costs are based on parameters associated with the amount of damage to the pavement at
each PSI level and the maintenance activities included crack sealing, surface patching and deep
CHAPTER 5 : PAVEMENT PRESERVATION NEEDS ANALYSIS
The network needs analysis method was used to establish pavement resurfacing and
reconstruction needs. This chapter describes the data and methodology used for the network
condition analysis approach. The unit pavement treatment costs developed by Lamptey et al. (2004),
as shown in Table 4-6, and the average annual maintenance expenditure costs (Labi and Sinha, 2003),
given in Table 4-7, were used for this analysis.
Two pavement deterioration rates were used in the analysis: 6 IRI and 8 IRI per year. The
analysis used IRI pavement condition levels as a trigger to initiate specific pavement treatments based
on the pavement condition ranges established by INDOT. All lane-miles were treated with regular
annual maintenance, using the AAMEX curves developed by Labi and Sinha (2003).
The data used in the manual method did not include information on shoulders, capacity, or
alignment deficiencies, and the need estimates therefore are based solely on improvements to the
mainline pavement and do not include costs for improvements in alignments, shoulder, or capacity.
Capacity improvement needs, such as pavement widening, are based on those identified in the
INDOT LRP. Safety needs in this manual method are based on an estimate of 9.4 million dollars per
year, in year 2002 constant dollars, for road segments only (excluding intersections) as identified in
the research project by Lamptey et al. (2004), which utilized the Indiana Safety and Congestion
Management Systems Software. For the present study, the safety improvement need at intersections
was based on improvements identified in the LRP.
5.1 Collection and Processing of Data
The 2001 pavement contracts database used in t he research by Lamptey et al. (2004) was
obtained for use as a source of pavement condition data. The contracts database was sorted to group
the pavements into three main categories: HMA, PCC, and Composite (HMA over PCC). The
pavements were then separated by location: Interstate, Non-Interstate NHS (on the National
Highway System), and Non-Interstate Non-NHS. The needs analysis was conducted on the
5.2 Methodology
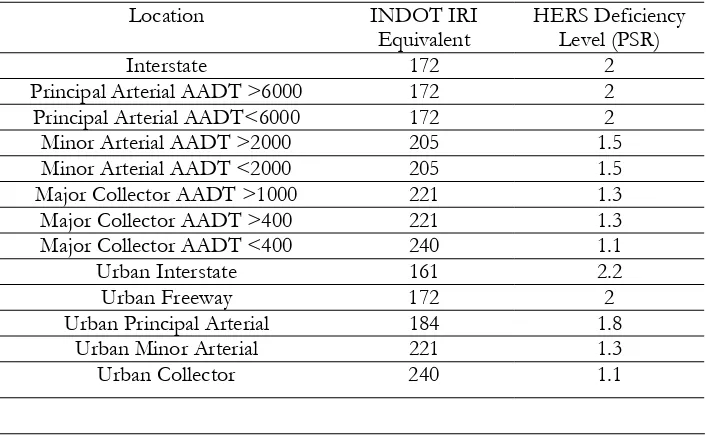
The same pavement condition threshold levels used in HERS-ST analysis were used to
trigger pavement treatments. Tables 5-1 and 5-2 illustrate the equivalent IRI deficiency thresholds
used for resurfacing and reconstruction treatments in the manual analysis method based on the
equivalent deficiency thresholds used for HERS-ST.
Location INDOT IRIa
Equivalent
HERS Deficiency b
Level (PSR)
Interstate 118 3.2
Principal Arterial AADT >6000 118 3.2
Principal Arterial AADT<6000 126 3.0
Minor Arterial AADT >2000 142 2.6
Minor Arterial AADT <2000 142 2.6
Major Collector AADT >1000 151 2.4
Major Collector AADT >400 151 2.4
Major Collector AADT <400 161 2.2
Urban Interstate 111 3.4
Urban Freeway 118 3.2
Urban Principal Arterial 126 3.0
Urban Minor Arterial 142 2.6
Urban Collectors 151 2.4
a. Calculated using Gulen (1994).
b.Default values from HERS-ST.
According to Table 5-1, a 3.2 PSR for a principal arterial is equivalent to 118 IRI, which
means that if a pavement condition falls below 118 IRI, then resurfacing is implemented. For urban
minor arterials, if the IRI falls below 142, then the pavement is resurfaced. Similarly, in Table 5-2, if
Location INDOT IRI Equivalent
HERS Deficiency Level (PSR)
Interstate 172 2
Principal Arterial AADT >6000 172 2
Principal Arterial AADT<6000 172 2
Minor Arterial AADT >2000 205 1.5
Minor Arterial AADT <2000 205 1.5
Major Collector AADT >1000 221 1.3
Major Collector AADT >400 221 1.3
Major Collector AADT <400 240 1.1
Urban Interstate 161 2.2
Urban Freeway 172 2
Urban Principal Arterial 184 1.8
Urban Minor Arterial 221 1.3
Urban Collector 240 1.1
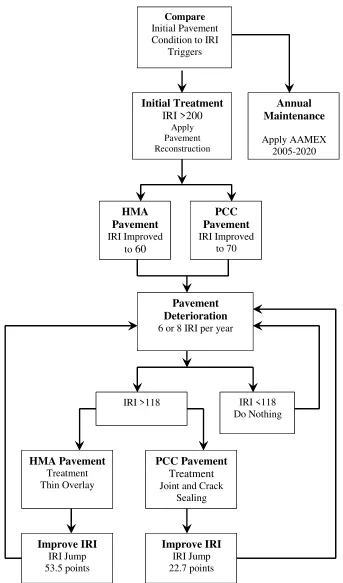
After sorting the pavement data by location and pavement material type, the data was
analyzed to determine the number of lane-miles that fell within the INDOT-specified IRI ranges
from excellent to poor. The good-to-excellent category was split into an upper and lower range of
good condition to create the option for additional pavement treatments for pavements in the
good-to-excellent range. The treatment IRI ranges were:
• Excellent – Good, IRI= 60 – 100
• Good, IRI=101 –-125
• Good – Fair, IRI = 126 –-150
• Fair, IRI = 151 – 200
• Poor, IRI = > 200
The initial IRI is the condition of the pavement at the time of the pavement condition
survey in year 2001. The initial pavement IRI was compared to the established trigger values that
would indicate the need for a resurfacing project, a reconstruction project, or a “do nothing” option.
Annual maintenance was applied each year to all pavements. The research by Lamptey et al. (2004)
determined the average increase in pavement condition or “performance jump” after specific
treatments were applied based on historical data from the contracts database. Two treatments used
in the network analysis utilized the performance jumps identified by Lamptey et al., specifically, thin
overlays and cleaning and sealing of joints on portland cement concrete pavement (PCCP). The
Forty-two pavement sections were used in the analysis of the pavement jump associated with HMA
overlays and 18 sections of pavement data were used to determine the pavement performance jumps
associated with cleaning and sealing of joints on concrete pavement. Based on the performance
jump information provided by Lamptey et al. (2004), the condition of the pavement should improve
by 53.3 IRI after an HMA overlay and improve by 22.7 IRI after cleaning and sealing of joints on
PCC pavement.
Treatment Type Average
Jump
No. of Sections HMA Overlay, Preventive Maintenance 53.5 42
PCCP Cleaning and Sealing Joints 22.7 18 Lamptey et al. (2004).
Pavements with less than 126 IRI at the start of the analysis were treated so as keep all of
them in that condition over the 15-year analysis period. In essence, any pavements in excellent
condition at the start of the analysis therefore would be maintained in that excellent condition
category. The trigger value for work on pavements with initial IRI of <126 was 118 IRI. Specific
treatments were selected to represent the typical treatments to be applied to pavements based on
their IRI. Flexible pavements (HMA) in good to fair condition (IRI 126 to 150) would be treated
with preventive maintenance or a thin HMA overlay specifically, while PCC pavements in good to
fair condition would be treated with joint and crack sealing. The typical treatment for pavements in
fair condition (IRI 151-200) was the Resurfacing Partial 3-R standards, while those in poor condition
would be replaced or reconstructed. Any pavement that received a Resurfacing Partial 3-R standards
or Reconstruction as the initial treatment was assumed to be returned to excellent condition,
specifically 60 IRI for HMA pavements and 70 IRI for concrete pavements, which are the accepted
IRI conditions for new pavements of those material types.
5.3 Interstate Initial Pavement Condition and Treatment
A total of 4,143 lane-miles of interstate were included in the analysis. A summary of the
initial pavement conditions, as well as the initial treatment chosen for the interstate pavement data,
are provided in Table 5-4. Approximately, 92 percent of the interstate system was in excellent
condition; 97 percent was in excellent or good condition; and there were no lane-miles on the
Figure 5-1 Distribution of Interstate Pavement as of Year 2001
Table 5-4 Interstate HMA Pavement Treatment Thresholds
In year 2001, there were no treatments applied to 669 lane-miles of highway because their
initial IRI exceeded 118 IRI (the trigger value). Eleven lane-miles in the good-fair pavement
condition range met the criteria for treatment as their average IRI was 145 with the trigger value for
treatment was an IRI greater than 134. A thin overlay preventive maintenance treatment was applied
to these sections in year 2001, thereby decreasing their IRI by 53.5 units. In separate scenarios the
pavements were simulated to deteriorate by six or eight IRI and when they again reached a condition
that exceeded 134 IRI another treatment of thin overlay was simulated, thereby keeping the
pavements in good-to-fair condition at the start of the analysis from deteriorating to the lower
condition levels such as fair or poor.
Tables 5-5 and 5-6 illustrate the initial treatments applied to the PCC and COMP interstate
pavements. The methodology used for the treatment of pavements that were initially in excellent
condition, such as the interstate pavements, as well as for the good to fair pavements is illustrated in
Figure 5-2.
Condition (IRI) Deficiency Level IRI
All Conditions n/a n/a 892 Maintenance (AAMEX)
Condition (IRI) Deficiency Level IRI
Existing Average IRI
Lane-miles “Initial” Treatment
(Year 2001)
Excellent-Good
(IRI= 60 – 100) Trigger >118 73 2771 Do Nothing
Good
(IRI=101 -125) Trigger >118 114 41 Do Nothing
Good – Fair
(IRI = 126 -150) Trigger >134 132 27
Preventive Maintenance Fair
(IRI = 151 - 200) Trigger >151 163 5
Resurfacing Partial 3-R Standards Poor
(IRI = > 200) Trigger >200 218 2 Reconstruction
All Conditions n/a n/a 2846 Maintenance
Figure 5-2 Methodology used for Excellent, Good and Good-To-Fair Pavements