Original Article
Seat Pressure Distribution Characteristics During 1 Hour Sitting in
Of
fi
ce Workers With and Without Chronic Low Back Pain
Nipaporn Akkarakittichoke, Prawit Janwantanakul
*Department of Physical Therapy, Faculty of Allied Health Sciences, Chulalongkorn University, Bangkok, Thailand
a r t i c l e
i n f o
Article history:
Received 8 March 2016 Received in revised form 20 September 2016 Accepted 16 October 2016 Available online 17 February 2017
Keywords:
chronic low back pain office worker sitting posture
a b s t r a c t
Background:Low back pain (LBP) is a major problem for office workers. Individuals adopting poor postures during prolonged sitting have a considerably increased risk of experiencing LBP. This study aimed to investigate seat pressure distribution characteristics, i.e., average pressure, peak pressure ratio, frequency of postural shift, and body perceived discomfort (BPD), during 1 hour of sitting among office workers with and without chronic LBP.
Methods:Forty-six participants (chronic LBP¼23, control¼23) typed a standardized text passage at a computer work station for an hour. A seat pressure mat device was used to collect the seat pressure distribution data. Body discomfort was assessed using the Body Perceived Discomfort scale.
Results:Office workers with chronic LBP sat significantly more asymmetrically than their healthy counterparts. During 1-hour sitting, all workers appeared to assume slumped sitting postures after 20 minutes of sitting. Healthy workers had significantly more frequent postural shifts than chronic LBP workers during prolonged sitting.
Conclusion:Different sitting characteristics between healthy and chronic LBP participants during 1 hour of sitting were found, including symmetry of sitting posture and frequency of postural shift. Further research should examine the roles of these sitting characteristics on the development of LBP.
Ó2017, Occupational Safety and Health Research Institute. Published by Elsevier. This is an open access article under the CC BY-NC-ND license (http://creativecommons.org/licenses/by-nc-nd/4.0/).
1. Introduction
Low back pain (LBP) is a major problem for office workers. For example, the 1-year prevalent rate of LBP in Thai and Greek office workers was 34% and 38%, respectively[1,2]. Between 14% and 23% of office workers in Thailand and Denmark reported a new onset of (acute) LBP during the 1-year follow-up [3,4]. A review of the literature revealed that the annual prevalence of chronic LBP in general population ranged from 15% to 45%, with a point prevalence of 30%[5]. LBP is often the cause of significant physical and psy-chological health impairments. It also affects work performance and social responsibilities. As a result, LBP can be a great burden on patients and society [6]. Its total socioeconomic burden in the United States in 2006 exceeded US$100 billion[7], whereas in the Netherlands the total cost of LBP in 2007 was estimated atV3.5
billion[8].
Office workers are usually required to sit for long hours in front of a computer. Although prolonged sitting by itself was not asso-ciated with the risk of developing LBP [9], occupational groups
exposed to poor postures while sitting for longer than half a day have a considerably increased risk of experiencing LBP[10]. Pre-vious studies showed that, when sitting, individuals with LBP placed their spines closer to the end range than their healthy counterparts [11,12]. Sitting closer to the end range of spinal movement may lead to increased passive system loading and reduced activity of spinal stabilizing muscles[11]. Individuals with LBP have also been shown to assume more static postures and have large/infrequentdrather than subtle/regulardspinal movements while sitting [13]. Prolonged, low-level static load on the back during sitting means continuous and relatively high activity of a fraction of the motor units in the muscles[14]. Contraction level of the trunk extensors of as low as 2% of maximum voluntary force has been shown to impair oxygenation and create waste product buildup of this musculature[15]. Prolonged sitting also induces discomfort in the low back[16], which is a strong predictor of LBP
[17], and prolonged work with a computer was associated with two predictive factors of musculoskeletal problem, i.e., infrequent postural change and presence of discomfort while sitting[18].
*Corresponding author. Department of Physical Therapy, Faculty of Allied Health Sciences, Chulalongkorn University, 154 Rama I Road, Soi Chula 12, Pathumwan, Bangkok 10330, Thailand.
E-mail address:[email protected](P. Janwantanakul).
Contents lists available atScienceDirect
Safety and Health at Work
j o u r n a l h o m e p a g e :w w w . e - s h a w . o r g
2093-7911/$esee front matterÓ2017, Occupational Safety and Health Research Institute. Published by Elsevier. This is an open access article under the CC BY-NC-ND license
(http://creativecommons.org/licenses/by-nc-nd/4.0/).
Sitting is an active, not a static, phenomenon, involving a regular spinal movement or a postural change during sitting. Thus, short-duration investigations of sitting posture may not completely represent time-dependent biological responses to prolong sitting. A previous study showed that 40% of workers performing an hour of seated typing developed LBP[19]. Also, perceived low back discom-fort significantly increased after 1 hour of sitting compared with baseline values, regardless of the sitting posture[20]. Seat pressure distribution measurement is one of the methods to study sitting for long periods. Although seat pressure distribution measurement is not a direct measure of sitting posture, several previous studies indicated a correlation between seat pressure distribution and sitting postures
[21e24]. High pressure at the ischial tuberosities has also been shown
to be closely associated with high load to the spine[22,23,25], which may lead to accelerating disk degeneration and increased capsu-loligamentous loading, resulting in LBP[26]. Seat pressure distribu-tion measurement is a reliable and objective measure associated with the subjective rating of perceived discomfort[27]. The general pur-pose of this study was to investigate sitting posture, using seat pressure distribution measurement, and body perceived discomfort (BPD) during 1 hour of sitting in office workers with and without chronic LBP. Specifically, the primary aim was to describe the char-acteristics of average pressure (AP), peak pressure ratio (PP ratio), and frequency of postural shift during prolonged sitting. The secondary aim was to compare the PP ratio between comfortable/neutral sitting postures. The hypothesis of this study was that there were differences in seat pressure distribution characteristics and BPD between office workers with and without chronic LBP. Such information would provide basic information for the development of a guideline to promote healthy sitting to prevent LBP in those who need to engage in prolonged sitting.
2. Materials and methods
2.1. Participants
A pilot study with the same methodology to this study was conducted on a convenience sample of 20 full-time office workers (chronic LBP¼10; control¼10). The seat pressure data (i.e., AP, PP) and Borg CR-10 scale of discomfort were then used to calculate
sample size f ¼
the statistical power was set at 80%[28]. A power analysis revealed that the study had sufficient power (80%) to detect a small to moderate effect (f¼0.212e0.322). As a result, a convenience sam-ple of 46 (10 males, 36 females) full-time office workers were recruited into the study. Participants were divided into two groups: chronic LBP (n¼23) and control groups (n¼23). Age, sex, and body
mass index (BMI) were matched between groups. There were 5 males and 18 females in each group. The definition of office workers in the present study were those working in an office environment and generally worked with a computer, participated in meetings, read documents, and contact people by telephone. Individuals in both chronic LBP and healthy groups were included in the study if they were 20e45 years of age and had reported sitting at least 4 hours on a working day. Healthy participants were included in the healthy group if they reported no LBP or a period of LBP pain lasting less than 1 day or LBP with pain intensity on a visual analogue scale
3 on a 100-mm scale over the 6 months prior to the testing period
[29,30]. Inclusion criteria for chronic LBP participants were having nonspecific chronic LBP and reporting prolonged sitting as one of the aggravating factors of the current LBP episode. Nonspecific chronic LBP was defined as LBP with or without pain radiating to one or both legs, in the absence of any specific pathological
condition, has persisted for at least 3 months, and has resulted in pain on at least half the days in the past 6 months[31]. The area of LBP was defined according to the standardized Nordic question-naire, i.e., the area between the 12th rib and the inferior gluteal
folds, with or without radiation to one or both legs[32].
Both chronic LBP and healthy groups were excluded if they had current or past history of known spinal disorders, signs of neuro-logical deficit (i.e., muscle weakness or loss/disturbance of sensa-tion), osteoarthritis, rheumatoid arthritis, gout, kidney diseases, open wound or contusion at the buttocks or posterior thigh region, hemorrhoids, and current pregnancy. They were also excluded if they had a BMI of <18 kg/m2 or >23 kg/m2 [33]. A self-administered questionnaire was used to screen participants into the study. After they were given information about the study, all participants signed a consent form. The study was approved by the University Human Ethics Committee.
2.2. Equipment
The seat pressure distribution data were recorded using a seat pressure mat device (ConforMat; Tekscan Inc., Boston, MA, USA) with a specific-designed program (ConforMat Research, version 7.10c; Tekscan Inc.) and continuously sampled at a frame frequency of 5 Hz throughout the 1-hour period[34]. The device consists of 1024 (3232) square (1515 mm2) pressure sensing elements, which were calibrated with an upper limit threshold of 32.5 kPa (250 mmHg) and a lower limit threshold of 0.7 kPa (5 mmHg). The calibration was performed according to the manufacturer’s in-structions using a linear calibration method. The autoadjust sensitivity was selected. The seat pressure distribution was deter-mined through three variables: the AP, PP, and dispersion index (DI), which are defined as follows.
(1) AP is the total pressure divided by the total sitting contact surface area.
(2) PP is the maximal pressure around ischial tuberosity. This is calculated between the maximum four adjacent sensors of seat pressure mapping. The PP ratio was calculated by the higher PP side to lower PP side. A higher PP ratio indicates more asym-metrical sitting between left and right sides during sitting; (3) DI, a relative measure of the load on the sitting surface, refers to
the load on one tuberal zone divided by the total load on the sitting surface.
The seat pan was divided into two horizontal regions (anterior seat or thigh region and posterior seat or buttock region), which allowed for the description of the pressure distribution of each region. In addition, the locations of PP along the left/right on the seat were located.
The Borg CR-10 scale, a measuring tool for postural discomfort, was used to determine each participant’s level of discomfort during 1-hour sitting. The Borg CR-10 scale and a body chart from a standardized Nordic questionnaire[32]were presented in such a way that the participants could indicate how much discomfort was felt in the low back (on a scale of 0e10; where 0¼no discomfort and 10¼extreme discomfort)[35].
2.3. Experimental procedure
(widthlengthheight¼45 cm50 cm11.5 cm) with a density
of 40.4 kg/m3. The pressure mapping device wasfixed to the seat pan using adhesive tape. The initial seat position was hips and knees at 90
flexion and feet in full contact with thefloor. The distance be-tween the monitor and the participant was about 18e30 inches, approximately at eye level. No backrest support or lumbar pad was used in this study. Participants were instructed to continuously type a standardized text passage at their own normal pace for an hour.
At the start of 1-hour sitting, each participant sat in a comfort-able sitting posture for a minute then changed to a neutral sitting posture for another minute. The neutral sitting posture consisted of sitting with slight lumbar lordosis and a relaxed thorax[36]. After completion of sitting in the neutral sitting posture, participants were able to change their sitting posture freely with constraints imposed on leg crossing or lifting the buttocks. During the 1 hour of sitting, the Borg score was calculated at the 10th, 20th, 30th, 40th, 50th, and 60thminutes of the sitting period. Prior to actual testing,
participants were given a practice run of about 5 minutes in a room with a constant temperature of 25C. The purpose of the practice
run was to allow participants to clearly understand the experiment procedure and to familiarize themselves with the experimental setup. As a result, the potential learning effect, which might affect the measurement outcomes, was minimized.
2.4. Reliability
Prior to data collection, the between-session repeatability of AP, PP, and Borg CR 10 scale of discomfort were assessed on 20 in-dividuals (chronic LBP¼10, control¼10) from the pilot study. The
data were collected according to the procedure described above. Each participant was tested twice on two separate days with at least a 24-hour lapse between measurements. The intraclass cor-relation coefficients (ICC; 3,1) were calculated[37].
2.5. Data analysis
The measurement outcomes in this study were AP, PP ratio, postural shift, and Borg scores. The raw pressure data (i.e., AP, PP) were collected, displayed, and extracted using the ConforMat Research, version 7.10c (Tekscan Inc.). To eliminate the artifact caused by movement of postural switching, the data that fell in the posture switching stage (1stminute for comfortable sitting posture
and 2ndminute for neutral sitting posture) were discarded. Every 10 minutes of AP at anterior seat, AP at posterior seat, PP (left) and PP (right) data from the 1-hour sitting period (i.e., 3rd
e10thminutes, 11the20th minutes, 21ste30th minutes, 31ste40th minutes, 41ste 50thminutes, and 51ste60thminutes) were retrieved for analysis. Data from the 3rdto 10thminutes were regarded as the baseline.
The DI data of both ischial tuberosities were analyzed and used to define postural shifts. The raw data from the pressure mapping device were exported in ASCII (American Standard Code for Infor-mation Interchange) format. A MATLAB script, version 7.12.0.635 (The MathWorks Inc., Nattick, MA, USA) was used to calculate a defined region that was expected to surround the ischial tuberos-ities; this region was defined by a zone of 66 pressure sensors (99 cm) to calculate the DI. The sum of the mean DI values of both ischial tuberosities and the ratio of the mean DI values of both ischial tuberosities were calculated to identify posture shifts in the sagittal and frontal planes, respectively. A posture shift was iden-tified when the signal exceeded the threshold (10% for both sagittal and frontal movements)[38]. Posture shifts that occurred within 1 minute were regarded as one posture shift. A combination of postural shifts in the frontal and sagittal planes were combined to represent the postural shifts in 1 hour of sitting[38].
2.6. Statistical analysis
ShapiroeWilk test was performed to check the distribution of the data, and the results indicated normal distribution. The char-acteristics of participants were compared between groups using the independentttest for continuous data and the Chi-square test for noncontinuous data. The effects of sitting time, group, and their interaction on AP at anterior seat, AP at posterior seat, PP ratio, and frequency of postural shift were examined using a two-way anal-ysis of variance (ANOVA) for repeated measures. When a significant interaction between independent variables was detected, the effect of each variable was examined separately using one-way ANOVA. The Bonferroni procedure was performed to determine whether two selected means significantly differed from each other.
The effects of sitting time, group, and their interaction on the Borg scores were investigated using a two-way analysis of covari-ance (ANCOVA), with the Borg score at the beginning as the co-variate. When a significant interaction between independent variables was detected, the effect of each variable was examined separately using one-way ANCOVA. The relationships between the Borg score and seat pressure distribution variables and frequency of postural shift during 1 hour of sitting was examined using the Pearson correlation coefficients. The effects of comfortable/neutral sitting postures, group, and their interaction on PP ratio were examined using a two-way ANOVA for repeated measures. Statis-tical analyses were performed using the SPSS statistics software, version 17.0 (SPSS Inc., Chicago, IL, USA). For all tests, significance was determined using the 0.05 level.
3. Results
3.1. Testeretest reliability
The reliability results demonstrated moderate to excellent reli-ability of measurement variables (i.e., AP, PP, and Borg CR 10 scale of discomfort) with the ICC (3,1) scores ranging from 0.71 to 0.97 for AP, ranging from 0.72 to 0.97 for PP, and from 0.76 to 1.00 for Borg scores.
3.2. Characteristics of participants
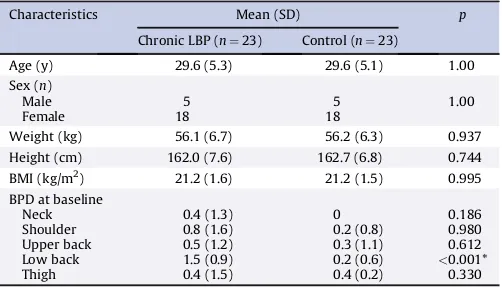
Table 1shows the characteristics of participants in both groups. There was no significant difference in any of the characteristics of the participants, except for the BPD scores at the low back. The Borg
Table 1
Characteristics of participants (n¼46)
Characteristics Mean (SD) p
Weight (kg) 56.1 (6.7) 56.2 (6.3) 0.937
Height (cm) 162.0 (7.6) 162.7 (6.8) 0.744
BMI (kg/m2) 21.2 (1.6) 21.2 (1.5) 0.995
BPD at baseline
Neck 0.4 (1.3) 0 0.186
Shoulder 0.8 (1.6) 0.2 (0.8) 0.980
Upper back 0.5 (1.2) 0.3 (1.1) 0.612
Low back 1.5 (0.9) 0.2 (0.6) <0.001*
Thigh 0.4 (1.5) 0.4 (0.2) 0.330
*p<0.05.
score of the low back at baseline in the chronic LBP group was significantly greater than that in the control group (p<0.001).
3.3. Seat pressure distribution during 1-hour sitting
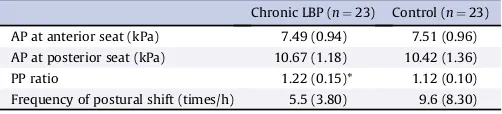
Table 2summarizes AP at anterior seat, AP at posterior seat, PP ratio, and frequency of postural shift during 1-hour sitting.
3.3.1. AP at anterior seat
The two-way ANOVA indicated no significant effect for sitting time (F5,220¼1.952,p¼0.09), group (F1,44¼0.130, p¼0.91), and their interaction (F5,220¼0.657,p¼0.68) on the AP at anterior seat
during 1 hour of sitting.
3.3.2. AP at posterior seat
The two-way ANOVA indicated significant effects for sitting time (F5,220¼11.690,p<0.001) on the AP at posterior seat during 1-hour sitting. No significant effect for group (F1,44¼0.390,
p¼0.54) and interaction between sitting time and group
(F5,220¼0.380, p¼0.86) was detected. Post hoc Bonferroni tests
indicated that AP at posterior seat increased progressively and significantly from baseline (i.e., the 3rd
e10th minutes) after 20 minutes of sitting in both chronic LBP and control groups (p<0.05; Fig. 1).
3.3.3. PP ratio
The two-way ANOVA indicated significant effects for sitting time (F5,220¼9.290,p<0.001) and group (F1,44¼10.430,p¼0.002)
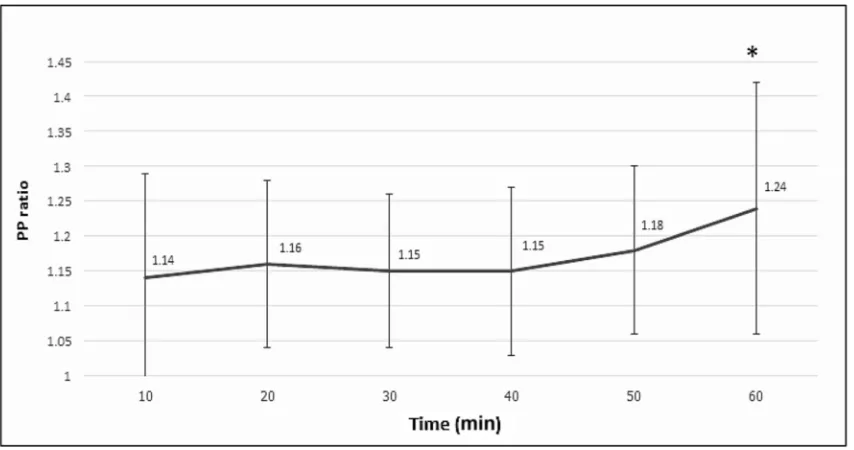
on the PP ratio during 1-hour sitting. No significant effect for interaction between sitting time and group (F5,220¼0.360, p¼0.87) was found.Post hocBonferroni tests showed that the PP ratio at the 51st
e60thminutes was significantly greater than that at baseline (i.e., the 3rde10thminutes) in both chronic LBP and control groups (p<0.05;Fig. 2). In addition, the PP ratio in the chronic LBP group was significantly greater than that in the control group (p<0.05;Table 2). Based on PP ratio data, which is an index of asymmetrical sitting posture, those with chronic LBP sat signifi -cantly more asymmetrically than their healthy counterparts during 1 hour of sitting.
3.3.4. Frequency of postural shift
The two-way ANOVA indicated significant effects for sitting time (F5,220¼3.370,p¼0.01) and group (F1,44¼4.630,p¼0.04) on frequency of postural shift (the frontalþsagittal planes). No
sig-nificant effect for the interaction between sitting time and group was found (F5,220¼0.350,p¼0.88).Post hocBonferroni tests
indi-cated that frequency of postural shifting after 40 minutes of sitting was significantly greater than that at baseline (i.e., the 3rd
e10th minutes) in both chronic LBP and control groups [baseline mean (95% confidence interval, CI), 0.7 (0.4e1.0) times; 41the50thminute: 1.3 (1.0e1.7) times; 51the40th minute: 1.7 (1.2e2.1) times] (p<0.05). In addition, frequency of postural shift in 10 minutes during 1-hour sitting in the chronic LBP group [0.9 (0.5e1.4) times]
was significantly lower than that in the control group [1.6 (1.1e2.1) times] (p<0.05).
3.4. Body perceived discomfort
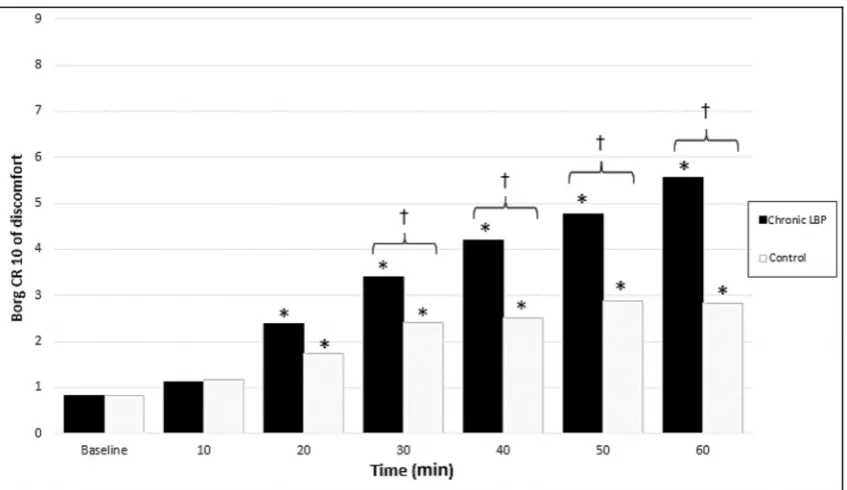
A two-way ANCOVA, with the Borg score at the beginning as the covariate, indicated significant effects for sitting time (F6,258¼63.0, p<0.001), group (F1,43¼14.940,p<0.001), and their interaction (F6,258¼12.310,p<0.001) on Borg scores at the low back. Thus, follow-up analyses were performed using one-way ANCOVA to investigate the effect of sitting time within each group and the effect of group for each sitting period.
Investigation of the effect of sitting time in each group revealed that Borg scores at the low back were significantly affected by the sitting time for both groups (F6,3¼39.10,p<0.001 for chronic LBP;
F6,38¼7.310,p¼0.001 for control group).Post hocBonferroni tests showed that the Borg scores in both chronic LBP and control groups were significantly greater than those at baseline (i.e., at the start of testing) after 10 minutes of sitting (p<0.05;Fig. 3).
Investigation of the effect of group on each time point revealed that Borg scores at the low back were significantly affected by group after 20 minutes of sitting (p<0.05). Post hoc Bonferroni tests indicated that the Borg scores in the chronic LBP group were significantly greater than those in the control group (p<0.05; Fig. 3).
3.5. Relationships between BPD and AP, PP ratio, and frequency of postural shift
Table 3shows the results of the correlations between the Borg score and seat pressure distribution variables and frequency of postural shift during 1 hour of sitting. Significant correlations be-tween the Borg score and AP at posterior seat and frequency of postural shift during 1 hour of sitting were detected (p<0.05).
3.6. Comfortable and neutral sitting posture
The two-way ANOVA indicated significant effects for sitting posture (F1,44¼11.360, p¼0.002) and group (F1,44¼11.220, p<0.02). No significant effect for interaction between sitting posture and group was found (F1,44¼0.130, p¼0.72). Post hoc
Bonferroni tests revealed that the PP ratios for both comfortable and neutral sitting postures in the chronic LBP group were signif-icantly greater than those for the control group [chronic LBP group: mean (95% CI)¼1.24 (1.18e1.3); control group: 1.1 (1.0e1.63)] (p<0.05).
In addition, the PP ratio in neutral sitting posture was signifi -cantly lower than that in the comfortable sitting posture in both groups [neutral sitting posture: mean (95% CI)¼1.14 (1.1e1.18); comfortable sitting posture¼1.2 (1.15e1.36)] (p<0.05).
4. Discussion
Thefindings of this study demonstrate that office workers with chronic LBP sat significantly more asymmetrically, i.e., sitting with trunk leaning toward either left or right side, than their healthy counterparts in both comfortable and neutral sitting postures. During 1 hour of sitting, both chronic LBP and healthy workers appeared to assume slumped sitting postures after 20 minutes of sitting, which may partly be explained by increased discomfort experienced in the low back. Healthy workers had significantly more frequent postural shifts than chronic LBP workers during prolonged sitting, despite chronic LBP participants reporting significantly greater low back discomfort than their healthy coun-terparts. Significantly greater asymmetrical sitting posture and
Table 2
Mean (SD) of average pressure (AP) at anterior seat, AP at posterior seat, peak pressure (PP) ratio, and frequency of postural shift during 1-hour sitting in the chronic low back pain (LBP) and control groups
Chronic LBP (n¼23) Control (n¼23)
AP at anterior seat (kPa) 7.49 (0.94) 7.51 (0.96)
AP at posterior seat (kPa) 10.67 (1.18) 10.42 (1.36)
PP ratio 1.22 (0.15)* 1.12 (0.10)
more frequent postural shift were found toward the end of the 1-hour sitting period in both chronic LBP and control groups.
Office workers with chronic LBP had significantly greater PP ratio, which is an index of asymmetrical sitting posture, than their healthy counterparts in both comfortable and neutral sitting pos-tures. Differences in PP ratio between chronic LBP and control
groups remained throughout the 1-hour sitting period. Patients with chronic LBP have been shown to demonstrate poorer postural control of the lumbar spine than healthy controls [39]. Pelvic asymmetry has also been shown to cause higher stress on the lumbar spine in individuals with LBP[40]and changes in soft tissue tightness[41], thus making the spine susceptible to injury. Neutral
Fig. 1.Mean (standard deviation) of average pressure (AP) distribution at posterior seat during 1-hour sitting of all participants (n¼46). * Significantly different from baseline, i.e., the 3rd
e10thminutes;p<0.05.
Fig. 2.Mean (standard deviation) of peak pressure (PP) ratio during 1-hour sitting of all participants (n¼46). * Significantly different from baseline, i.e., the 3rd
sitting posture, consisting of sitting with slight lumbar lordosis and a relaxed thorax, has been proposed as an optimal seat posture at work[36,42]. Neutral sitting posture was associated with increased internal oblique and transversus abdominis muscles activity compared with slumped sitting posture[11,16]. The current study showed that asymmetry in the sitting posture in chronic LBP par-ticipants reduced significantly when they sat in a neutral sitting posture, although it still persisted and was greater than that in healthy participants. The results lend further support to the notion that the neutral sitting posture, which leads to more symmetrical sitting posture, is healthy for the low back.
After 20 minutes of sitting, both participants with and without chronic LBP assumed sitting posture with significantly increased AP at posterior seat, indicating pelvic backward tilting or slumped sitting posture. Sitting with backward leaning is usually achieved by a backward pelvic rotation, resulting in lumbar kyphosis, and less than 25% of the body weight is transmitted to thefloor[43,44]. Backward rotation caused by long hours spent at the visual display terminal has been shown to generate load on the lumbar spine and increase intradiskal pressure[24,45,46]. When the seat position is not optimal, more muscular activity may be needed for stabilization resulting in a distinctly larger pressure in the disk[24]. Also, in-ternal oblique and transversus abdominis muscle fatigue was induced by slumped sitting posture after 1 hour of sitting in office workers[20]. Patients who habitually adopt passive spinal postures
or slump may decondition their lumbar stabilizing muscles [47], leading to increased passive system loading, injury, and pain[48]. Sustained stretch of passive lumbar structures in combination with essentially silent muscles may exacerbate LBP in office workers
[49]. One of several identified interventions to reduce the onset and severity of LBP included periodic rest breaks. Previous studies suggested that frequent, short, rest breaks resulted in short-term decrease in both discomfort and postural immobility [18,19]. In this study, low back discomfort in both chronic LBP and control groups was significantly greater than that at baseline after 10 mi-nutes of sitting, and a significant correlation between Borg score at the low back and AP at posterior seat was detected. Thus, based on thefindings, it is hypothesized that sitting for as short as 10 mi-nutes has a deteriorative effect on the low back by causing low back discomfort, which consequently induces the posterior seat posture. In terms of postural shift, healthy workers had more frequent postural shifts (the combination of shift in the frontal and sagittal planes) than chronic LBP workers by 43% during 1 hour of sitting. The frequency of postural shift in healthy participants reported in the present study (9.68.3 times/h) was in line with a previous study
(7.85.2 times/h)[35]. The current study also found a significant correlation between Borg score at the low back and frequency of postural shift. The results concur with a study by Dunk and Callaghan
[34], who reported less frequent postural shift in individuals with LBP compared with healthy individuals. Excessive load transmission and tissue deformation associated with prolonged loading in a certain posture may contribute to degenerative change in spinal tissues [50,51]. Postural shift has been found to increase subcu-taneous oxygen saturation, which positively influences tissue viability[38]. Also, postural shifts may alleviate low back discomfort and LBP during prolonged sitting through alternating activity be-tween different parts of the trunk muscles [14]. However, it is interesting to note that despite chronic LBP workers having signifi -cantly greater Borg scores than healthy workers after 20 minutes of sitting, chronic LBP workers changed their sitting postures less frequently than their healthy counterparts during 1-hour sitting. The
findings shed some light on the notion that sitting characteristics,
Fig. 3.Borg score at the low back during 1-hour sitting for chronic low back pain (LBP) and control groups. * Significantly different from baseline (i.e., at the start of testing).
ySignificantly different between groups;p<0.05.
Table 3
Pearson correlation coefficients between Borg score and seat pressure distribution variables [i.e., average pressure (AP) at anterior seat, AP at posterior seat, and peak pressure (PP) ratio] and frequency of postural shift of all participants (n¼46)
Borg score (r)
Borg score 1
AP at anterior seat 0.250
AP at posterior seat 0.996*
PP ratio 0.414
Frequency of postural shift 0.929*
particularly frequency of postural shift, may partly relate to the eti-ology of LBP in those required to sit for long periods.
A major strength of this study is that the characteristics of prolonged sitting were objectively and continuously assessed using a seat pressure mat device distribution measurement. Additionally, because LBP among office workers is unlikely to originate from identical causes, a distinct group of participants with chronic LBP was selected for the present studydthat is, those reporting sitting for at least 4 hours on a working day and prolonged sitting as one of aggravating factors of their current LBP episode. However, at least three main limitations are worth noting. First, owing to the cross-sectional design of the present study, it is not possible to estab-lish a causal relationship between exposure and outcome. Only the association between exposure and outcome was examined. Therefore, future study with a prospective study design is required to validate thefindings of this study. Second, in this study, a healthy participant was defined as one reporting no LBP or a period of LBP pain lasting less than 1 day or LBP with pain intensity on visual analogue scale3 on a 100-mm over the 6 months prior to the testing. Chronic LBP participants were those experiencing nonspecific LBP that persisted for at least 3 months and which has resulted in pain on at least half the days in the past 6 months. Only those with a BMI between 18 and 23 kg/m2were included in this
study. Different results may emerge with different definitions of healthy and symptomatic cases. Third, the task and sitting postures tested in this study were controlled. Participants were asked to continuously type a standardized text passage and were not allowed to cross their legs, lift their buttocks or use a back rest during testing. Variations in task performed and how a person sits may exist and influence outcome measurement. Further research on the effect of task and sitting posture on seat pressure distribu-tion and perceived body discomfort is recommended.
In summary, the results of the present study showed that, for both comfortable and neutral sitting postures, chronic LBP workers sat more asymmetrically than their healthy counterparts. During 1 hour of sitting, office workers with and without chronic LBP appeared to assume slumped sitting posture after 20 minutes of sitting. Healthy participants had significantly more frequent postural shifts than chronic LBP participants. Greater asymmetrical sitting posture and more frequent postural shift was detected toward the end of the 1-hour sitting period in both chronic LBP and control groups. Positive relationships between BPD and slump sitting posture and frequency of postural shift were also found during 1 hour of sitting in both chronic LBP and control groups. Further research should examine the roles of these sitting characteristics on the development of LBP in workers who are required to sit for long hours.
Conflicts of interest
The authors declare that there are no conflicts of interest.
Authors’contributions
The authors have contributed in the following ways: AN provided concept/research design, data collection, data analysis, and manu-script writing. PJ provided concept/research design and manumanu-script writing. All authors read and approved thefinal manuscript.
Acknowledgments
This study was funded by the 90thAnniversary of Chulalongkorn University Fund (Ratchadaphiseksomphot Endowment Fund, GCUGR1125582046M).
References
[1] Janwantanakul P, Pensri P, Jiamjarasrangsri V, Sinsongsook T. Prevalence of
self-reported musculoskeletal symptoms among office workers. Occup Med
(Lond) 2008;58:436e8.
[2] Spyropoulos P, Papathanasiou G, Georgoudis G, Chronopoulos E, Koutis H,
Koumoutsou F. Prevalence of low back pain in Greek public office workers.
Pain Physician 2007;10:651e9.
[3] Juul-Kristensen B, Søgaard K, Strøyer J, Jensen C. Computer users’risk factors
for developing shoulder, elbow and back symptoms. Scand J Work Environ
Health 2004;30:390e8.
[4] Sitthipornvorakul E, Janwantanakul P, Lohsoonthorn V. The effect of daily
walking steps on preventing neck and low back pain in sedentary workers: a
1-year prospective cohort study. Eur Spine J 2015;24:417e24.
[5] Manchikanti L, Singh V, Datta S, Cohen SP, Hirsch JA. Comprehensive review of
epidemiology, scope, and impact of spinal pain. Pain Physician 2009;12:E35e70.
[6] Manchikanti L, Singh V, Falco FJ, Benyamin RM, Hirsch JA. Epidemiology of low
back pain in adults. Neuromodulation 2014;17:3e10.
[7] Katz JN. Lumbar disc disorders and low-back pain: socioeconomic factors and
consequences. J Bone Joint Surg Am 2006;88:21e4.
[8] Lambeek LC, van Tulder MW, Swinkels ICS, Koppes LLJ, Anema JR, van
Mechelen W. The trend in total cost of back pain in the Netherlands in the
period 2002 to 2007. Spine (Phila Pa 1976) 2011;36:1050e8.
[9] Kwon BK, Roffey DM, Bishop PB, Dagenais S, Wai EK. Systematic review:
occupational physical activity and low back pain. Occup Med 2011;61:541e8.
[10] Lis A, Black K, Korn H, Nordin M. Association between sitting and occupational
LBP. Eur Spine J 2007;16:283e98.
[11] O’Sullivan PB, Mitchell T, Bulich P, Waller R, Holte J. The relationship between
posture and back muscle endurance in industrial workers withflexion-related
low back pain. Man Ther 2006;11:264e71.
[12] Womersley L, May S. Sitting posture of subjects with postural backache.
J Manipulative Physiol Ther 2006;29:213e8.
[13] O’Sullivan K, O’Keeffe M, O’Sullivan L, O’Sullivan P, Dankaerts W. The effect of
dynamic sitting on the prevention and management of low back pain and low
back discomfort: a systematic review. Ergonomics 2012;55:898e908.
[14] van DieËn JH, De Looze MP, Hermans V. Effects of dynamic office chairs on
trunk kinematics, trunk extensor EMG and spinal shrinkage. Ergonomics
2001;44:739e50.
[15] McGill S, Hughson R, Parks K. Lumbar erector spinae oxygenation during
prolonged contractions: implications for prolonged work. Ergonomics
2000;43:486e93.
[16] Waongenngarm P, Rajaratnam BS, Janwantanakul P. Perceived body
discom-fort and trunk muscle activity in three prolonged sitting postures. J Phys Ther
Sci 2015;27:2183e7.
[17] Hamberg-van Reenen HH, van der Beek AJ, Blatter BM, van der Grinten MP,
van Mechelen W, Bongers PM. Does musculoskeletal discomfort at work
predict future musculoskeletal pain? Ergonomics 2008;51:637e48.
[18] Fenety A, Walker JM. Short-term effects of workstation exercises on
muscu-loskeletal discomfort and postural changes in seated video display unit
workers. Phys Ther 2002;82:578e89.
[19] Sheahan PJ, Diesbourg TL, Fischer SL. The effect of rest break schedule on acute
low back pain development in pain and non-pain developers during seated
work. Appl Ergon 2016;53:64e70.
[20] Waongenngarm P, Rajaratnam BS, Janwantanakul P. Internal oblique and
transversus abdominis muscle fatigue induced by slumped sitting posture
after 1 hour of sitting in office workers. Saf Health Work 2016;7:49e54.
[21] Koo TKK, Mak AFT, Lee YL. Posture effect on seating interface biomechanics:
comparison between two seating cushions. Arch Phys Med Rehabil 1996;77:40e7.
[22] Makhsous M, Lin F, Bankard J, Hendrix RW, Hepler M, Press J. Biomechanical
effects of sitting with adjustable ischial and lumbar support on occupational low back pain: evaluation of sitting load and back muscle activity. BMC
Musculoskelet Disord 2009;10:17.
[23] van Geffen P, Reenalda J, Veltink PH, Koopman BFJM. Decoupled pelvis
rota-tion in sitting: a passive morota-tion technique that regulates buttock load
asso-ciated with pressure ulcer development. J Biomech 2009;42:1288e94.
[24] Zenk R, Franz M, Bubb H, Vink P. Technical note: spine loading in automotive
seating. Appl Ergon 2012;43:290e5.
[25] Gyi DE, Porter JM, Robertson NKB. Seat pressure measurement technologies:
considerations for their evaluation. Appl Ergon 1998;29:85e91.
[26] Marras WS, Davis KG, Ferguson SA, Lucas BR, Gupta P. Spine loading
charac-teristics of patients with low back pain compared with asymptomatic
in-dividuals. Spine (Phila Pa 1976) 2001;26:2566e74.
[27] De Looze MP, Kuijt-Evers LFM, Van Dieën J. Sitting comfort and discomfort
and the relationships with objective measures. Ergonomics 2003;46:985e97.
[28] Portney LG, Watkins MP. Foundations of clinical research: applications to
practice. 3rd ed. Upper Saddle River, NJ: Pearson/Prentice Hall; 2009.
[29] Hush J, Michaleff Z, Maher C, Refshauge K. Individual, physical and
psycho-logical risk factors for neck pain in Australian office workers: a 1-year
lon-gitudinal study. Eur Spine J 2009;18:1532e40.
[30] Tsauo J-Y, Jang Y, Du C-L, Liang H-W. Incidence and risk factors of neck
discomfort: a 6-month sedentary-worker cohort study. J Occup Rehabil
2007;17:171e9.
[31] Deyo RA, Dworkin SF, Amtmann D, Andersson G, Borenstein D, Carragee E,
Panagis J, Rainville J, Tosteson T, Turk D, Von Korff M, Weiner DK. Focus article report of the NIH Task Force on Research Standards for Chronic Low
Back Pain. Clin Biomech 2014;30:701e12.
[32] Kuorinka I, Jonsson B, Kilbom A, Vinterberg H, Biering-Sorensen F,
Andersson G, Jørgensen K. Standardised Nordic questionnaires for the analysis
of musculoskeletal symptoms. Appl Ergon 1987;18:233e7.
[33] Anuurad E, Shiwaku K, Nogi A, Kitajima K, Enkhmaa B, Shimono K, Yamane Y.
The new BMI criteria for Asians by the regional office for the Western Pacific Region of WHO are suitable for screening of overweight to prevent metabolic
syndrome in elder Japanese workers. J Occup Health 2003;45:335e43.
[34] Dunk NM, Callaghan JP. Gender-based differences in postural responses to
seated exposures. Clin Biomech 2005;20:1101e10.
[35] Borg G. Psychophysical scaling with applications in physical work and the
perception of exertion. Scand J Work Environ Health 1990;16:55e8.
[36] O’Sullivan PB, Dankaerts W, Burnett AF, Farrell GT, Jefford E, Naylor CS,
O’Sullivan KJ. Effect of different upright sitting postures on spinalepelvic
curvature and trunk muscle activation in a pain-free population. Spine (Phila
Pa 1976) 2006;31:E707e12.
[37] Shrout PEFJ. Intraclass correlations: uses in assessing rater reliability. Psychol
Bull 1979;86:420e8.
[38] Reenalda J, Van Geffen P, Nederhand M, Jannink M, Ijzerman M, Rietman H.
Analysis of healthy sitting behavior: interface pressure distribution and
sub-cutaneous tissue oxygenation. J Rehabil Res Dev 2009;46:577e86.
[39] Radebold A, Cholewicki J, Polzhofer GK, Greene HS. Impaired postural control
of the lumbar spine is associated with delayed muscle response times in patients with chronic idiopathic low back pain. Spine (Phila Pa 1976) 2001;26:
724e30.
[40] Al-Eisa E, Egan D, Deluzio K, Wassersug R. Effects of pelvic asymmetry and low
back pain on trunk kinematics during sitting: a comparison with standing.
Spine (Phila Pa 1976) 2006;31:135e43.
[41] Cibulka MT. Understanding sacroiliac joint movement as a guide to the
management of a patient with unilateral low back pain. Man Ther 2002;7:
215e21.
[42] O’Sullivan K, O’Dea P, Dankaerts W, O’Sullivan P, Clifford A, O’Sullivan L.
Neutral lumbar spine sitting posture in pain-free subjects. Man Ther 2010;15:
557e61.
[43] Harrison D, Harrison S, Croft A, Harrison D, Troyanovich S. Sitting
biome-chanics: Part I. Review of the literature. J Manipulative Physiol Ther 1999;22:
594e609.
[44] Pope MH, Goh KL, Magnusson ML. Spine ergonomics. Annu Rev Biomed Eng
2002;4:49e68.
[45] Wu CS, Miyamoto H, Noro K. Research on pelvic angle variation when using a
pelvic support. Ergonomics 1998;41:317e27.
[46] Sato K, Kikuchi S, Yonezawa T. In vivo intradiscal pressure measurement in
healthy individuals and in patients with ongoing back problems. Spine (Phila
Pa 1976) 1999;24:2468e74.
[47] O’Sullivan PB, Grahamslaw KM, Kendell M, Lapenskie SC, Moller NE,
Richards KV. The effect of different standing and sitting postures on trunk muscle activity in a pain-free population. Spine (Phila Pa 1976) 2002;27:
1238e44.
[48] Cholewicki J, McGill SM. Mechanical stability of the in vivo lumbar spine:
implications for injury and chronic low back pain. Clin Biomech (Bristol, Avon)
1996;11:1e15.
[49] Mork PJ, Westgaard RH. Back posture and low back muscle activity in
female computer workers: afield study. Clin Biomech (Bristol, Avon) 2009;24:
169e75.
[50] Hedman TP, Fernie GR. Mechanical response of the lumbar spine to seated
postural loads. Spine 1997;22:734e43.
[51] McGill SM, Brown S. Creep response of the lumbar spine to prolonged full