Doctoral Dissertation Academic Year 2018
Design and Implementation of Participatory
Crowdsensing Platform for Efficient
Information Gathering for Smart Cities
A dissertation for the degree of Ph.D. in Media and Governance
Graduate School of Media and Governance
Keio University
Mina SAKAMURA
c⃝2018 Mina Sakamura [email protected]
Dissertation Abstract - Academic Year 2018
Design and Implementation of Participatory Crowdsensing Platform for Efficient Information Gathering for Smart Cities
The concept of smart city, where information and communication technology (ICT) is utilized to improve the efficiency of urban management, has drawn a growing attention for sustainable development. Participatory crowdsensing is one of funda-mental techniques to accelerate the development of smart cities where a large group of individuals having mobile devices collectively share data and extract information. In participatory crowdsensing, there are task setters who define an object of sensing as a task, and task executors who actively contribute sensing data to achieve the task. To make practical use of participatory crowdsensing, it is necessary to design a platform considering the relationship between task setters and executors. How-ever, the method of designing such a platform has not been systematically organized, therefore only a limited number of platforms have been introduced to cities.
The goal of this dissertation is to study the design and implementation of par-ticipatory crowdsensing platform to enable efficient data collection for smart cities. This research proposes 3 models, according to the relationships among task setters, task executors and owners of platform that provides functions such as task setting and execution for smart cities: in the cases of a)platform owners, task setters and task executors belong to the same organization, b)platform owners and task setters belong to the same organization but task executors do not, and c)platform owners belong to a different organization from task setters and task executors. Regarding a), Minarepo is proposed to realize efficient data collection inside the organization. Through experimental deployment for over 2 years, the time spent for each reporting has been shortened to about half and information collection that can be utilized for administrative work was achieved. Regarding b), MinaQn is proposed where task setters can define and distribute sensing tasks on the web platform. Based on the experiment in cooperation with three cities, 1278 response data were obtained in 2 weeks against daily questions. Regarding c), a platform called Lokemon is proposed where task setters and executors can have free exchange of sensing tasks. From our experiments, the effect of attracting users to Point of Interests (PoIs) was confirmed and also the number of autonomous posting was attained about 2 times. Overall, it was confirmed that the design proposed in this research contributes to efficient information gathering for smart cities.
Keywords: Participatory crowdsensing, mobile sensing, smart cities, human com-puter interaction(HCI), social computing
博士論文要旨 - 2018年度 スマートシティに向けた効率的な情報収集のための 参加型センシングプラットフォームデザイン及び構築 近年,持続可能な社会に向け,情報技術を活用し効率的な都市運営を行うスマートシティ への注目が高まっている.また,携帯端末の大幅な普及に伴い,人々が携帯端末を通して 情報をクラウド上に発信する機会が増えた.この機会を活用し,人々から情報収集を行う 手法の一つに参加型センシングがある.参加型センシングは,センシングを行いたい主体 がセンシング対象の情報を含むセンシングタスクを定め(タスク設定者),携帯端末を持つ 人々がそのタスクへの参加を意識して該当する情報を投稿する(タスク実行者)ことで達 成されるセンシング手法である.参加型センシングを実社会において適切に活用すること で,効率的に人々や地域に関する情報収集を行い,より効果的なサービスを提供すること が可能となる.参加型センシングの応用には,誰が誰にセンシングタスクを設定するのか というタスク設定者とタスク実行者の関係に応じてプラットフォームを適切に設計する必 要がある.しかし,両者の関係に応じたプラットフォームのデザイン法は体系化されてい ない.そのため個々のデザインの手間がかかり都市における導入事例は限定的であった. 本論では,上記課題解決を可能とする参加型センシングプラットフォームをデザインし 構築することで,スマートシティに向けた効率的な情報収集を行う.スマートシティにお ける参加型センシングでは,タスク設定者,タスク実行者,そして,スマートシティに向 けタスクの設定や実行機能を提供し情報収集を実現するプラットフォームの所持者が存在 する.本研究では,a)プラットフォーム所持者,タスク設定者,タスク実行者が同一組織 に所属する場合,b)プラットフォーム所持者とタスク設定者が同一組織,タスク実行者が 異組織に所属する場合,c)タスク設定者とタスク実行者がプラットフォーム所持者と異組 織に所属する場合に分け,各モデルを実現するプラットフォームを実環境で評価した. a)に関して,組織内の情報収集効率化を図ったプラットフォーム「みなレポ」を提案・ 開発した.主に藤沢市における2年以上の実運用により,1件あたりの報告書類作成時間 が半分程度に短縮し,業務に必要な情報収集・活用が確認された.b)に関して,タスク設 定者が設定した任意のタスクに対してWebページ上でタスクを実行することのできるプ ラットフォーム「MinaQn」を提案・開発し,情報収集の効率化を図った.3都市における 実証実験の結果,日替わりの質問に対し2週間で計1278個の回答を得た.c)に関して,
関心のある地域や場所(Point of Interest, PoI)にそのPoIの特徴を持ったモンスターア
バターを設置し,PoI内にいる人々がそのモンスターになりきって情報投稿できるプラッ
トフォーム「Lokemon(Location monster)」を提案・開発した.実証実験の結果,モンス
ター設置によるPoIへの誘引効果や,その場からの投稿の創出が約2倍確認された.総じ
て,本デザインがスマートシティに向けた効率的な情報収集に寄与することが確認された.
キーワード: 参加型センシング,モバイルセンシング,スマートシティ,ヒューマン・コ
ンピュータ・インタラクション(HCI),ソーシャルコンピューティング
Acknowledgements
The completion of this thesis would not have been possible without the help, support and guidance of many people. Nine years have passed since I entered the university and started my research life. To all of them I want to express my sincere gratitude.
First and foremost, I would like to thank my supervisor Professor Jin Nakazawa for his constructive advice and encouragement. I really appreciate that he always gave me warm encouragement. I would like to thank my committee members, Professor Hideyuki Tokuda, Professor Jun Murai and Professor Osamu Nakamura for their great support and invaluable advice. Thank you very much for taking the time to support and guide me throughout this degree. I would like to express my grati-tude to Professor Kazunori Takashio, Professor Takuro Yonezawa, Professor Chen Yin, Professor Tadashi Okoshi, Tomotaka Ito and Akira Tsuge for their construc-tive comments and continuous encouragement. They taught me a lot of important things such as how to find research topics, how to write papers, and attractive pre-sentation methods at academic conferences. Without their support, my research life could not have been accomplished. I would also like to acknowledge the faculty of Cyber Informatics (CI) at Graduate School of Media and Governance, Keio Uni-versity who have supported me and guided me throughout my research life. I am also grateful to the staff of the laboratory, Yuka Matsuo and Sachiko Endo for sup-porting my research life. I would also like to thank my colleagues, Makoto Kawano, Kenichi Yasukata, Ami Ogawa and Masaki Mori for their encouragement. I would also like to thank my lab mates, Wataru Sasaki, Naohiro Isokawa, Koji Oto, Yu-taro Hayakawa, Shin Katayama, Yusaku Eigen, ShinYu-taro Kusakabe, Takumi Horie, Hirono Kawashima, Yui Kakino, Satsuki Hashiba, Tomoki Tanimura and Satoshi Yokoyama. I am deeply grateful to the former as well as the current members, espe-cially, Dr. Yuuki Nishiyama, Professor Yoshito Tobe, Professor Takeshi Iwamoto, Dr. Kiyonobu Kojima, Dr. Michio Honda, Dr. Soko Aoki, Hiroshi Sakakibara,
Shinno-suke Takagi, Mikio Obuchi, Takafumi Kawasaki, Hanae Ose, Takamasa Ikeda, Yutaro Kyono, Kohei Saijo, Dr. Naoya Namatame, Akito Ito, Kodai Suzuki, Ayaka Yagi, Takuya Takimoto, Hokuto Hoshi, Teruaki Ishiguro, Shinya Hiruta, Naohiro Mor-ishige, Masaki Ogawa, Yutaka Karatsu, Kazuhiro Imura, Junki Terayama, Junpei Yamamoto, Nanako Honda, Kenji Yonekawa, Yuuki Yonezawa, Professor Masayuki Iwai, Yushiyuki Tokuda and Professor Masaki Ito. I want to thank the members of ACE Group, CPSF Group, SFCity Group of the laboratory for their critical opin-ions and comments. I would also like to acknowledge the staff of Graduate School of Media and Governance, Keio University who have supported me throughout my student life. I also acknowledge the funding received from JSPS KAKENHI Grant Number JP18J12486 (Grant-in-Aid for JSPS Research Fellow).
I would like to express my gratitude to the members of research projects, Yoshiyuki Kaneko, Mariko Tsumura, Shinichiro Yamamoto, Tatsuo Fukuda, Keiko Douguchi, Masayuki Tamura, Kenji Saito, Eiichi Abe, Atsuji Taki, Hayami Machida and Satoshi Nishi. I would also like to thank all the participants who were involved in the ex-periments, especially students of Keio University as well as city workers and citizens in Fujisawa City, Chigasaki City and Samukawa Town.
I would also like to acknowledge Kaoru Nasuno, Shunsuke Aoki, Chika Okuyama, Ayako Yamada, Mayuko Tsubokura, Sze Wan Yeung, Kazuhiro Osawa, Satoshi Moriyama, Ayumi Kaihori, Hikaru Aoki, Shinosuke Date, Mai Ogawa, Mai Iida, Joyce Shih, Kazuhiro Osawa, Ako Horie, Asako Sato, Ryoha Yamada, Kento Maru-sawa, Toshifumi Ando and Kazuki Itabashi for their patience, unconditional support and encouragement. I am sincerely grateful to them. Without their support, this thesis could not have been finished.
Thank you to my lovely fluffy dog, Nana, for her everyday healing. Finally, I would like to thank my family, for their limitless support and dedication to my life.
January 11, 2019 Mina Sakamura
Contents
Chapter 1 Introduction 1 1.1 Problem . . . 2 1.2 Research Goal . . . 3 1.3 Approach . . . 3 1.4 Thesis Statement . . . 4 1.5 Contributions . . . 4 1.6 Dissertation Road-map . . . 5 Chapter 2 Background 7 2.1 Sustainable Development in the World . . . 82.2 Sustainable Development in Urban Areas . . . 9
2.3 Smart City . . . 12
2.3.1 Smart City Cycle . . . 16
2.3.2 Data Collection in Smart Cities . . . 17
2.4 Crowdsensing . . . 18
2.4.1 Ubiquity of Mobile Devices . . . 18
2.4.2 Opportunistic Crowdensing and Participatory Crowdsensing . . . 26
2.5 Participatory Crowdsensing Platform in Cities . . . 28
2.5.1 Definition . . . 28
2.5.2 Current Status . . . 28
2.5.3 Problem: Difficulity in Applying Participatory Crowdsensing Platform to Cities . . . 30
2.6 Summary . . . 31
Chapter 3 Related Work 32 3.1 Utilization of Participatory Crowdsensing toward Smart City Promotion . . . 33
3.2 Design of Participatory Crowdsensing according to the
Roles of Each Position . . . 34
3.2.1 Approaches from the Viewpoint of Platform Owners 34 3.2.2 Approaches from the Viewpoint of Task Setters . . 35
3.2.3 Approaches from the Viewpoint of Task Executors 38 3.3 Summary . . . 39
Chapter 4 Design 41 4.1 Participatory Crowdsensing Platform . . . 42
4.2 Common Part: Sensor Data Streaming Infrastructure . . 43
4.2.1 Requirement . . . 43
4.2.2 Extending SOX for Participatory Crowdsensing . . 45
4.3 Individual part: data collection and utilization . . . 46
4.3.1 Constitutive Relationship in Participatory Crowd-sensing . . . 46
4.3.2 Requirement . . . 49
4.4 Summary . . . 52
Chapter 5 Minarepo 53 5.1 Garbage Collection in Fujisawa City . . . 54
5.2 Platform Design . . . 56
5.3 Implementation . . . 60
5.4 Practical Use of Minarepo and Evaluation . . . 63
5.4.1 Statistical Results . . . 65
5.4.2 Feedback from the City Workers . . . 69
5.5 Summary . . . 76
Chapter 6 MinaQn 77 6.1 Administrative Daily Work for Citizens . . . 78
6.2 Platform Design . . . 79
6.3 Implementation . . . 81
6.4 Experiment and Results . . . 85
6.4.1 Results in case of Normal Conditions . . . 85
6.4.2 Results in case of Abnormal Conditions (with Lo-cation Information) . . . 86
6.4.4 Feedback from the Platform Owner (Task Setter) . 88
6.5 Summary . . . 89
Chapter 7 Lokemon 90 7.1 Citizen-centric Urban Development . . . 91
7.2 Platform Design . . . 92
7.2.1 Point of Interest . . . 93
7.2.2 Function . . . 94
7.2.3 Sociological Theory behind Lokemon . . . 96
7.2.4 Behavior Change Promotion using Avatars . . . . 97
7.2.5 Anthropomorphic Design . . . 97
7.3 Implementation . . . 98
7.4 Experimental Evaluation . . . 100
7.4.1 Campus-wide Experiment: Comparison between the Participations with and without Monsters . . . 101
7.4.2 City-wide Experiment: Evaluating Lokemon’s Ef-fectiveness among Various Age Groups . . . 107
7.5 Summary . . . 113
Chapter 8 Discussion 114 8.1 Effectiveness . . . 115
8.2 Future Research Direction . . . 118
8.3 Summary . . . 123
Chapter 9 Conclusion 124
Bibliography 126
List of Figures
1.1 Dissertation road-map. . . 6
2.1 Population of the world: estimates, 1950-2015, and medium-variant projection with 95% prediction intervals, 2015-2100 [12]. 8 2.2 17 Sustainable Development Goals (SDGs) [39]. . . 9
2.3 World’s urban and rural populations, 1950-2050 [128]. . . 10
2.4 Percentage of the population residing in urban areas, 1950, 2014 and 2050 [128]. . . 11
2.5 Foreign-born population [78]. . . 12
2.6 Global smart city revenues in trillion USD [34]. . . 13
2.7 Barcelona’s system [25]. . . 14
2.8 Applications using datasets published by the City & County of San Francisco [5]. . . 15
2.9 Smart city cycle. . . 17
2.10 Mobile penetration (Data sources: ITU(mobile-cellular sub-scriptions) [28]. . . 18
2.11 Fixed-telephone penetration (Data sources: ITU(fixed-telephone subscriptions) [28]. . . 19
2.12 Percentages of Internet users aged 16-64 who are mobile-only [15]. . . 20
2.13 Internet penetration (Data sources: ITU(individuals using the Internet) [28]. . . 21
2.14 Percentages who say the above is their most important device for getting online [6]. . . 21
2.15 Percentages who say their smartphone/PC is their most im-portant device for getting online [6]. . . 22
2.16 Average time spent per day among US mobile users [29]. . . . 23
2.18 Most popular social networks worldwide as of October 2018,
ranked by number of active users (in millions) [11]. . . 24
2.19 Survey of smartphone usage [33]. . . 25
2.20 Survey of smartphone use time [3]. . . 25
2.21 Total count of publications related to crowdsensing, participa-tory crowdsensing and participaparticipa-tory sensing. . . 27
2.22 Flow of participatory crowdsensing. . . 28
2.23 Definition of participatory crowdsensing platform.. . . 29
3.1 From physically isolated platforms to virtual platforms [104]. . 34
3.2 The six applications developed within the LIVE Singapore! framework [97]. . . 35
3.3 Task set flow: definition of (a) basic information, (b), sensors, (c) participants, (d) profile matching for recruiting partici-pants (optional) [87]. . . 36
3.4 The life of a query in MoboQ [105]. . . 37
4.1 Overview of participatory crowdsensing platform. . . 42
4.2 Publish-subscribe model in Sensor-Over-Xmpp. . . 45
4.3 Task setters, task executors and platform owners involved in participatory crowdsensingin cities. . . 46
4.4 Model a), b) and c). . . 47
4.5 Two different types of model c). . . 48
4.6 Model d). . . 49
5.1 Model a). . . 53
5.2 Minarepo overview based on the model a). . . 54
5.3 Main flow of administrative work. . . 55
5.4 Example of the response flow when a city worker finds uncol-lected garbage in Fujisawa City. . . 56
5.5 Development meeting with city workers and stakeholders. . . 57
5.6 Example of system improvement requests. . . 58
5.7 Overview of MinaRepo. . . 59
5.8 Platform architecture of Minarepo. . . 60
5.9 Minarepo web viewer. . . 61
5.11 Other functions of Minarepo web viewer. . . 64
5.12 Total report count per month. . . 65
5.13 Top 3 report per month. . . 66
5.14 Total report count per report type. . . 66
5.15 Comparison of Minarepo Data in Fujisawa City (left) and Chibarepo Data in Chiba City(right). . . 68
5.16 Result of questionnaire from the task setters (1: strongly dis-agree, 2: partly disdis-agree, 3: neither agree nor disdis-agree, 4, partly agree, 5: strongly agree, 6: N.A.). . . 73
5.17 Result of questionnaire from the task executors (1: strongly disagree, 2: partly disagree, 3: neither agree nor disagree, 4, partly agree, 5: strongly agree, 6: N.A.). . . 74
6.1 Model b). . . 77
6.2 Participatory crowdsensing model where the platform owners and task setters belong to the same organization (i.e., city hall) but the task executors (citizens) do not. . . 78
6.3 Platform architecture of MinaQn with the whole flow of par-ticipatory crowdsensing process. . . 80
6.4 Platform architecture of MinaQn. . . 81
6.5 WEB interface for authoring participatory crowdsensing tasks. 81 6.6 WEB interface for participating sensing tasks. . . 82
6.7 2 type of ways how citizens provide location information. . . . 83
6.8 Different types of sensing data visualization: map-based (above) and chart-based (Bottom). . . 84
7.1 Model c). . . 90
7.2 Lokemon overview based on model c). . . 91
7.3 Relationship between a Point of Interest and an area. . . 93
7.4 Relationship between Point of Interests. . . 94
7.5 The comparison of the existing participatory sensing model and the proposed Lokemon sensing model. In a typical par-ticipatory crowdsensing model, a user sends sensor data using his/her user name. In the Lokemon model, a user sends sensor data by using the name of the monster virtually located at a sensing point. . . 95
7.6 Platform architecture of Lokemon. . . 98 7.7 Screenshots of Lokemon (above) and Lokerepo (below). In
Lokemon, each PoI is expressed as a monster. When a user is within the PoI (i.e., within BLE signal area), the user can report as the monster associated with the PoI. . . 99 7.8 The locations of the nine PoIs and the monsters associated
with each PoI in the campus. . . 102 7.9 The comparison of the number of messages in Lokemon and
Lokerepo of each PoI. . . 104 7.10 The locations of the 12 PoIs and the monsters associated with
each PoI in Fujisawa city . . . 107 7.11 The photos of the festival event(left) and the Lokemon
booth(right). . . 108 7.12 The average ratings by age group from the result of
List of Tables
5.1 Comparison of Minarepo and Chibarepo dataset . . . 67 6.1 Participatory crowdsensing task results. . . 86 7.1 Definitions of variables. . . 100 7.2 The number of people and ratings from the result of
question-naire. The respective ratings of agreement are: 1 = strongly disagree, 2 = partly disagree, 3 = neither agree nor disagree, 4 = partly agree, and 5 = strongly agree. The number of an-swerers are 9 for Lokemon and 10 for Lokerepo, respectively.
. . . 105 7.3 The number of messages of each PoI . . . 109 7.4 The number of people and ratings from the result of
question-naire. The respective ratings of agreement are: 1 = strongly disagree, 2 = partly disagree, 3 = neither agree nor disagree, 4 = partly agree, and 5 = strongly agree. The number of answerers is 39. . . 110
Chapter 1
Introduction
To improve the quality of people’s lives while taking the finite resources of the earth into consideration, the importance of sustainable development has been globally accented since the 1980’s. In order to balance people’s eco-nomic and social needs with the preservation and enhancement of natural re-sources with the world’s increasing population, it is necessary to make energy consumption more efficient. In recent years, there is a trend to realize the efficiency of resource management by information and communication tech-nology (ICT). Such efficient processing using computers is often expressed by the word “smart”, since the word includes the meaning of think and response quickly and intelligently (e.g., smart grid [77], smart meter [73], smart home [66]). There is also a move called smart city, which is to optimize city func-tions and promote economic growth while improving quality of citizens’ lives via the novel ICT. Today, global population keeps concentrating into cities, leading to economic and cultural prosperity. On the other hand, a lot of is-sues in environment, food, education, crime and etc. are becoming increasing severe. Utilizing ICT (i.e., information gathering, analysis, visualization etc.), to improve city management and resource utilization is widely considered as a promising solution against these urban problems. It is notable that the data collection from urban area plays a fundamental role in the research and de-velopment of smart cities. Participatory crowdsensing, where a large group of participants collect and share data of common interest via their portable devices like smart phones and tablets, is widely recognized as one of the major sensing technologies to collecting required information to understand the sit-uation of a city, since it can collect both objective and subjective information
leveraging human’s perception. By designing and introducing participatory crowdsensing platform properly into our cities, various information can be acquired from people comprehensively at low cost.
It has been recent phenomena that city-scale crowdsensing infrastructure has been recently set up. It is recently that the urban problem became obvious due to the rapid population inflow into urban areas and the deterioration of civil infrastructure. Also, mobile devices, especially smartphones have spread over the last few years, so it can not be said that smartphone literacy is high. The capability of mobile has improved. It is now possible to acquire various sensor data, high resolution photos and videos. Especially the GPS got better accuracy and better battery consumption. In sending such rich data, the development and construction of network environments such as LTE, 5G, and WiFi have enabled us to communicate by a large amount of data quickly from a large part of urban areas. SNS has also become widespread recently, and people have started posting on mobile.
Despite the fact that the environment for applying participatory crowdsens-ing on urban scale has been in place, only a limited number of participatory crowdsensing platforms have been practially deployed into cities yet.
1.1
Problem
The reason why the introduction has not progressed so far is that a participa-tory crowdsensing platform has not been designed and implemented from the perspective of application to cities. As a result, many people have not been involved in participatory crowdsensing so far. In participatory crowdsensing, there are task setters who define an object of sensing as a task, and task execu-tors who actively contribute sensing data to achieve the task. In particular, in order for participatory crowdsensing to be widely used for smart cities, it is im-portant to design a platform considering the relationship between task setters and task executors. Besides, in introducing participatory sensing platforms into cities, there are smart city promoters, namely, owners of platform that provides functions such as task setting and execution for smart cities. Previ-ous researches regarding participatory crowdsensing have been designed from each viewpoint of platform owner, task setter and executor, not designed to be applied in cities. Therefore, in terms of applying participatory crowdsensing
to cities, the existing approaches can not solve these complicated problems in the real world. What is more, there is no sensor streaming infrastructure assuming the use of participatory crowdsensing in cities. To exchange and utilize sensor data in city-scale participatory crowdsensing, real-time, flexible, and scalable sensor data infrastructure is necessary.
1.2
Research Goal
The goal of this dissertation is to study the design and implementation of par-ticipatory crowdsensing platform to enable efficient data collection for smart cities. Achieving the goal contributes to the acceleration of efficiently grasping the current situation as well as predicting the future, so as to provide various effective services in smart cities.
1.3
Approach
The participatory crowdsensing platform proposed in this dissertation consists of two parts, a common part and an individual part. The common part is a sensor streaming infrastructure for participatory crowdsensing, to make data distribution and preservation between other platforms easier. The individual part is to realize data collection and utilization. To make practical use of participatory crowdsensing, it is necessary to design a platform considering the relationship between task setters and task executors from the viewpoint of platform owners. According to the relationships among task setters, task executors and platform owners, this research proposes 3 models: in the cases of a)platform owners, task setters and task executors belong to the same orga-nization, b)platform owners and task setters belong to the same organization but task executors do not, and c)platform owners belong to a different orga-nization from task setters and task executors.
To validate the effectiveness of the proposed models, three platforms were implemented accordingly and field experiments were conducted to evaluate their realistic performance in the cities. Regarding a), Minarepo is proposed to realize efficient data collection inside an organization. Regarding b), MinaQn is proposed where task setters can define and distribute sensing tasks on the web platform. Regarding c), a platform called Lokemon is proposed where
task setters and executors can have free exchange of sensing tasks.
1.4
Thesis Statement
The thesis statement of this research is as follows.
To apply participatory crowdsensing to efficiently collect information for providing better urban services at low cost in cities, it is effective to design the participatory crowdsensing platform considering the follow-ing typical cases: accordfollow-ing to the relationship among platform owners, task setters and task executors, in the case of a)platform owners, task setters and task executors belong to the same organization, b)platform owners and task setters belong to the same organization but task execu-tors do not, and c)platform owners belong to a different organization from task setters and task executors.
1.5
Contributions
This dissertation makes the following contributions:
• To foster the development of smart cities, the design of participatory crowdsensing is systematized when applying it to cities. The design consists of a common design for data distribution and preservation and individual design for data collection and utilization. In the data collect-ing and utilizcollect-ing part, a viewpoint of platform owner was introduced and three models have been proposed with the approaches to improve efficiency of information collection.
• To evaluate the design models in realistic cities, three participatory crowdsensing platforms are proposed. Specifically, in the case where the platform owners, task setters and task executors belong to the same organization, a platform called Minarepo is proposed to enable efficient data collection inside the organization. In the case where the platform owners and task setters belong to the same organization but task execu-tors do not, a platform called MinaQn is proposed where task setters can define and distribute sensing tasks on the web platform. In the case where the platform owners belong to a different organization from
task setters and task executors, a platform called Lokemon is proposed where the task setters and executors can have free exchange of sensing tasks.
• Minarepo was developed on the iOS, Android and web platform. Mi-naQn was developed on the web platform. Lokemon was developed on the iOS and Android platform and the applications are open to the pub-lic. These artifacts will be the fundamental platforms toward further research opportunities on participatory crowdsensing.
• To validate the proposed platforms, the experiments were conducted to evaluate their performance, respectively. Regarding Minarepo, through experimental deployment for over 2 years, it shows that the time spent for each reporting has been shortened to about half and information collection that can be utilized for administrative work was achieved. Regarding MinaQn, based on the experiment in cooperation with three cities, 1278 response data were obtained in 2 weeks against daily ques-tions. Regarding Lokemon, our campus-wide comparative experiment and city-wide experiment among various age groups confirmed the effect of attracting users to Point of Interests (PoIs) was confirmed and also the number of autonomous posting was attained about 2 times.
1.6
Dissertation Road-map
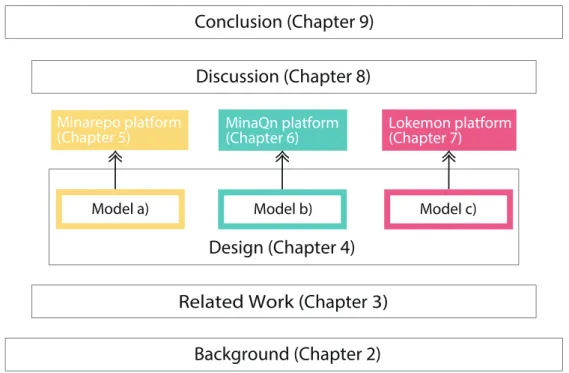
Figure 1.1 shows the road-map of this dissertation. This dissertation estab-lishes the above thesis through the following steps:
• First, Chapter 2 describes the background of the research in terms of smart city, crowdsensing and its related technologies.
• Next, Chapter 3 provides related work of this dissertation.
• Then, Chapter 4 presents the design of participatory crowdsensing for efficient information gathering for smart cities.
• For the model a), Chapter 5 introduces the platform called Minarepo and its evaluation.
• For the model b), Chapter 6 introduces the platform called MinaQn and its evaluation.
Background (Chapter 2)
Conclusion (Chapter 9)
Related Work (Chapter 3)
Design (Chapter 4)
Lokemon platform (Chapter 7)
Minarepo platform
(Chapter 5) MinaQn platform (Chapter 6)
Model a) Model b) Model c)
Discussion (Chapter 8)
Fig. 1.1: Dissertation road-map.
and its evaluation.
• Then, Chapter 8 describes discussion, providing the effectiveness, limi-tations and future work of the research.
Chapter 2
Background
This chapter describes the background of this research. First, as an important concept to this dissertation, the concept and importance of sustainable devel-opment is introduced in Section 2.1 and 2.2. Second, the concept of smart city is introduced in Section 2.3 where the sustainable development is carried out in cities. Third, the concept of crowdsensing is introduced in Section 2.4 where the efficient data collection is realized in smart cities. Lastly, Section 2.5 describes the current application state of participatory crowdsensing platform in cities, providing the problem statement of this thesis.
Fig. 2.1: Population of the world: estimates, 1950-2015, and medium-variant projection with 95% prediction intervals, 2015-2100 [12].
2.1
Sustainable Development in the World
Figure 2.1 shows the change of the global population since 1950 and the medium variant projections by the United Nations (UN) population division until 2100. Regions in this figure are based on the ITU regions [4]. It predicts that the global population will contentiously grow. In particular, with a cer-tainty of 95%, the global population will stand between 8.4 to 8.7 billion in 2030, between 9.4 to 10.2 billion in 2050, and between 9.6 and 13.2 billion by 2100.
Indefinite population growth is physically impossible on a finite planet. Re-source use, waste production and environmental degradation are accelerated by the population growth. Against this situation, the concept of sustainable development was advocated in 1987 [94]. The Bruntland Commission pub-lished its report, Our Common Future [94], and provided the definition of sustainable development as follows:
Fig. 2.2: 17 Sustainable Development Goals (SDGs) [39].
present without compromising the ability of future generations to meet their own needs.”
The concept aims to keep economic advancement and progress while pre-serving natural resources and ecosystems, each reinforcing the other. Since the 1980’s, various goals have been set internationally for sustainable devel-opment [53, 37, 47]. In 2015, All United Nations Member States adopted the 2030 Agenda for Sustainable Development (SDGs) [50], which consists of 17 international development goals from 2016 to 2030 as shown in Figure 2.2.
2.2
Sustainable Development in Urban Areas
Sustainable development is especially important in urban areas. Indeed, al-though cities occupy only 3% of the earth’s land surface area, they utilize
Fig. 2.3: World’s urban and rural populations, 1950-2050 [128].
between 60% and 80% of the world’s energy and are responsible for 75% of carbon emissions, according to the UN [12]. The world’s urban population has increased dramatically in the last decades and is projected to continue increasing in the upcoming decades (see Figure 2.3). In 2007, the urban popu-lation exceeded the rural popupopu-lation. In 2014, 54% of the world’s population was urban. By 2050, the global population will be 66% urban and 34% rural. Among 233 countries and areas, the range of the urban areas continues to expand (see Figure 2.4). In 1950, 24% had levels of urbanization greater than 50% and 8% were more than 75% urban. By 2014, 63% of countries were more than half urban and one-third was more than 75% urban. By 2050 more than 80% countries in the world are projected to be at least half urban and just under 50% will be at least 75% urban.
One of the key causes of the urban population growth is international mi-gration between countries. As of 2017, the number of international migrants in the world stood at nearly 258 million (3.4 % of the world’s population), according to UN Population Division [78]. Migrants tend to head to global
Fig. 2.4: Percentage of the population residing in urban areas, 1950, 2014 and 2050 [128].
cities. As illustrated in Figure 2.5, in global gateway cities such as Sydney, London and New York, migrants make up nearly 40% of the population. The proportion in Brussels and Dubai is even greater, they have the highest number of foreign-born population at 83% and 62% respectively.
Population growth in future will put more strain on the living environment. As a consequence of the urban population growth, there are many traffic acci-dents, disasters, etc., happening every day. To satisfy a group of people with
Fig. 2.5: Foreign-born population [78].
diversity of religion, race, gender, culture etc., it is important to find individ-ual needs, events, incidents, etc., as much as possible and to promptly coped with them. What is more, the extraordinary concentration of population leads to degradation of physical infrastructure such as roads, built environment and other physical assets. To make a city attractive, it is necessary to maintain and improve city infrastructure. However, cities are changing quickly and it can not cope with these diversified and complicated tasks in the conventional operation method and the scale of operation. Therefore, it is needed to opti-mize the efficiency of city operations and services while enhancing the quality of life for people, especially for developing sustainable urban cities.
2.3
Smart City
Recently, the concept of smart city has been proposed, where information and communication technologies (ICT) and various physical devices connected to the network (the Internet of things or IoT) are incorporated to enhance the quality and performance of urban services to reduce resource consumption, wastage and overall costs [120, 108, 57, 67, 86]. With the progress of infor-mation technologies, smart city applications and services have been developed all over the world. According to Arthur D. Little [34], The global smart cities market size is anticipated to increase from USD 0.95 trillion in 2014 to USD
Fig. 2.6: Global smart city revenues in trillion USD [34].
2.1 trillion in 2020 (see Figure 2.6).
The application domains are related to, but not restricted to natural re-sources and energy, transport and mobility, buildings, living, government, economy and people and so on. Here are a couple of inspiring examples of smart cities from across the globe. More examples can be found in [9].
Barcelona Barcelona, the capital and largest city of Catalonia as well as the
second most populous municipality of Spain, has deployed smart park-ings, smart streetlights, and sensors for monitoring traffics, air quality, noise and even waste bins. It has also deployed soil sensors under the ground to cut down water and money (see Figure 2.7). It was awarded the European Capital of Innovation prize (iCapital) by the European Commission for introducing the use of new technologies in order to bring the city to its citizens in 2014 [8].
Singapore The government of Singapore launched Smart Nation initiative in
trans-Smart irrigation system
Visualizer
Fig. 2.7: Barcelona’s system [25].
portation, health, energy, etc. Many applications have been developed, for example, to detect if people are smoking in unauthorized zones or if people are throwing litter out of high buildings. “Virtual Singapore” which is a dynamic 3-D modeling software that enables city planners to
Fig. 2.8: Applications using datasets published by the City & County of San Francisco [5].
run virtual test, has been developed too.
San Francisco San Francisco has been using technology to energy, transport,
building operation system, etc., to make them more efficient. Hundreds of collected data related to transportation, city infrastructure, housing & buildings and energy & environment etc., have been published since 2009 for use by developers, analysts, residents, etc [5]. The examples of developed applications using the open data are shown in Figure 2.8.
5D Smart San Francisco 2030 District project [24] has been developing a 3D data visualization platform mapping building energy usage and greenhouse gas emissions data to a dynamic, interactive 3D model of San Francisco. The platform will serve as a collaboration tool for the citizens, governments, companies, etc., to accelerate providing smart city servicies.
China Having the largest (data of World Bank in 2016 [54]) and continuously
increasing urban population, China expresses an extremely strong am-bition to rapidly enhance their technology and innovation capabilities to smart cities promotion, so as to meet citizen needs and challenges in the country’s urbanization. The Hangzhou city launched a so-called
“City Brain” project, which uses cameras systems and sensors across the city to collect data on road conditions in real-time in order to help the decision process of the city government [43]. Beijing is leading the front on cashless payments, pioneering the use of mobile payments for public transport and retail [43]. Xi’an is using big data analytics to track population movements and understand the backgrounds and occu-pations of their new citizens, so as to create public services for their new migrants [43]. A recent news reports that in the fourth China Smart City International Expo, held in Shenzhen 2018, four leading compa-nies, Ping An (P), Alibaba (A), Tencent (T), and Huawei (H) agreed to collaborate to promote the construction of smart cities in China [38].
2.3.1
Smart City Cycle
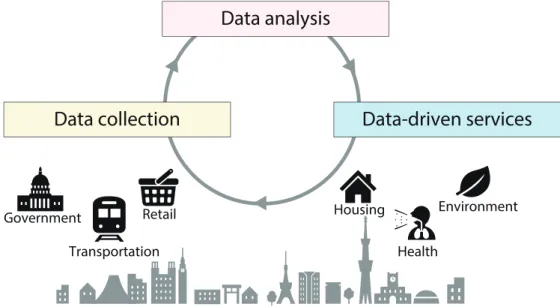
Smart city refers to the use of ICT to sense, analyze and integrate the key information of core systems in the management and operation of cities [112]. As shown in Figure 2.9, there are mainly three phases in the cycle of developing a smart city. In the phase of data collection, data from the urban area are collected. Based on the data, in the phase of data analysis, useful information are produced by data mining, modeling and so on. In the phase of data-driven services, infrastructure management, resource allocation, innovative services etc., are provided.
Data analysis
Data-driven services
Data collection
Government Transportation Retail Housing Health EnvironmentFig. 2.9: Smart city cycle.
2.3.2
Data Collection in Smart Cities
The data collection, (i.e., urban sensing), plays a key role in the deployment of smart cities since it provides most of the information required to develop effective urban services. To provide effective urban services, it is essential that service providers (e.g., governments, enterprises) connect with each citizen. In addition, among limited budgets, it is important to fulfill the data collection at low cost and maximize the efficiency.
In a city, sensors are used to measure stimulus and send the measurement. The sensors studied in this dissertation include physical sensors (e.g., tem-perature sensors, pressure sensors, cameras) as well as human sensors, which refer to utilizing people’s perception to collect information. With the spread of mobile devices, opportunities to gather information from a large population of people have become possible since they can send information through their mobile devices.
(%) 0 35 70 105 140 2005 2006 2007 2008 2009 2010 2011 2012 2013 2014 2015 2016 2017 5 9.1 15.1 21.6 26.5 33.1 42.2 48.6 55.8 63.1 67.9 67.7 70.4 22.9 30.1 39.1 49 58.2 68.5 78 82.7 87.8 91.4 92.7 96.3 98.7 33.9 41.7 50.6 59.7 68 76.6 84.2 88.5 93.1 96.7 98.2 101.5 103.5 82.1 92.9 102 107.8 112.1 113.3 113.1 115.7 118.2 122 124.5 127.3 127.3
Developed World Developing LDCs
Fig. 2.10: Mobile penetration (Data sources: ITU(mobile-cellular subscrip-tions) [28].
2.4
Crowdsensing
2.4.1
Ubiquity of Mobile Devices
Mobile devices such like smart phones have been playing an increasingly impor-tant role in modern society. According to the report of International Telecom-munication Union (ITU) [28], the percentages of mobile-cellular subscriptions in developed countries, developing countries and the world are nearly 100% in 2017 (see Figure 2.10). The rates of mobile-cellular subscriptions have been increasing, while the percentages of fixed-telephone subscriptions (see Figure 2.11) have been decreasing gradually. As for developing countries and LDCs, the rates of fixed-telephone subscriptions have been essentially low.
0 12.5 25 37.5 50 2005 2006 2007 2008 2009 2010 2011 2012 2013 2014 2015 2016 2017 0.9 0.9 0.9 0.9 1 1 1 1 1 1 0.9 0.9 0.9 12.7 13 13 12.8 12.4 11.9 11.5 11.2 10.6 9.9 9.2 8.5 8 19.1 19.2 18.8 18.5 18.4 17.8 17.2 16.7 16 15.1 14.3 13.6 13 47.2 46.6 44.8 44.3 45.5 44.6 43.4 42.2 41.3 40.2 39 38.1 37.3
Developed World Developing LDCs
(%)
Fig. 2.11: Fixed-telephone penetration (Data sources: ITU(fixed-telephone subscriptions) [28].
impressive. From the viewpoint of telephone infrastructure, the infrastructure in those countries have been building in the different way from developed coun-tries, where people first get mobile phones, not changing from fixed-telephones to mobile phones. Figure 2.12 shows the percentages of Internet users who are mobile-only. These users use mobile devices only and/or have used only mobile devices to get online in the last month. In those countries, 15% of Inter-net users are mobile-only and more than a third of people in UAE, Thailand, Malaysia and Saudi Arabia are now mobile-only. As demonstrated in Figure 2.13, the spread of the Internet have accelerated the use of mobile devices.
0 22.5 45 67.5 90 2005 2006 2007 2008 2009 2010 2011 2012 2013 2014 2015 2016 2017 0.8 1.1 1.9 2.1 2.7 4.3 4.8 6.1 7.5 10.5 13 15.6 17.5 7.7 9.3 11.8 14.5 17.2 20.6 23.4 26.3 29 32.4 36.1 39 41.3 15.8 17.6 20.5 23.1 25.5 28.9 31.3 34.3 36.9 39.9 43.2 45.9 48 51.3 53.5 59.1 61.3 62.9 66.5 67.7 72 73.8 75.6 77.4 79.6 81
Developed World Developing LDCs
(%)
Fig. 2.13: Internet penetration (Data sources: ITU(individuals using the In-ternet) [28].
Fig. 2.14: Percentages who say the above is their most important device for getting online [6].
Fig. 2.15: Percentages who say their smartphone/PC is their most important device for getting online [6].
In those countries such as USA and UK, where the Internet has reached a high rate and people have been utilizing multiple devices, much less people are mobile-only. However, even in such countries, mobile phones are the primary tools to get online, according to [6]. As shown in Figure 2.14, 66% of people say that their smartphone is the most important device to get online, rather than laptop, desktop PC and tablet. As shown in Figure 2.15, younger people are increasingly likely to say that their smartphone is the most important device to get online.
Fig. 2.16: Average time spent per day among US mobile users [29].
Fig. 2.18: Most popular social networks worldwide as of October 2018, ranked by number of active users (in millions) [11].
According to eMarketer [29], average time spent per day of US mobile users has been increasing [29], as shown in Figure 2.16. People spend nearly 4 hours using their mobile phone in a day. The Manifest [14] found that social media applications are the most frequently used applications (39%), while gaming applications and communication/messaging applications account for
Browsing Mail Searching SNS Video Game Shopping Travel Financial Passing Work/ planning transaction the time study
Question: For what purpose do you usually use smartphones? (Multiple answers allowed) Base: 9,529 smartphone users (2013) and 16,011 smartphone users (2017)
Fig. 2.19: Survey of smartphone usage [33].
Age
Question: When do you frequently use mobile phones? (Multiple answers allowed) Base: 1,642 mobile phone users (2017)
While watching
TV/movies While using publictransportation While going outfor shopping While being witha family/friends While working While walking
Fig. 2.20: Survey of smartphone use time [3].
10%, respectively, as shown in Figure 2.17.
In social media applications, Facebook has the most monthly active users in the world, the number of which is more than 2.23 billion by October 2018 (see Figure 2.18). A quarter of the world’s population now are using Facebook. As for Twitter, the number of monthly active users is 335 million, and there are
500 million tweets sent each day [30]. As for Weibo, the number of monthly active users is 431 million, and there are 130 million tweets sent each day [52]. The percentage of Twitter and Weibo users on mobile are 80% [30] and 90% [52], respectively.
Mobile users seem to use those applications many times. The Manifest [14] reports that nearly half of people open mobile applications more than 10 times per day. Especially, 21% of millennial users report that they open mobile appli-cations more than 50 times per day. According to Yahoo! JAPAN Marketing Solutions [33], nearly half of people use their smartphone for just time killing without any specific purpose (see Figure 2.19). According to a survey pub-lished by Deloitte Tohmatsu Consulting LLC in 2017 [3], many mobile phone users often use their mobile phone while using public transportation (see Fig-ure 2.20). Younger people tend to use their mobile phone while being with a family/friends, going out for shopping and walking too. The above statistics suggest that more and more people will spend a lot time in their mobile phone in the future, leading to a great opportunity of making them collecting data in daily life.
2.4.2
Opportunistic Crowdensing and Participatory Crowdsensing
Taking advantage of this opportunity, crowdsensing [79, 83] has been proposed as an appealing technique to collect information with the help of individuals having mobile devices. Indeed, as shown in Figure 2.21, the total count of publications related to crowdsensing has been increasing in top conferences such as ACM and IEEE since 2007.
Depending on the type of users’ participation, crowdsensing can be classified as follows.
Opportunistic crowdensing Users passively participate in contributing sensing
data and sensing is conducted almost automatically.
Participatory crowdsensing Users actively participate in contributing sensing
data.
In opportunistic crowdsensing, physical sensors and GPS are used to get data, like noise level, people flow etc. without a user being aware of sensing. Examples also include collecting information from SNS data posted by a large group of people. On the other hand, participatory crowdsensing is conducted
0 20 40 60 80 100 120 140 160 180 200 2005 2006 2007 2008 2009 2010 2011 2012 2013 2014 2015 2016 2017 Nu m be r of p ub lic at io ns
IEEE ACM Elsiver
Fig. 2.21: Total count of publications related to crowdsensing, participatory crowdsensing and participatory sensing.
by users’ active participation. Figure 2.22 shows the flow of participatory crowdsensing. In participatory crowdsensing, there are task setters who define an object of sensing as a task (e.g., “Is the bus stop crowded now?”). To achieve the task, there are task executors who actively contribute sensing data (e.g., “Yes, it is very crowded”).
Although it requires user’s explicit cooperation and takes their time and effort, by giving adequate incentive, it becomes feasible. Physical sensors generally obtain information on one category, such as temperature, humidity, noise and pressure. Also, they needs to be installed and maintained at the place where it is desired to be sensed. On the other hand, a person can acquire various categories of information using their perception in addition to the use of physical sensors. People can get qualitative information that physical sensors are less likely able to obtain, such as subjective opinions and personal emotions. In addition, people are already scattered in cities so that there is no need to be installed and mainteined, and the geographical coverage of the data obtained is high. Therefore, by designing and introducing participatory
Task executor
Task setter
Task
Sensing data
e.g., Is the bus stop crowded now?e.g., Yes, it is very crowded.
Fig. 2.22: Flow of participatory crowdsensing.
crowdsensing platform properly into our cities, various information can be acquired from each person comprehensively at low cost.
2.5
Participatory Crowdsensing Platform in Cities
2.5.1
Definition
In this dissertation, I define the participatory crowdsensing platform as an in-formation infrastructure for multiple people to exchange tasks with the com-mon interface (see Figure 2.23). Through the platform, task setters define a task, and task executors perform a corresponding task.
2.5.2
Current Status
It has been recent phenomena that city-scale crowdsensing infrastructure has been recently set up. As mentioned in the previous sections, it is recently that the urban problem became obvious due to the rapid population inflow into urban areas and the deterioration of civil infrastructure. Also, mobile devices, especially smartphones have spread over the last few years. The re-cent progress in wireless communication services makes it possible to send large-volume data like images and videos wirelessly to backend servers in a reasonable cost. In particular, for cellular communication, the data band-width has increases from 2 kbps to 200 Mbps or more from 1G to 4G-LTE
Task executor (participant) Task setter Sensing task set execute
Fig. 2.23: Definition of participatory crowdsensing platform..
and is expected to increase to beyond 1 Gbps in the upcoming 5G [44]. Be-sides, as a complementary to cellular network, city-wide Wi-Fi spots have also been established in a lot of cities. For example, the New York city deployed a city-wide free Wi-Fi infrastructure called LinkNYC [46]. The local govern-ments in Japan are also striving to increase the service areas of public Wi-Fi infrastructure [41]. In addition, along with the hardware technology improve-ment, the numbers and accuracy of the sensors integrated into smartphones are continuously increasing. It is now possible to acquire various sensor data, high resolution photos and videos. Especially the GPS got better accuracy and better battery consumption. The smartphone penetration rate has been growing in the last decade [51]. SNS has also become widespread recently, and people have started posting on mobile.
Despite the fact that the environment for applying participatory crowdsens-ing on urban scale has been in place, only a limited number of participatory crowdsensing platforms have been practially deployed into cities yet.
2.5.3
Problem: Difficulity in Applying Participatory Crowdsensing
Platform to Cities
The reason why the introduction has not progressed so far is that in terms of application to cities, participatory sensing platforms are not designed and implemented sufficiently. The main issues of participatory crowdsensing are such as how to collect information, how to exchange data, and how to use the collected data. To overcome the issues at the time of collection, researchers have worked on granting incentives [115, 70] and privacy protection [90, 82] to obtain the number of participants. At the time of exchanging data, there are existing work related to proposal of easy-to-use data formats [132] and security assurance [80]. At the time of utilizing the collected data, many re-searchers have struggled to ensure the quality of data [122, 111] and to study data visualization method [97, 124]. In participatory crowdsensing, there are task setters who define an object of sensing as a task, and task executors who actively contribute sensing data to achieve the task. When applying partici-patory crowdsensing to cities, such approaches vary depending on the entity of task setters and task executors. Besides, in introducing participatory sens-ing platforms into cities, there are smart city promoters, namely, owners of platform that provides functions such as task setting and execution for smart cities. Previous researches regarding participatory crowdsensing have been designed from each viewpoint of platform owner, task setter and executor, not designed to be applied in cities. Therefore, in terms of applying participatory crowdsensing to cities, the existing approaches can not solve these complicated problems in the real world. What is more, there is no sensor streaming infras-tructure assuming the use of participatory crowdsensing in cities. As a result, many people have not been involved in participatory crowdsensing so far.
To activate efficient data collection in cities, it is necessary to design and implement a participatory crowdsensing platform. To make practical use of participatory crowdsensing, it is necessary to design a platform considering the relationship between task setters and task executors from the viewpoint of platform owners. In addition, implementation of real-time, flexible, and scal-able sensor data infrastructure is necessary. Then, it is necessary to evaluate the activation of information gathering by applying the proposed method in
the real world.
2.6
Summary
This section described the background of this research. The summary of the main contents in this section follows:
• Since 1980’s, various goals have been set internationally for sustain-able development to conduct economic development without depletion of natural resources. The concept is especially important in urban areas since by 2050 more than 80% of countries in the world are projected to be at least half urban.
• In order to reduce resource consumption while improving the quality of people’s lives, the concept of smart city, where information and commu-nication technologies (ICT) is used to efficiently manage resources and provide better city services, has been introduced.
• In the smart city cycle, there are data collection, data analysis and providing data-driven services. In the phase of data collection, it is important to efficiently collect a lot of spatio-temporal information at low cost among limited budgets.
• With the wide spread of mobile devices and improvement of related technologies, mobile crowdsensing has been an appealing technique to collect various information from people at low cost.
• The application of participatory crowdsensing platform to cities has not progressed so far since existing approaches have not considered the re-lationship between task setters and task executors from the viewpoint of platform owners. What is more, there is no sensor streaming infras-tructure assuming the use of participatory crowdsensing in cities. To enable efficient data collection for smart cities, it is necessary to design and implement participatory crowdsensing platform.
Chapter 3
Related Work
This chapter introduces related work. At first, an overview
of related work in terms of usefulness of systematic design
toward utilizing participatory crowdsensing in cities is
pro-vided. At second, related research designed according to the
roles of platform owners, task setters and task executors is
reviewed and the novelty of this research is clarified.
3.1
Utilization of Participatory Crowdsensing toward
Smart City Promotion
A city is an area where a large number of people live [21, 27] and has responsi-bility for improving the quality of life of their citizens. Citizens have the right to enjoy basic resources such as safe water, air and food, while ensuring eco-nomic, social and environmental sustainability [2]. Now the city population has been growing over the past several decades and will continuously increase in the future [128]. The growth of urban population has been increasing the need for better urban services, therefore the concept of smart city, where ICT are used to solve urban problems, has been proposed and deployed. While there is no unified definition of a smart city, many researchers have made various definitions so far [76, 69, 108, 109, 89]. For instance, a smart city is “a city that monitors and integrates conditions of all of its critical infras-tructures, including roads, bridges, tunnels, rails, subways, airports, seaports, communications, water, power, even major buildings, can better optimize its resources, plan its preventive maintenance activities, and monitor security as-pects while maximizing services to its citizens” [85] and “a city to be smart when investments in human and social capital and traditional (transport) and modern (ICT) communication infrastructure fuel sustainable economic growth and a high quality of life, with a wise management of natural resources, through participatory governance”[64]. Toward successful development of smart cities, one important factor is to get sufficient urban data allowing to better under-stand cities and enable effective operations [120, 93, 100]. Within a limited budget, it is important to conduct urban data collection efficiently. Participa-tory crowdsensing, which is a novel sensing technology where people having mobile devices collectively share information, is effective way to for efficient urban data collection [63, 99, 95, 65, 123]. In participatory crowdsensing, it is important to design a participatory crowdsensing platform according to the purpose of collecting information, such as what data to collect, who collect data and so on [121, 62, 98]. In particular, in order for participatory crowd-sensing to be effectively used for smart cities, it is important that the design of the platform is systematized from the viewpoint of application to smart
Fig. 3.1: From physically isolated platforms to virtual platforms [104].
cities so that those who wish to introduce a participatory crowdsensing (i.e., platform owners) can design an appropriate platform and introduce it into cities.
3.2
Design of Participatory Crowdsensing according to
the Roles of Each Position
In this section, I introduce related research focusing on demand from the viewpoints of platform owners, task setters and task executors to make par-ticipatory crowdsensing successful.
3.2.1
Approaches from the Viewpoint of Platform Owners
From the viewpoint of platform owners, a lot of research have been conducted on the development of sensing platforms to facilitate the data utilization and application development. The authors of SOXFire [132] and CityHub [101] studied sharable and extensible platforms, which aim at enabling secure city-scale data sharing and streaming for smart cities. Their platforms support the so-called social big sensor data including not only participatory crowdsensing data but also data coming from IoT, SNS and Web platform, all of which are
Fig. 3.2: The six applications developed within the LIVE Singapore! frame-work [97].
accessible in a unified event-driven API to facilitate application development of the data. Besides, there are also researches focusing on programing tools to facilitate analysis and application development of collected data. For example, the authors of [104] proposed a framework that integrates isolated platforms into a unified one. Its main purpose is to enable IoT solution providers to efficiently deliver and continuously extend their services (see Figure 3.1). The Node-RED is a flow-based programing tool that provides a browser-based edi-tor to facilitate the processing of sensory data and deployment of applications [49]. What is more, to help platform owners grasp the condition of city, var-ious city dash-boards [126, 97, 124, 3] are also developed to provide varvar-ious perspectives viewpoints to a city (see Figure 3.2).
3.2.2
Approaches from the Viewpoint of Task Setters
From the viewpoint of task setters, firstly, many researchers have been working on enhancing the task definition and distribution. Regarding task definition, there are researches proposing novel tools or systems for task setting and facilitation of providing tasks to conduct participatory crowdsensing [19, 96, 113, 55, 130, 87, 71]. For example, the Mobile Campaign Designer proposed
Fig. 3.3: Task set flow: definition of (a) basic information, (b), sensors, (c) participants, (d) profile matching for recruiting participants (optional) [87].
in [87] provides an easy-to-use graphical user interface that allows users to set tasks, as shown in Figure 3.3. Sensr [96] is another example of such kinds of tools, which aims at enabling people without programming skills to create mobile data collection for citizen science with a web interface. Regarding task distribution, while there are many works that focus on specific platforms for sensing task distribution [23, 55], researches have also explored existing social media network applications (e.g., Twitter, Weibo and Facebook) to facilitate the distributed participation of people [72, 105, 106]. For example, the authors of [105] proposed a participatory crowdsensing application called MoboQ which is deployed in the Sina Weibo, a microblogging service in China [52]. MoboQ allows users to ask questions for a specific location, and the MoboQ will then identify candidates who are likely to currently be at the place via the search engine provided by the Sina Weibo as shown in Figure 3.4. The utilization of social media network services (SNSs) not only avoids the installation of clients of participatory sensing, but also achieves a large population of potential participants. Besides, such SNSs typically provide convenient APIs, reducing the development complication and cost greatly.
Secondly, many related studies have involved in utilization of obtained data for response, in terms of data quantity and data quality. From the viewpoint of data quantity, it is important to collect sufficient amount of data to generate required information. To this end, we can apply the approaches proposed to
Fig. 3.4: The life of a query in MoboQ [105].
utilize the relationship between notification time, user’s location, and the likelihood and quality of users’ responses. For example, the work of [110] studied to detect effective breakpoints of user’s mobile interactions to deliver notifications adaptively so as to increase the possibility of their response. A similar approach was studied in [58] for crowdsourcing task assignment within an enterprise organization. Besides, the approaches proposed to increase the motivation of executors [115, 68] and to increase response likelihood using geometric or social connections [91, 105, 59] are also applicable here.
From the viewpoint of data quality, it is needed to make data easy-to-use as well as reduce the noise of unwanted/inappropriate contents in the collected data. Regarding data format, it is necessary that data exchanged on a sensing platform should be in an available format, since it is difficult to utilize the data as long as it is not. There are various studies that made it possible to handle various sensor data in an easy-to-use format, such as those using XMPP [132, 101, 31], MQTT [48], CoAP [40]. In this dissertation the XMPP-based solution of SOX was selected for the its extensibility, scalability, security and
development convenience, as referred in the previous section.
Regarding data truthfulness, since the sensing tasks are outsourced, there is a possibility that some participants submit fake data either purposely or not. The approaches proposed for detect fake contents in social media can be applied here to check the truthfulness of collected data. For example, the work of [122] surveyed the detection of fake news on social media from a data mining perspective. Besides text-based contents, a study on fake image detection during a natural disaster on Twitters was conducted in [84].
Regarding libel and slander, the users may also abuse the participatory sensing system to submit inappropriate contents. Recent studies have demon-strated that machine learning-based approaches can be effective in detect-ing those contents. For example, the authors of [111] studied an SVM-based method to detect the inappropriate contents from young school students. A deep-learning based approach was proposed in [131] to detect online inappro-priate contents.
3.2.3
Approaches from the Viewpoint of Task Executors
From the viewpoint of task executors, participating motivation and risk of privacy leakage are their main concerns. In many studies of participatory crowdsensing, incentives are a fundamental challenge. Task executors offer their time, attention, labor and mobile device’s battery power to collect data that may not be useful to themselves, so that giving adequate incentives is necessary to motivate people to participate in executing sensing tasks. Exist-ing studies on incentive can be mainly divided into monetary incentives and non-monetary incentives. The effect of monetary incentives has been inves-tigated in [115, 70, 91, 103, 102], where auction-based mechanisms are the main branch. For example, in the work of [103, 102], the authors proposed a so-called Reverse Auction based Dynamic Price (RADP) incentive mechanism where participants can sell their sensing data to a service provider. Consider-ing budget and coverage constraints, the work of [91] proposed a greedy algo-rithm based auction incentive mechanism that selects users according to their location given a budget. For non-monetary incentives, researchers mainly fo-cus on psychological factors. For example, the effect of gamification has been conducted in [74, 68, 127]. In particular, the work of [68] introduced game elements into a participating crowdsensing system among local communities.
After a user makes a report, other users can then vote for or against the impor-tance of the report gaining the user points and generating more visibility for the issue. Integrating monetary rewards and gamification, the research of [127] proposed a hybrid incentive mechanism in order to reduce the total amount of paid rewards. In addition, the work of [60, 107] studied to use compliance-without-pressure technology to improve the receptive-ness of participants. For example, the authors of [60] proposed to apply social relationships to help in-crease participating motivation. In particular, they evaluated their proposal in Facebook by posting visual questions from blind people to their friends assum-ing that the friends will provide help since they know them. Another issue in participatory crowdsensing from the viewpoint of task executors is to respect the privacy of them such as their locations, identities and so on. In this direc-tion, there is a lot of work on privacy-preserving participatory crowdsensing by using various anonymization-based techniques [90, 119] or obfuscation-based techniques [82, 56, 75]. In the work of [90], the authors proposed a so-called Hot-Potato-Privacy-Protection Algorithm in which data is sent to one of the friends of a user and the friend will choose another friend to deliver the data to the next hop. This hopping process repeats until a pre-defined threshold is reached. Another interesting example is the information-limited location sharing approach proposed in [75]. In particular, the authors considered a scenario where the location of a user is shared by several servers of different service providers. The proposed method distributes the position information of strictly limited accuracy to the servers so that even one server is compro-mised, only information of limited accuracy will be leaked.
Despite of the aforementioned researches from the viewpoint of each respective role, to the best of our knowledge, rare research has studied the systemati-cal design of participatory crowdsensing from the aspects of applying it to cities considering the relationship among platform owners, task setters and executors.
3.3
Summary
This section overviewed the literature related to this dissertation. At first, usefulness of design of participatory crowdsensing toward smart city promotion
![Fig. 2.1: Population of the world: estimates, 1950-2015, and medium-variant projection with 95% prediction intervals, 2015-2100 [12].](https://thumb-ap.123doks.com/thumbv2/123dok/1870496.2663817/21.892.175.716.175.476/population-world-estimates-medium-variant-projection-prediction-intervals.webp)
![Fig. 2.4: Percentage of the population residing in urban areas, 1950, 2014 and 2050 [128].](https://thumb-ap.123doks.com/thumbv2/123dok/1870496.2663817/24.892.244.633.171.716/fig-percentage-population-residing-urban-areas.webp)
![Fig. 2.8: Applications using datasets published by the City & County of San Francisco [5].](https://thumb-ap.123doks.com/thumbv2/123dok/1870496.2663817/28.892.210.678.160.726/fig-applications-using-datasets-published-city-county-francisco.webp)
![Fig. 2.12: Percentages of Internet users aged 16-64 who are mobile-only [15].](https://thumb-ap.123doks.com/thumbv2/123dok/1870496.2663817/33.892.225.666.411.765/fig-percentages-internet-users-aged-mobile.webp)
![Fig. 2.14: Percentages who say the above is their most important device for getting online [6].](https://thumb-ap.123doks.com/thumbv2/123dok/1870496.2663817/34.892.183.712.720.913/fig-percentages-say-important-device-getting-online.webp)
![Fig. 2.15: Percentages who say their smartphone/PC is their most important device for getting online [6].](https://thumb-ap.123doks.com/thumbv2/123dok/1870496.2663817/35.892.181.710.176.451/fig-percentages-say-smartphone-important-device-getting-online.webp)
![Fig. 2.16: Average time spent per day among US mobile users [29].](https://thumb-ap.123doks.com/thumbv2/123dok/1870496.2663817/36.892.176.709.254.412/fig-average-time-spent-day-mobile-users.webp)
![Fig. 2.18: Most popular social networks worldwide as of October 2018, ranked by number of active users (in millions) [11].](https://thumb-ap.123doks.com/thumbv2/123dok/1870496.2663817/37.892.171.730.167.765/popular-social-networks-worldwide-october-ranked-number-millions.webp)
