Full Terms & Conditions of access and use can be found at
http://www.tandfonline.com/action/journalInformation?journalCode=vjeb20
Journal of Education for Business
ISSN: 0883-2323 (Print) 1940-3356 (Online) Journal homepage: http://www.tandfonline.com/loi/vjeb20
Course Design Using the House of Quality
Michael H. Peters , Bryan R. Kethley & Kimball Bullington
To cite this article: Michael H. Peters , Bryan R. Kethley & Kimball Bullington (2005) Course Design Using the House of Quality, Journal of Education for Business, 80:6, 309-315, DOI: 10.3200/JOEB.80.6.309-315
To link to this article: http://dx.doi.org/10.3200/JOEB.80.6.309-315
Published online: 07 Aug 2010.
Submit your article to this journal
Article views: 23
View related articles
or some time, the faculty members responsible for the required opera-tions management (OM) course in our MBA program at Middle Tennessee State University, a large regional school in the southeastern United States, had not been satisfied with the course design (hereafter referred to as the “old course”). We felt that the traditional uni-lateral approach to redesigning it was not adequately addressing our concerns because it involved a significant invest-ment of time on the part of the faculty, which had a substantial impact on the students. We therefore chose to use the House of Quality, a customer-oriented approach that is used in product or ser-vice design and total quality manage-ment, to facilitate the redesign process.
The House of Quality
Overview
The House of Qualityis a structured means of converting the expectations of the customer into a set of specifications for a product or service. It is usually embedded in a more comprehensive program, the Quality Function Deploy-ment (QFD), which consists of four basic stages (Houses of Quality) in which the outputs of one house become the inputs to its successor house (see Terninko, 1997 or Hauser & Clausing,
1988 for a more complete description). In our case, we considered only the first house in this series because many of the issues and decisions involved in the sub-sequent houses are typically beyond the control of the faculty member.
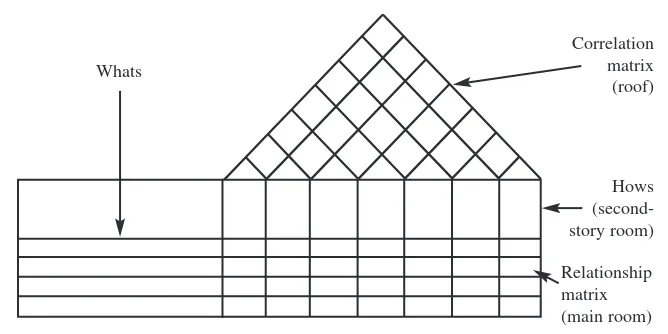
Although house designs can vary and are flexible, all contain the same basic building elements:
1.Whats: The qualities or attributes the product or service must contain, as required by the customer; also referred to as the “voice of the customer.”
2.Hows:The technical means of sat-isfying the whats, including the exact specifications that have to be met to achieve them.
3.Correlation matrix:An evaluation of the positive and negative
relation-ships among the hows, sometimes called the “roof.”
4.Relationship matrix:An evaluation of the relationships between the whats and the hows. It identifies the best ways to satisfy the customer and generates a numerical ranking that is used as a guide throughout the development process (Kinni, 1993).
Figure 1 illustrates how these basic elements fit together. The customer requirements (the whats) make up the room on the left side. A row extending through the house is created for each requirement. The various hows compose the second-story room above the main room (relationship matrix). A column is set up for each, and it is extended through the rest of the house. These extended rows (the whats) and columns (the hows) create the relationship matrix in the main room. The relationship between each pair of hows is shown in a correlation matrix (roof). Only the minor half of a matrix is needed because the notation designates the direction of the relationship between the different pairs. By properly orienting this partial matrix, a “roof” is provided on top of the second-story room.
Application
In higher education, QFD has been applied in several situations. Ermer
Course Design
Using the House of Quality
MICHAEL H. PETERS R. BRYAN KETHLEY
Nicholls State University KIMBALL BULLINGTON
Thibodaux, Louisiana Middle Tennessee State University
Murfreesboro, Tennessee
F
ABSTRACT.This article reports on the use of the House of Quality to facilitate the design of a required oper-ations management course in an MBA program. The House of Quality is a relatively new approach that is used in product or service design and total quality management. The faculty identified the decision issues it felt would be pertinent to the design effort and surveyed students on their percep-tions of those areas at the end of the course. The faculty then analyzed data and discussed the findings. The result-ing House of Quality provided the basis for determining future course improvements.
(1995) reported on how the faculty of the engineering department at the Uni-versity of Wisconsin–Madison used QFD to revise its undergraduate cur-riculum. Pittman, Motwani, Kumar, & Cheng (1996) described the use of QFD in evaluating the MBA program at Grand Valley State University in Grand Rapids, MI. Bier and Cornesky (2001) explained how QFD was used to con-struct a Master of Science Degree cur-riculum for Rain Star University in Scottsdale, AZ, that would meet the requirements of its accrediting agency. QFD was used to improve teaching and student counseling in the school of engi-neering at West Virginia University in Morgantown, WV (Jaraiedi, 1992). Lam and Zhao (1998) presented a study on formulating and evaluating university teaching techniques based on the ana-lytical hierarchy process (AHP) and QFD. These efforts were at the program level. We applied a portion of QFD, the House of Quality, at the course level.
Description of the Old Course
We shall give a brief description of the old course as a point of reference because some of the responses from our “customers” (see section under heading Development of House of Quality) were based on their perceptions of the old course.
The prerequisite is an introductory undergraduate OM course. Generally, two sections with enrollments ranging between 18 and 25 students each are offered each semester. The classes are
usually held once a week for 2 hrs and 40 min. Even though a different faculty member taught each section, there was a high degree of uniformity in course con-tent and pedagogical method.
Our general approach to the material could be described as managerial; that is, the use of quantitatively based models was limited. Because we covered almost all of the topics included in a typical OM text (see the example given in Chase, Aquilano, & Jacobs, 2001), we allocated several related topics to each class ses-sion. We assigned relevant chapters from a required text as well as two to three arti-cles outside of the text for each session.
The students formed into teams of 2 or 3. Each team was randomly assigned a class session and was responsible for developing and making a presentation on that session’s topics. In a typical class meeting, the instructor spent the first half reviewing the assigned topics by using the lecture method. This refresher was based primarily on the assigned text material. In the second half, the student team made its presenta-tion. Thus, the pedagogical method was a combination of lecture and seminar. The grade in the course was determined by performance on a midterm exam, a final exam, the in-class team presenta-tion, and a term paper.
METHOD
Respondents
Participation was voluntary and anonymous. Forty students in an OM
class that was offered in 2 sections over a semester received questionnaires.
Apparatus
Development of the House of Quality.
The first step in the development of the House of Quality elements for our application was to select whom we considered “the customer” for this course. The customers of the MBA pro-gram directly include the students of the OM course but could also include other constituencies such as alumni, employers, and the broader community. Statistically, over two-thirds of the stu-dents in the MBA program are nontra-ditional and are employed full-time, with a mean work experience of 6 years. Although the MBA students may be viewed as a “convenient sample,” the demographics indicate they can give valuable information concerning course content needs.
The second step was to ascertain the requirements and expectations (the whats) for the course from that cus-tomer group. We elected to determine the voice of this customer base using data obtained through a questionnaire.
The questionnaire. We constructed the questionnaire around those aspects of the course where the specifications were within the purview of the faculty mem-ber or instructor. The OM faculty nar-rowed down the design issues for this course to the following: (a) pedagogical method (lecture, cases, simulation, or seminar), (b) coverage (number of top-ics), (c) sector focus (mix of service and manufacturing), (d) approach (qualita-tive [managerial] or quantita(qualita-tive), (e) student involvement (amount and type), (f) assignments (amount and type), and (g) grading (components and relative weighting).
The questionnaire was divided into 5 sections. In Section 1, the respondent provided certain background information about his or her professional and acade-mic status. The student was asked to clas-sify the organization for which he or she was working or most recently worked on a 7-point service–manufacturing continu-um. The student also had to classify where his or her current or most recent job fell on the same continuum. We also
FIGURE 1. House of Quality.
Relationship
asked several questions about academic and work experience.
In Section 2, we presented the student with a list of 10 possible components for the course. We asked the student to “indicate the magnitude of the contribu-tion that each component could [empha-sis added] make to enhance the worth of” the course. The student rated each component on an 11-point Likert-type scale ranging from 0 (none) to 10 (very large). In Section 3, the student had to assess the quantity, or the extent, of selected aspects of the old course (e.g., emphasis on manufacturing and service applications, amount of quantitative material, number of topics covered, amount of text readings and readings outside of text, overall amount of work, individual vs. teamwork) by using a 7-point Likert-type scale ranging from 1 (much too little) to 7 (much too great). In Section 4, the student had to indicate the level of agreement on a 7-point Likert-type scale ranging from 1 (strongly dis-agree) to 7 (strongly agree) with 7 state-ments about the old course. In Section 5, we provided brief descriptions of four pedagogical methods (lecture, seminar, case, and simulation). The student had to evaluate the extent to which each method would facilitate learning if that method were to be used in the course and indicate their evaluation on a 7-point Likert-type scale ranging from 1 (very ineffective) to 7 (very effective).
Procedure
We ran a pilot test of the instrument with the students in one section of the course and made some minor revisions. The questionnaire was administered during a class session toward the end of the following semester. Of the 40 stu-dents who received questionnaires, 36 returned usable questionnaires.
RESULTS
Background Information
Table 1 contains a summary of the results from the background information portion of the questionnaire. With regard to their work organizations, the median indicated that most were working in the service sector. With regard to their jobs,
include estimates by the decision maker or weights developed as a byproduct of group discussions (Bahill & Chapman, 1993). Given our limited sample size and our data collection procedure, we chose a user-friendly, informal approach.
We looked at how the respondents indicated the old course measured up on a design issue. If the old course seemed not to measure up, we determined the direction in which adjustments had to be made. We then estimated the impor-tance, or weight, that students placed on the design issue. To provide a basis for these discussions, we first grouped the questions across the various sections of the questionnaire by design issue. We then generated selected descriptive sta-tistics from the data for each question. The faculty then examined and dis-cussed the results by design issue and arrived at answers to the questions. For
the contribution of manufacturing appli-cations to the worth of the course, and 83.3% marked the same responses for the contribution of service applications. As described heretofore, the data from Section 3 provided an indication of the extent to which the students thought the old course measured up regarding the issue of service coverage versus the coverage given to manufacturing. The emphasis placed on manufacturing was skewed toward the “much too great” end of the response options, whereas the opposite was true of the emphasis placed on services. On the basis of these results, we concluded that the voice of the customer on this issue was that there was too little emphasis on service appli-cations and a bit too much emphasis on manufacturing applications; that is, we needed to increase the number of ser-vice applications and reduce the number the median was closer to the service end
of the continuum. One third of the sam-ple had nonbusiness undergraduate degrees. There were no baseline data to allow us to test whether the sample was representative of the MBA student body.
The Whats
Although some highly structured approaches such as AHP (Lam & Zhao, 1998) can be used during this phase, there are other, simpler approaches that
example, a total of four questions dealt with the sector focus issue (the mix of service and manufacturing applica-tions)—two questions from Section 2 of the questionnaire, and two questions from Section 3. Table 2 summarizes the relevant statistics for our illustration.
The data from Section 2 indicated that the respondents considered the con-tributions of both sectors to be well above the neutral response (5). Seventy-five percent of the sample responded 8, 9, or 10 (0 = none, 10 = very great) for
On the basis of these results, we concluded that
the voice of the customer on this issue was that
there was too little emphasis on service
applications and a bit too much emphasis on
manufacturing applications.
TABLE 1. Background Statistics for the Sample
Item Range Mdn M
Years of full-time work experience 0–29 4 6.04 Graduate hours completed at end of current
semester 3–36 16.5 17.42
of manufacturing applications. We also concluded that this was a relatively important issue to the students.
Statistics for the remaining design issues are summarized in Tables A1–A6 in the Appendix. Our conclusions regarding each design issue are shown in Table 3.
Given these results, we started build-ing our House of Quality. As can be seen in Figure 2, the customer requirements that we judged to be of importance to the students form the left room of the house.
The Hows
The next phase in developing a House of Quality was to determine the hows, or
the design requirements, for this course. The faculty members had already identi-fied the design issues for this course, so this phase was completed. These items formed the second-story room above the main room (see Figure 2).
The Relationship Matrix
After we had identified the whats and the hows and placed them in our House of Quality, the next step was to com-plete the relationship matrix formed in the main room. We examined each what (a row) and determined its relationship with each of the design issues (columns). If we thought there was a relationship, we estimated the strength of that relationship and noted it in the appropriate cell. By convention, the strength of the relationship was limited to one of three levels—small, medium, or strong. Each level was represented by a different symbol and given a numeric value of 1, 3, or 9, respectively (see Fig-ure 3). The numeric values were used in a subsequent phase. If we judged that there was no relationship, then we would leave that cell empty. The results of our analysis are shown in Figure 3.
The Correlation Matrix
The next step was to complete the cor-relation matrix (roof) by examining the relationship between each pair of hows (design issues). The objective of this phase was to explicitly recognize situa-tions in which the designation or specifi-cation of the value of one design issue
TABLE 2. Summary of the Sector Focus Statistics About Old Course
Section 2 Section 3
Contribution Contribution Emphasis Emphasis of of placed on placed on manufacturing service manufacturing service Statistic applications applications applications applications
M 7.61 8.11 4.81 3.03
Mdn 8 8 4.5 3
Md 9 8 4 3
Note. For Section 2, 0 =none and 10 = very great. For Section 3, 1 =much too little and 7 = much too great.
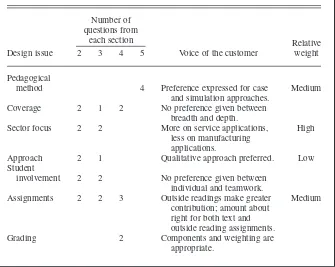
TABLE 3. Summary of the Voice of the Customer
Number of questions from
each section
Design issue 2 3 4 5 Voice of the customer
Pedagogical
method 4 Preference expressed for case Medium and simulation approaches.
Coverage 2 1 2 No preference given between breadth and depth.
Sector focus 2 2 More on service applications, High less on manufacturing
applications.
Approach 2 1 Qualitative approach preferred. Low Student
involvement 2 2 No preference given between individual and teamwork.
Assignments 2 2 3 Outside readings make greater Medium contribution; amount about
right for both text and outside reading assignments. Grading 2 Components and weighting are
appropriate.
Relative weight
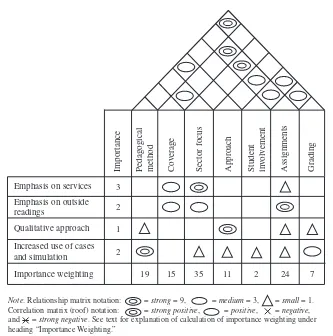
FIGURE 2. Building the House of Quality for course design. Emphasis on services
Emphasis on outside readings
Qualitative approach
Increased use of cases and simulation
Pedagogical method Co
v
erage
Sector focus Student inv
olv
ement
Approach Assignments Grading
affected or was affected by the designa-tion or specificadesigna-tion of the value of one or more other design issues; that is, an issue may not be independent of the others as far as the design process is concerned. This type of information was important to know when the final stages of the process were carried out.
If we thought there was a correlation between the members of a pair, we would estimate its strength and direction. Corre-lations were usually limited to four con-ventional situations—strong positive, positive, negative, and strong negative. The unique symbol used to represent each of the four options was placed in the appropriate cell. If there was no correla-tion between the members of the pair, the cell was left empty. The results are shown in Figure 3.
Importance Weighting
In this phase of building our House of Quality, we used the information devel-oped in the previous phases to calculate
a measure of importance for each how. These results allowed us to place a pri-ority on each issue that was considered in the design process.
Using the conventional 3-point scale of low, medium, high, we assigned a rel-ative importance value to each customer requirement based on our analysis of the questionnaire results in the previous phase (see the last column of Table 3). The second column of Figure 3, labeled importance,shows the results. By using
these values as the weights, we calculat-ed a design issue’s importance weight-ing measure by takweight-ing the weighted sum of its relationship strengths. As noted heretofore, we used the relationship strength values shown in Figure 3 for this calculation. For example, the importance weighting for Pedagogical Method (see Figure 3) is 19 (i.e., 1[Qualitative approach] ×1[relationship strength] + 2[Increased use of cases and simulation] × 9[relationship strength]). Figure 3 shows the results for the remaining design issues.
Setting Specifications
The next—and in our case, final— phase was to determine the specifica-tions of the product design (the course). The importance weighting measures in our House of Quality indicated that the three most important areas in the design process were sector focus (35), assign-ments (24), and pedagogical method (19). As we have noted in the section on the correlation matrix, sector focus and assignments had a strong positive rela-tionship, whereas pedagogical method was not related to either assignments or sector focus.
Based on this information, one way in which the first two areas, sector focus and assignments, could be addressed was to increase the number of outside readings that dealt with ser-vice applications and decrease those that had a manufacturing focus. This would alter the balance between sec-tors while increasing the total number of outside readings. We also had to consider the evaluation of the role of the text in the course. One alternative was to find a text with a greater focus on service than was the case for the old text. Another alternative was to reduce the role of a text by making a basic OM text optional, that is, by allowing a text to be a reference as needed by the student. This would place a greater reliance on the prerequisite course as the primary source of basic informa-tion on the various topic areas. By judiciously adjusting these assign-ments, we could move the sector bal-ance closer to the service end while the outside reading could be increased without increasing the overall load on the student.
The results indicated that cases and simulations should be integrated into the course: We could assign cases that had a significant emphasis on the service sec-tor, and we could include simulations that illustrated a service sector issue. In addi-tion, we could switch the student team effort to in-class presentations that focused on a case or a simulation.
CONCLUSIONS
As we conducted this endeavor, a variety of issues arose. For example,
FIGURE 3. House of Quality for course design. Emphasis on services
Emphasis on outside readings
Qualitative approach
Increased use of cases and simulation
Pedagogical method Co
v
erage
Sector focus Student inv
olv Correlation matrix (roof) notation: = strong positive, = positive, = negative, and = strong negative. See text for explanation of calculation of importance weighting under heading “Importance Weighting.”
was the customer properly identified for this product? In the case of course design, how instrumental should the students’ input be? Is a questionnaire the best way to gather the input? Are there other constituencies that should be considered, for example, members of faculty who teach courses for which the OM course is a prerequisite, employers, MBA alumni? How would their respective requirements for this course be assessed? If multiple con-stituencies were considered, how would we combine their requirements? Was the scope of our inquiry of our selected customer base wide enough; that is, were there some important issues that were omitted? Was the scope of our customer base broad enough; that is, should additional sections be surveyed? Should the feedback process be altered to facilitate the use of some more sophisticated procedure such as AHP in determining relative importance; that is, are the additional benefits worth the additional cost? Is the House of Quali-ty format needed to obtain similar out-comes?
A more general conclusion is that the process itself was a major benefit of this effort. This product (the course) is not complex, but the House of Quality was a useful framework for gathering, commu-nicating, and evaluating the customers’ requirements. In a structured manner, we were able to develop a fact-based foun-dation on which this course can be refined. It also provided a basis of informed discussions about the course with fellow OM faculty as well as non-OM faculty. This turned out to be an insightful and constructive process that yielded sound recommendations. It was much more valuable than the unilateral approach to course redesign that many faculty members use.
We have incorporated some of the modifications presented here. We have assigned more readings, incorporated a service focus in more of the readings, and lessened emphasis on the text. Informal comments about the redesigned course have been favorable. As a follow-up, we recommend that this assessment be repeated in a year or two.
NOTE
Michael H. Peters is deceased.
REFERENCES
Bahill, A. T., & Chapman, W. L. (1993). A tutori-al on Qututori-ality Function Deployment. Engineer-ing Management Journal, 5(3), 24–35. Bier, I. D., & Cornesky, R. (2001). Using QFD to
construct a higher education curriculum. Qual-ity Progress, 34(4), 64–67.
Chase, R. B., Aquilano, N. J., & Jacobs, F. R. (2001). Operations management (9th ed.). Boston: Irwin-McGraw-Hill.
Ermer, D. S. (1995). Using QFD becomes an edu-cational experience for students and faculty.
Quality Progress, 28(5), 131–136.
Hauser, J. R., & Clausing, D. (1988, May–June). The House of Quality. Harvard Business Review,63–73.
Jaraiedi, M. (1992). Total quality management
applied to engineering education.Morgantown, WV: Department of Industrial Engineering, West Virginia University.
Kinni, T. B. (1993). What’s QFD? Quality Function Deployment quietly celebrates its first decade in the U.S. Industry Week, 242(21), 31–32. Lam, K., & Zhao, X. (1998). An application of
Quality Function Deployment to improve the quality of teaching. International Journal of Quality & Reliability Management, 15(4–5), 389–414.
Pittman, G., Motwani, J., Kumar, A., & Cheng, C. H. (1996). QFD application in an educational setting: A pilot field study. International Jour-nal of Quality & Reliability Management, 13(4), 99–108.
Terninko, J. (1997). Step-by-step QFD: Customer-driven product design. Boca Raton, FL: CRC.
APPENDIX
TABLE A1. Summary of the Pedagogical Method Statistics
Pedagogical method
Statistic Lecture Seminar Case Simulation
M 4.81 4.90 5.33 5.41
Mdn 5 5 6 6
Md 5 6 6 6
Count 36 30 27 17
Note. 1 =very ineffective; 7 = very effective.
TABLE A2. Summary of the Coverage Statistics About Old Course
Section 2 Section 3 Section 4 Breadth Depth that Selection
of the an individual Number of topics
topics topic is of topics covered Material Statistic covered covered covered appropriate up to date
M 7.36 6.64 4.17 5.58 5.72
Mdn 7.5 7 4 6 6
Md 10 8 4 6 5
Note. For Section 2, 0 =none and 10 = very great. For Section 3, 1 =much too little and 7 = much too great.For Section 4, 1 = strongly disagree and 7 = strongly agree.
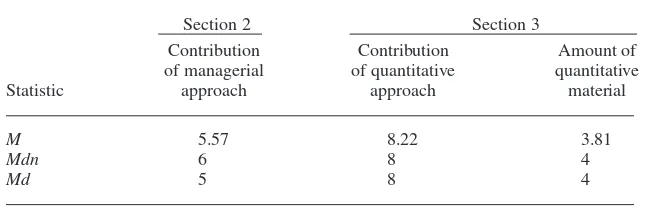
TABLE A3. Summary of the Approach Statistics About Old Course
Section 2 Section 3
Contribution Contribution Amount of of managerial of quantitative quantitative Statistic approach approach material
M 5.57 8.22 3.81
Mdn 6 8 4
Md 5 8 4
Note. For Section 2, 0 =none and 10 = very great. For Section 3, 1 =much too little and 7 = much too great.
TABLE A4. Summary of the Student Involvement Statistics About Old Course
Section 2 Section 3 Contribution Contribution Amount of
of of Overall individual team-based individual- amount (vs. team) Statistic work based work of work work
M 6.78 6.97 4.20 4.23
Mdn 7.50 7 4 4
Md 8 8 4 4
Note. For Section 2, 0 =none and 10 = very great. For Section 3, 1 =much too little and 7 = much too great.
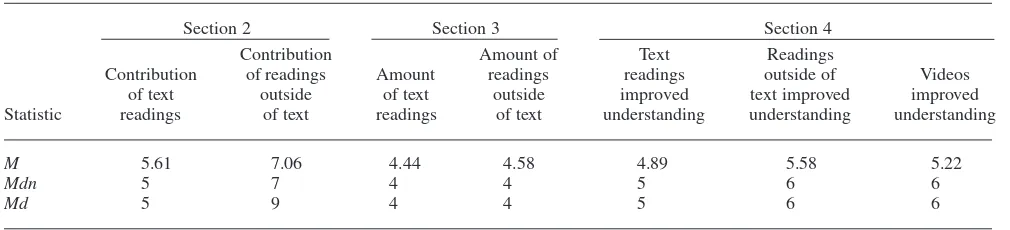
TABLE A5. Summary of the Assignment Statistics About Old Course
Section 2 Section 3 Section 4
Contribution Amount of Text Readings
Contribution of readings Amount readings readings outside of Videos of text outside of text outside improved text improved improved Statistic readings of text readings of text understanding understanding understanding
M 5.61 7.06 4.44 4.58 4.89 5.58 5.22
Mdn 5 7 4 4 5 6 6
Md 5 9 4 4 5 6 6
Note. For Section 2, 0 =none and 10 = very great. For Section 3, 1 =much too little and 7 = much too great.For Section 4, 1 = strongly disagree and 7 =
strongly agree.
TABLE A6. Summary of the Grading Statistics
Section 4 Weighting Grading of components components Statistic appropriate appropriate
M 5.44 5.14
Mdn 6 5
Md 6 7
Note. For Section 4, 1 = strongly disagree
and 7 = strongly agree.