Full Terms & Conditions of access and use can be found at
http://www.tandfonline.com/action/journalInformation?journalCode=vjeb20
Download by: [Universitas Maritim Raja Ali Haji] Date: 11 January 2016, At: 22:10
Journal of Education for Business
ISSN: 0883-2323 (Print) 1940-3356 (Online) Journal homepage: http://www.tandfonline.com/loi/vjeb20
Business Students’ Perceptions, Attitudes, and
Satisfaction With Interactive Technology: An
Exploratory Study
Jacqueline Kilsheimer Eastman , Rajesh Iyer & Kevin L. Eastman
To cite this article: Jacqueline Kilsheimer Eastman , Rajesh Iyer & Kevin L. Eastman (2011) Business Students’ Perceptions, Attitudes, and Satisfaction With Interactive Technology: An Exploratory Study, Journal of Education for Business, 86:1, 36-43, DOI: 10.1080/08832321003774756
To link to this article: http://dx.doi.org/10.1080/08832321003774756
Published online: 20 Oct 2010.
Submit your article to this journal
Article views: 166
View related articles
ISSN: 0883-2323
DOI: 10.1080/08832321003774756
Business Students’ Perceptions, Attitudes, and
Satisfaction With Interactive Technology: An
Exploratory Study
Jacqueline Kilsheimer Eastman
Georgia Southern University, Statesboro, Georgia, USA
Rajesh Iyer
Bradley University, Peoria, Illinois, USA
Kevin L. Eastman
Georgia Southern University, Statesboro, Georgia, USA
The authors modeled the relationships between students’ perceptions of interactive technology in terms of whether it helps them pay more attention and be better prepared in a Consumer Behavior course and their attitude toward and satisfaction with it. The results suggest that students who feel they pay more attention due to the use of Interactive Technology have a more positive attitude toward it. Additionally, those students who have a more positive attitude toward Interactive Technology are more satisfied with its use. There is not, however, a significant relationship between students feeling more prepared for the course due to the use of Interactive Technology and their attitude toward it.
Keywords: audience response systems, clicker satisfaction, interactive technology
Faculty members are always looking for ways to keep their students’ attention, encourage better preparation for class, and improve students’ attitudes and satisfaction. Whereas for some professors these are not areas of concern, from our ex-periences at conferences and informal discussions with other professors, these areas come up frequently as concerns for faculty. Lincoln (2008), in discussing the issues with large classes, noted the challenges (a) facing faculty members to get students to attend class, pay attention, and participate; and (b) for faculty to understand where students are at in their learning process and to manage the course effectively. Interactive Technology (also called audience-response sys-tems or clickers) may be one technological tool that can help faculty accomplish these goals (Lincoln; Terreri & Simons, 2005). Kurdziel (2005) noted five reasons for educators to use an audience response system: (a) to address the limi-tations of traditional lectures, (b) to engage students, (c) to
Correspondence should be addressed to Jacqueline Kilsheimer Eastman, Georgia Southern University, Department of Management, Marketing, and Logistics, P. O. Box 8154, Statesboro, GA 30460–8154, USA. E-mail: jeastman@georgiasouthern.edu
provide feedback to both students and instructors, (d) to ef-fectuate learning gains, and (e) to realize improvements in attitudes. An advantage of using Interactive Technology is that it gives a professor an objective means to track partici-pation. With this technology, all students, even those who do not like to speak up in class, have the ability to get involved, participate, and provide their opinions and answer questions. “When properly used, clickers can make the classroom expe-rience more engaging and enjoyable for students and there-fore generate improved attendance levels” (Lincoln, p. 39). Nelson and Hauck (2008) noted that with large classes it is nearly impossible to take attendance, conduct in-class activi-ties, and utilize in-class surveys without the use of Interactive Technology.
As described in Eastman (2007), Interactive Technology involves the classroom use of individual response pads by students to answer questions posted via PowerPoint. These response pads are similar in appearance to a television remote control device and are numbered, with each student having a response pad to be used for the entire semester. There is a wireless response system, hooked up to a professor’s laptop computer or to a desktop computer in the classroom, that
STUDENT PERCEPTIONS OF INTERACTIVE TECHNOLOGY 37
gives the professor immediate feedback from every student in the class. The software creates an electronic code that it as-signs to a keypad and a keypad user’s profile; this information is merged and can be exported to a database or spreadsheet (Krantz, 2004). The professor could post a question via a PowerPoint slide and the students would individually click their responses. On the PowerPoint screen it would note each number pad and whether there was a response, but would not show any individual responses onscreen. Software on the computer could then be used to instantly track responses by an individual student and post the aggregate results. With this technology, professors get instant, specific feedback and students get the chance to express their thoughts and see what others in the class are thinking (Terreri & Simons, 2005).
Although there have been numerous articles discussing the use and benefits of Interactive Technology in the class-room and other venues (see Eastman, 2007), there have been few business academic articles that have tested the impact of Interactive Technology and none that have modeled the educational constructs impacted by the use of Interactive Technology. Lincoln (2008) described the use of clickers with a large-size principles of marketing class and discussed student feedback on the use of clickers and his recommen-dation for their use. Similarly, Nelson and Hauck (2008) addressed the use of clickers in an introduction management information systems course, as did Ghosh and Renna (2009) in economics classes. Paladino (2008) noted that educational technology can induce active learning, improve students’ un-derstanding, and assist in forming competencies. Matulich, Papp, and Haytko (2008) stressed the need for continuous improvement and constant innovations to engage students. Although innovation in the classroom is worthwhile and it is important that professors discuss and share their experiences with students, it is also vital that the usefulness and impact of these activities be determined. Toral, Barrero, Martinez-Torres, Gallardo, and Duran (2009) note the need for more scientific analyses to assess learner satisfaction and the fac-tors that impact it. This paper contributes to the literature by addressing the usefulness and impact of the use of Interactive Technology.
This article is one of the first to model the constructs of attention, preparation, attitude, and satisfaction as they relate to the use of Interactive Technology in a business course. We chose these constructs to focus on because they relate to the use of Interactive Technology as a means of improving the impact of our teaching. We first provide some background on Interactive Technology, focusing on what the literature has said about attention, preparation, attitude and satisfaction with Interactive Technology. Next, we describe a year-long (two-semester) study involving three sections of consumer behavior students that measures their perceptions in terms of attention, preparation, attitude, and satisfaction regarding Interactive Technology. We explain how each construct is measured and purified, and then test a model of the rela-tionships between these constructs. Finally, we discuss the implications of our findings.
LITERATURE REVIEW
With Interactive Technology, students know that their opin-ions are being heard equally, and professors can get immedi-ate feedback on the performance of the class as a whole while tracking individual students behind the scenes to pinpoint specific concerns (Terreri & Simons, 2005) and to determine if more time is needed on a specific topic (Cohen, 2005). Carnaghan and Webb (2005) noted the benefit of increasing interactivity for students regardless of class size, and that the use of Interactive Technology allows professors to focus on problems revealed by the students’ responses. Taylor (2007) described the benefit of utilizing Interactive Technology in large lectures to increase students’ active involvement. Fi-nally, per Hoffman and Goodwin (2006), they suggested that the use of Interactive Technology ensures interaction, keeps students focused, increases participation, promotes discus-sion, and increases retention. We hope to better determine the impact of Interactive Technology in this study.
Hatch (2003) suggested the following uses for audience response technology for meetings and training sessions: (a) two-tiered questions (initial questions with follow-up items), (b) brainstorming (measuring reactions to ideas), (c) pre- and posttests of material learned, (d) as an icebreaker to start a lesson, and (e) as a feedback mechanism (especially when anonymous feedback is useful). All individuals would have an assigned individual response pad so that teachers could track who was responding, who was attending, and what their scores were, but their responses would be anonymous to the other participants. Finally, Cohen (2005) noted that Interactive Technology can be utilized to find out if students understand the material, as well as to take attendance and administer exams. Thus, there are a number of ways that professors could benefit from using Interactive Technology to enhance communication in their courses.
Eastman (2007) described using Interactive Technology in the classroom: (a) for opinion questions (in which any answer was correct) to introduce topics and highlight opinions, (b) for open-ended questions with students selected at random to participate, and (c) for multiple choice questions to measure students’ knowledge of the material and determine if the class is ready to move on to the next topic. These questions were included on exams as an incentive for the students to learn the material (Eastman). There were approximately 6–8 questions created per chapter and this participation was worth 5% of the final course average (Eastman). Lincoln (2008) presented sample clicker questions and suggestions for the use of clickers in designing pedagogy.
Attention and Preparation
The literature consistently suggests that Interactive Technol-ogy can be very useful in gaining the attention and interest of students because it gives them the opportunity to share their ideas in an anonymous way and requires them to respond frequently to the material being presented (Cohen 2005;
Simpson, 2007; Taylor, 2007; Terreri & Simons, 2005; Unmuth, 2004). Lincoln (2008) found that the majority of students perceive that clickers help keep their attention. Stone, Escoe, and Schenk (1999) suggested that seeing their responses on screen in a class increases the students’ sense of importance and thus their involvement. Attendance and par-ticipation has also improved using this technology (Cohen; Kurdziel, 2005; Lincoln). Nelson and Hauck (2008) noted that the literature described the short attention span of stu-dents, how students’ providing feedback improves attention, and how students’ attention relates to their motivation to per-form in a classroom. Matulich et al. (2008) suggested that Interactive Technology can be helpful in addressing the short attention span of students. Cohen noted that students like the instant feedback, as it makes them more aware of their learning difficulties. Carnaghan and Webb (2005), however, found that Interactive Technology does not result in overall better test grades.
Thus, the literature suggests that Interactive Technology can improve attention in a class, but there has been lit-tle discussion of whether it impacts the students’ prepa-ration for the class. Furthermore, whereas Nelson and Hauck (2008) suggest that with improved attention students are more motivated, the literature has not tested the im-pact of perceived attention on attitude toward Interactive Technology.
Attitude and Satisfaction
Toral et al. (2009) offered that satisfaction relates to per-ceptions of being able to achieve success and the feeling of achieving desired outcomes. Furthermore they stressed the idea that “learner satisfaction must be explored through a multidimensional analysis that considers a wide variety of critical dimensions so as to provide effective metrics that guide improvements in instructional design” (Toral et al., p. 190). Their analysis of satisfaction in an electronic in-strumentation course found satisfaction to be driven by the user interface, ease of use, enthusiasm, and motivation. This suggests that attitude does impact satisfaction and that both cognitive and affective dimensions need to be considered (Toral et al.). Chen and Williams (2008) offered that the ease of using technology (i.e., how smooth running the technology is) impacts students’ attitudes toward it. Savage (2009) sug-gested that the use of information technology, specifically in terms of downloading lecture materials, did not appear to have substantive impact on student performance. Khan (2009) offered that those who use computers more often feel more engaged in their learning and feel more that com-puters aided their learning and interaction with faculty and students.
In terms of Interactive Technology, Carnaghan and Webb (2005) compared student satisfaction and exam performance in different sections of a management course (where Inter-active Technology was used in different parts of the course).
Although there was evidence of student satisfaction, exam performance improved only for items closely related to those displayed in class (Carnaghan & Webb, 2005). However, Ghosh and Renna (2009) found that students perceive that Interactive Technology improved their class performance. Nelson and Hauck (2008) offered that with greater levels of clicker usage, students perceive greater levels of learning and benefits of using clickers.
A pilot program by an Interactive Technology provider measuring the impact of Interactive Technology on college marketing students found that: (a) 87% of students reported they were more likely to attend class, (b) 72% of students reported they were more likely to participate, (c) 61% of stu-dents reported they were more focused on the lecture, (d) 70% of students reported they improved their understanding of specific concepts, and (e) 63% of students reported that class was more fun (Thomson Learning and Turning Technologies, 2006). Research suggests that students like using Interactive Technology and that it makes class more enjoyable (Fitch, 2004; Hoffman & Goodwin, 2006; Lincoln, 2008). Simpson (2007) reported that a survey of students at one university found that three out of four students were satisfied with the use of the Interactive Technology, whereas Taylor (2007, p. 73) noted typical “clicker satisfaction rates of 80% or more.” Similarly, Lincoln found that the majority of students found that clickers were easy and fun to use and not a hassle to bring to class, and want to see more use of them in future classes. Ghosh and Renna (2009) found Interactive Technol-ogy to be well received by students and that students want it adopted at the institutional level. Thus, the literature does suggest that students like using Interactive Technology and are satisfied with it. What the literature has not measured, though, is how attitudes toward Interactive Technology im-pact satisfaction with it.
HYPOTHESES
Building on the literature, we proposed three hypothe-ses to test the relationships between attention, prepara-tion, attitude, and satisfaction with Interactive Technology. The model illustrated by these relationships is shown in Figure 1.
Hypothesis 1 (H1): Students who feel that the use of Inter-active Technology will help them pay more attention in a course would have a more positive attitude toward the use of Interactive Technology.
H2: Students who feel that the use of Interactive Technology helps them be better prepared in a course would have a more positive attitude toward the use of Interactive Technology.
H3: Students who have a positive attitude toward the Interac-tive Technology would be more satisfied with InteracInterac-tive Technology.
STUDENT PERCEPTIONS OF INTERACTIVE TECHNOLOGY 39
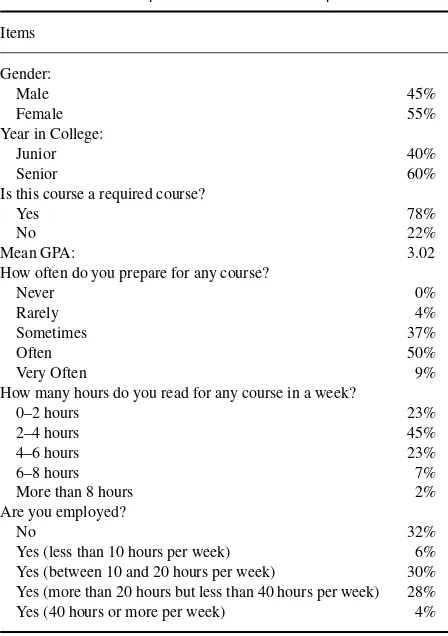
The sample was made up of 97 Consumer Behavior stu-dents from a southeastern regional university from the three sections of the course taught over two semesters. Consumer Behavior is a required course for marketing majors and an elective business course for other business majors. Although the sample was a convenience sample, all students taking the course over a year were included and the course was re-quired for all marketing majors. Thus, we feel there was a good representation of the marketing students in the course. Enrollment in the course ranged from 32 to 48 students with a mean enrollment of 37.667 students (SD = 8.962). The demographics of the sample are provided in Table 1. Ad-ditionally, 64% of the respondents were marketing majors, 11% were management majors, and the remaining 25% were double majors (marketing and management, marketing and finance, or other). This survey was given the last week of class. Students received one point of extra credit to their av-erage grade in the course if they completed the survey, but the students did not put their name on the survey. No students refused to participate in the surveys so nonresponse bias was not an issue.
The Interactive Technology was utilized in a manner sim-ilar to that described by Eastman (2007). It was utilized frequently in every class (approximately six to eight ques-tions per chapter) in a variety of ways (open-ended quesques-tions, opinion questions, and graded questions that were later uti-lized in the exams). Student participation represented 5% of their final course average.
Construct Operationalization
To measure the constructs, the survey included items either created by us or adapted from other pedagogical research. Several of the items came from Carnaghan and Webb’s
TABLE 1
Is this course a required course?
Yes 78%
No 22%
Mean GPA: 3.02
How often do you prepare for any course?
Never 0%
Rarely 4%
Sometimes 37%
Often 50%
Very Often 9%
How many hours do you read for any course in a week?
0–2 hours 23%
2–4 hours 45%
4–6 hours 23%
6–8 hours 7%
More than 8 hours 2%
Are you employed?
No 32%
Yes (less than 10 hours per week) 6% Yes (between 10 and 20 hours per week) 30% Yes (more than 20 hours but less than 40 hours per week) 28%
Yes (40 hours or more per week) 4%
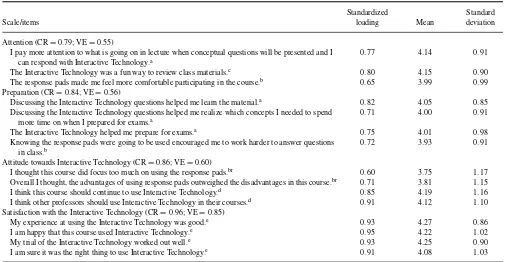
(2005) working paper measuring the impact of Interactive Technology. Several items from Kurdziel (2005) looking at the impact of Interactive Technology in large biology lectures were also utilized. Some of Massey, Brown, and Johnston’s (2005) items measuring the impact of using games (such as crossword puzzles andJeopardy!) to review materials were also adapted. Finally, the satisfaction items were adapted and modified from Cole and Balasubramanian (1993), Arnould and Price (1993), and Fisher and Price (1991). All of our sur-vey items were on a 5-item Likert-type scale ranging from 1 (strongly disagree) to 5 (strongly agree). The survey items were reviewed by several business faculty members for face and content validity. The specific sources utilized for the var-ious measures are noted in Table 2 along with the means and standard deviations of the individual items.
Measures and Purification
Toral et al. (2009) stressed the need to use structural equa-tion modeling to establish a scientific model of learner sat-isfaction. Following a process recommended by Anderson and Gerbing (1988), the measurement quality of the indi-cators was evaluated. Anderson and Gerbing recommended that researchers first refine the measurement model before testing the structural component of the model. This two-step procedure has been widely adopted in marketing. The
TABLE 2 Measurement Items
Scale/items
Standardized
loading Mean
Standard deviation
Attention (CR=0.79; VE=0.55)
I pay more attention to what is going on in lecture when conceptual questions will be presented and I can respond with Interactive Technology.a
0.77 4.14 0.91
The Interactive Technology was a fun way to review class materials.c 0.80 4.15 0.90
The response pads made me feel more comfortable participating in the course.b 0.65 3.99 0.99
Preparation (CR=0.84; VE=0.56)
Discussing the Interactive Technology questions helped me learn the material.a 0.82 4.05 0.85 Discussing the Interactive Technology questions helped me realize which concepts I needed to spend
more time on when I prepared for exams.a
0.71 4.00 0.91
The Interactive Technology helped me prepare for exams.a 0.75 4.01 0.98
Knowing the response pads were going to be used encouraged me to work harder to answer questions in class.b
0.72 3.93 0.91
Attitude towards Interactive Technology (CR=0.86; VE=0.60)
I thought this course did focus too much on using the response pads.br 0.60 3.75 1.17
Overall I thought, the advantages of using response pads outweighed the disadvantages in this course.br 0.71 3.81 1.15
I think this course should continue to use Interactive Technology.d 0.85 4.19 1.16
I think other professors should use Interactive Technology in their courses.d 0.91 4.12 1.10
Satisfaction with the Interactive Technology (CR=0.96; VE=0.85)
My experience at using the Interactive Technology was good.e 0.93 4.27 0.86
I am happy that this course used Interactive Technology.e 0.95 4.22 1.02
My trial of the Interactive Technology worked out well.e 0.93 4.25 0.90
I am sure it was the right thing to use Interactive Technology.e 0.91 4.08 1.03
Composite Reliability (CR) and variance extracted (VE) are provided for each scale. Sources used to measure the scale.
aKurdziel (2005);bCarnaghan and Webb (2005);cMassey, Brown and Johnston (2005);dNew (created by the authors);eCole and Balasubramanian (1993);
Arnould and Price (1993); Fisher and Price (1991);rReverse Coded items.
goal was to identify a final set of items with acceptable discriminant and convergent validity, internal consistency, and reliability (Hair, Black, Babin, Anderson, & Tatham, 2006).
Every single item was subjected to a confirmatory factor analysis. All factor loadings were significant at the 0.01 level and all individual reliabilities were far above the required value of 0.4 (Bagozzi & Baumgartner, 1994). According to the recommendations of Bagozzi and Yi (1991) and Bagozzi and Baumgartner, a composite reliability of at least 0.7 is desirable. This requirement was met. After having assessed
the individual factors, the reduced set of items was subjected to a confirmatory factor analysis using maximum likelihood estimation. The results of the analysis are summarized in Tables 2 and 3. Also listed in Table 3 are the means, stan-dard deviations, and coefficient alphas for each of the four constructs we examined.
Although the chi-square value was significant, χ2(84, N=97)=128.96,p<.001, other goodness of fit measures
indicate a good overall fit of the model to the data (see Baum-gartner & Homburg, 1996): root mean square error of approx-imation (RMSEA)=0.07, nonnormed fit index (NNFI)=
TABLE 3
Construct Correlations, Means, Standard Deviations and Coefficient Alphas
Construct Mean
Standard deviation
Coefficient
alpha 1 2 3 4
1. Attention 4.09 0.76 0.74 1
2. Preparation 4.00 0.74 0.82 0.758∗ ∗ 1
3. Attitude towards Interactive Technology
3.97 0.95 0.84 0.707∗ ∗ 0.671∗ ∗ 1
4. Satisfaction with Interactive Technology
4.20 0.91 0.96 0.802∗ ∗ 0.742∗ ∗ 0.842∗ ∗ 1
∗ ∗
Correlation significant atp<.01.
STUDENT PERCEPTIONS OF INTERACTIVE TECHNOLOGY 41
0.98, incremental fit index (IFI)=0.99, and confirmatory fit index (CFI)=0.99.
Construct Validity Assessment
In addition to the previous analysis, other analyses were con-ducted to provide more confidence concerning the measure-ment properties of the scale. The next step was assessing the convergent and discriminant validities of the model. All factor loadings are significantly different from zero (consis-tently large t values). To assess discriminant validity, the procedure suggested by Bagozzi and Yi (1991) was fol-lowed. This calls for two models to be estimated for each pair of constructs—one model in which the correlation be-tween the two variables is allowed to be freely estimated and one model in which the correlation is constrained to be equal to zero. If theχ2value of the unconstrained model is
more than 3.84 less than that of the constrained model (where 3.84 is the critical value for one degree of freedom) there is evidence of discriminant validity. In all cases the chi square for the unconstrained model was significantly less than that for the constrained model, suggesting that the factors exhibit discriminant validity. Finally, the reliability of the scales was assessed via the calculation of composite reliability scores. These scores ranged from 0.79 to 0.96, which are all above the cutoff of 0.6 suggested by Bagozzi and Yi. Based on the results of the preceding analysis, we believe that our measures have sufficient validity and reliability to allow the testing of the hypotheses presented previously.
Structural Model Equation
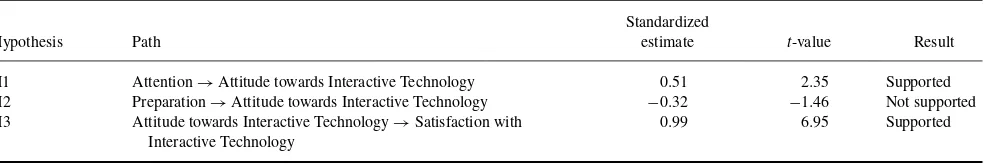
The hypotheses were tested within the framework (see Figure 1) of structural equation modeling through LISREL 8 (J¨oreskog & S¨orbom, 1993) using the measures indicated in Table 2. The construct correlations, means, and standard deviations are presented in Table 3. The results of the test of hypotheses are presented in Table 4. The fit of the data to the proposed model (see Figure 1) was quite good,χ2(86,N=
97)=140.04,p<.01; RMSEA=0.07; IFI=0.98; CFI=
0.99; NNFI=0.99.
There is support for two of the three hypotheses. The first hypothesis tested whether students who perceived that the use of Interactive Technology helped them pay more atten-tion in a course had a more positive attitude toward the use of
Interactive Technology. This hypothesis was supported. This suggests that students who perceive that Interactive Technol-ogy is a useful attention-getting device for class are likely to use Interactive Technology more. The second hypothe-ses tested whether students who perceived that the use of Interactive Technology helped them be better prepared in a course had a more positive attitude toward the use of In-teractive Technology. This hypothesis was not supported. Whether students feel that the Interactive Technology helps them better prepare for class does not impact whether they will like using Interactive Technology. This could be because students attribute their level of preparation for the course to their own efforts and not the use of technology. Also, as their participation was 5% of their final course average, they might have perceived that the technology had an impact with their preparation there, but not in terms of exams. They also might have had concerns with the use of technology as a means to measure their participation grade. Finally, the third hypothe-sis tested whether students who perceived a positive attitude toward the Interactive Technology were positively satisfied with the Interactive Technology. This hypothesis was sup-ported. Students who felt that they liked using Interactive Technology were more likely to be satisfied with it.
DISCUSSION
Our findings suggest that students perceive Interactive Tech-nology as encouraging them to pay more attention in a course. This result can be seen in the high average attention response of 4.09 (on a scale of 1–5) to the three items measuring attention. Students perceived that they did pay more atten-tion, had more fun reviewing the materials, and felt more comfortable participating in a course that utilized Interactive Technology. These results are similar to those found by Lin-coln (2008) and Ghosh and Renna (2009). Furthermore, our research extends this line of research by illustrating that there is a positive relationship between students’ perceived atten-tion and their attitudes toward using Interactive Technology. If students perceive that they pay more attention due to the use of Interactive Technology, they are more likely to have a positive attitude toward Interactive Technology.
There is also a high average preparation response (4.00 on a scale of 1–5), but this is not related to the students’
TABLE 4
LISREL Results for the Hypothesized Model
Hypothesis Path
Standardized
estimate t-value Result
H1 Attention→Attitude towards Interactive Technology 0.51 2.35 Supported
H2 Preparation→Attitude towards Interactive Technology −0.32 −1.46 Not supported H3 Attitude towards Interactive Technology→Satisfaction with
Interactive Technology
0.99 6.95 Supported
attitudes toward Interactive Technology. For the most part, students perceived that Interactive Technology helped them learn the material, prepare for exams, and work harder. This was not, however, significantly related to whether they liked using Interactive Technology. In fact, the relationship be-tween preparation and attitude was negative but not signifi-cant. Thus, it may be that students attribute their extra effort to themselves rather than to the technology or that what they like about Interactive Technology is that it is fun to use in class and not that it enhances their learning. Also, the fact that their participation affected their grade might have impacted their attitudes.
Finally, in terms of attitude and satisfaction with Inter-active Technology, the mean response was also fairly high, particularly in terms of satisfaction (4.20 on a scale of 1–5). This suggests that, overall, students like and are satisfied with Interactive Technology. This is similar to the findings by Lincoln (2008). Furthermore, our research extends this line of research, as our model found a significant positive re-lationship between liking Interactive Technology and being satisfied with it.
As an initial study, there are several limitations that ad-ditional research would need to address. The first is that the study, though it included two semesters and three sections of teaching with Interactive Technology, involved only 97 students. This is a significant limitation. A larger sample of students is needed to determine if the findings hold. Addi-tionally, more research is needed with a variety of faculty and business courses to more fully determine the effectiveness of Interactive Technology in the classroom. By using a variety of faculty and courses, it could be better determined how the overall teaching quality of the professor and the subject taught impacted student perceptions of Interactive Technol-ogy. It also needs to be determined if making participation a portion of the overall course grade had an impact on students’ perceptions of the technology.
There is also a concern that although students and teach-ers appear to like Interactive Technology, its use may not enhance learning (Carnaghan & Webb, 2005; Taylor 2007). Researchers need to consider the teaching excellence of the faculty involved to determine the impact of technology versus the impact of the professor’s teaching ability. The literature emphasizes that clicker technology by itself does not im-prove the classroom experience and that faculty still need to focus on learning objectives and pedagogy; for example, the use of a contingent teaching style (i.e., flexibility in teaching based on students capture of material), peer-based learning, and the need for effective clicker questions, such as concept test questions (Ghosh & Renna, 2009; Lincoln 2008; Nelson & Hauck, 2008). Future researchers can test different peda-gogical uses of Interactive Technology. Additionally, future researchers should relate students’ perceptions with Interac-tive Technology with their comfort with using technology (e.g., based on Cauley, Aiken, & Whitney’s [2010]) Com-puter Comfort Scale that measures students’ apprehension,
enjoyment, and confidence with using computers). Finally, there is a limitation of the data being self-reported by the students. Thus, more research utilizing both self-reports and other types of data is needed to fully determine the learning outcomes that can and cannot be accomplished with the use of Interactive Technology.
A significant contribution of this study to the literature is the development and organization of demonstrated reliable and valid measures that can be used in future studies to measure the impact of Interactive Technology. Thus, we hope to contribute to the literature by initiating discussion and research measuring the impact of this pedagogical tool.
CONCLUSION
We examined students’ perceptions of their attention and preparation for class through the use of Interactive Tech-nology. Additionally, we measured students’ attitudes and satisfaction with the use of Interactive Technology. Over-all, students’ attention, preparation, attitude, and satisfaction with Interactive Technology was fairly high (ranging from 3.97 to 4.20 on a scale of 1–5). In testing the relationships between these four constructs, there was a significant positive relationship between attention and attitudes toward Interac-tive Technology and between attitudes and satisfaction with Interactive Technology. There was not a significant relation-ship between students’ preparation and their attitudes toward Interactive Technology. Thus, two of the three hypotheses were supported. We provided measures of these constructs and demonstrated the reliability and validity of the measures to encourage additional research on the impact of Interactive Technology in the classroom.
REFERENCES
Anderson, J. C., & Gerbing, D. W. (1988). Structural equation modeling in practice: A review and recommended two-step approach.Psychological Bulletin,103, 411–421.
Arnould E. J., & Price, L. L. (1993). River magic: Extraordinary experience and the extended service encounter.Journal of Consumer Research,20, 24–45.
Bagozzi, R. P., & Baumgartner, H. (1994). The evaluation of structural equation models and hypothesis testing. In R. P. Bagozzi (Ed.),Principles of marketing research(pp. 386–422). Cambridge, England: Blackwell. Bagozzi, R. P., & Yi, Y. (1991). Assessing construct validity in organizational
research.Administrative Science Quarterly,36, 459–489.
Baumgatner, H., & Homburg, C. (1996). Applications of structural equation modeling in marketing and consumer research: A review.International Journal of Research in Marketing,13, 139–161.
Carnagan, C., & Webb, A. (2005).Investigating the effects of group response systems on learning outcomes and satisfaction in accounting education. Working paper from the School of Accountancy at the University of Waterloo, Ontario, Canada.
Cauley, F. G., Aiken, K. D., & Whitney, L. K. (2010). Technologies across our curriculum: A study of technology integration in the classroom. Jour-nal of Education for Business,85, 114–118.
STUDENT PERCEPTIONS OF INTERACTIVE TECHNOLOGY 43
Chen, H.-L., & Williams, J. P. (2008). Use of multi-modal media and tools in an online information literacy course: College students’ atti-tudes and perceptions.The Journal of Academic Librarianship,35(1), 14– 24.
Cohen, S. (2005, July 14). Personal response systems changing college classrooms.Knight Ridder Tribune Business News, 1.
Cole, C. A., & Balasubramanian, S. K. (1993). Age differences in con-sumers’ search for information: Public policy implications.Journal of Consumer Research,20, 157–169.
Eastman J. K. (2007). Enhancing classroom communication with interactive technology: How faculty can get started.International College Teaching Methods & Styles Journal,3(1), 31–38.
Fisher, J., & Price, L. L. (1991). The relationship between international travel motivations and cultural receptivity.Journal of Leisure Research, 23, 193–208.
Fitch, J. L. (2004). Student feedback in the college classroom: A technol-ogy solution.Educational Technology Research and Development,52(1), 71–81.
Ghosh, S., & Renna, F. (2009). Using electronic response systems in economics classes. Journal of Economic Education, 40, 354– 365.
Hair, J. F. Jr., Black, W. C., Babin, B. J., Anderson, R. E., & Tatham, R. L. (2006).Multivariate data analysis. NJ: Pearson Prentice Hall.
Hatch, S. (2003). ARS systems: Creativity and planning required.Corporate Meetings & Incentives,22(11), 35–36.
Hoffman, C., & Goodwin, S. (2006). A clicker for your thoughts: Technology for active learning.New Library World,107, 422–433.
J¨oreskog, K. G., & S¨orbom, D. (1993).LISREL 8: A guide to the program and applications. Chicago, IL: Scientific Software International. Khan, M. B. (2009). Effects of information technology usage on student
learning—An empirical study in the United States.International Journal of Management,26, 354–364.
Krantz, M. (2004). Audience response systems=Marketing tools.Meeting News,28(5), 5.
Kurdziel, J. (2005). Engaging students in large lectures using a class-room response system. Retrieved from www.crlt.umich.edu/faculty/ JoKurdziel02–05.pdf
Lincoln, D. J. (2008). Teaching with clickers in the large-size principles of marketing class.Marketing Education Review,18(1), 39–45.
Massey, A. P., Brown, S. A., & Johnston, J. D. (2005). It’s all fun and games. . .until students learn.Journal of Information Systems Education, 16(1), 9–15.
Matulich, E., Papp, R., & Haytko, D. L. (2008). Continuous improvement through teaching innovations: A requirement for today’s learners. Mar-keting Education Review,18(1), 1–7.
Nelson, M. L., & Hauck, R. V. (2008). Clicking to learn: A case study of embedded radio-frequency based clickers in an introductory management information systems course.Journal of Information Systems Education, 19(1), 55–64.
Paladino, A. (2008). Creating an interactive and responsive teaching environ-ment to inspire learning.Journal of Marketing Education,30, 185–188. Savage, S. J. (2009). The effect of information technology on economic
education.Journal of Economic Education,40, 337–353.
Simpson, S. (2007, January 28). Faculty telling students to “click”: Tech-nology makes it easier for professors to give quizzes and foster classroom discussions.Knight Ridder Tribune Business News, 1.
Stone, L., Escoe, G. M., & Schenk, R. (1999). Multimedia instruction meth-ods.Journal of Economic Education,30, 265–275.
Taylor, P. S. (2007). Can clickers cure crowded classes? Maclean’s, 120(26/27), 73.
Terreri, A., & Simons, T. (2005). What are they thinking?Presentations, 19(2), 36.
Thomson Learning and Turning Technologies. (2006). Thomson learn-ing and turnlearn-ing technologies pilot reveals college students more likely to attend class and interact with instructor as a result of added technology resources. Retrieved from http://www.turningtechnologies. com/company/pressroom/pressreleases/2006/?i=53
Toral, S. L., Barrero, F., Martinez-Torres, M. R., Gallardo, S., & Duran, M. J. (2009). Modeling learning satisfaction in an electronic instrumen-tation and measurement course using structural equation models.IEEE Transactions on Education,52(1), 190–199.
Unmuth, K. L. (2004, March 30). Wichita, Kansas college students try out classroom interaction technology.Knight Ridder Tribune Business News, 1.