PASSENGER SOCIO ECONOMIC APPROACH AND
SERVICE QUALITY OF PUBLIC TRANSPORT IN
DETERMINING BUS FARE
Ika Setiyaningsih
1, Renaningsih
1 1Muhammadiyah University of Surakarta, Civil Enginering Department,
Faculty of Engineering,
Jl. A. Yani Tromol Pos I Pabelan Kartasura Surakarta 57102, Indonesia
[email protected] (Ika Setiyaningsih)
Abstract
Determining the amount of public transport fares often creates a conflict of interest between
public transport operators and users. Usually the problem will arise if the community has
Ability To Pay (ATP) and Willingness To Pay (WTP) lower than the amount of public
transportation tariffs set by the Government. Especially for those who are captive users
including community groups who rely on public transportation and have no other choice
alternatives.
This study focuses on the ideal tariff which willing and able to be paid by the user. ATP
analysis based on socio economic characteristics user such as family income, total
transportation cost, and total budget allocation for transport. WTP can be determine from user
percepsion of service quality provide by the operator.
Data was collected by questioner. The respondent were the passenger of AKAP economic bus
with air conditioner facility, route Yogyakarta-Surabaya which represent by PO. Mira.
It was found that the current tariff (Rp 38.000,00) already meet the limits set by the
Government, between Rp 30,000.00 - Rp 48,000.00. The current tariff was also lower than
ATP (Rp 42.600,00) and higher than WTP (Rp 35.600,00). That is, the current conditions of
service, users are able and willing to pay the applicable rates. Based on the BOK (vehicle
operational cost), ATP, and WTP, it was found that the ideal tariff should be between Rp
34.200,00
–
Rp 35.600,00.
Keywords : ability to pay, willingness to pay, tariff
Presenting Author’s biography
1
General
Transportation is the movement of people and or goods from one place to another place. The process can be done by using means of transportation in the form vehicles or no vehicles. The purposes of transportation according to Warpani (1990) :
1. realize the implementation of a saved transportation service, secure, fast, current, orderly, and comfortable,
2. cost-efficient and affordable by the community, 3. support equitable growth and stability,
4. encourage and support national development, 5. and strengthen relations among nations.
Yogyakarta and Surabaya are the two major cities in Indonesia. Both have huge potential trip generation and trip attraction. Dynamic activity people make economies of both cities to develop properly. Movement of people and goods requires the existence of facilities and infrastructure. However, not all people can travel using private vehicle. Public transportation that mainly serves inter-city inter-provincial movement are still necessary for people who do not have a private vehicle.
Determining the amount of public transport fares often creates a conflict of interest between
public transport operators and users. Usually the problem will arise if the community has
Ability To Pay (ATP) and Willingness To Pay (WTP) lower than the amount of public
transportation tariffs set by the Government. Especially for those who are captive users
including community groups who rely on public transportation and have no other choice
alternatives.
In formulating the public transport fares, the Government should pay attention to vehicle operating costs and also must consider purchasing power of users. Purchasing power capability is based on user perceptions of willingness (willingness to pay) and the ability to rationally the proportion of budget allocation for transportation (ability to pay).
Objectives to be achieved in this study were:
a. Determining the Ability To Pay (ATP) and the Willingness To Pay (WTP) users economics AC bus, route of Yogyakarta - Surabaya,
b.
Determining the ideal tariff that accommodate the interests of users and operators.
2
Restriction on Problems
a. Respondents were bus passengers of PO. Mira, which departs from Terminal Giwangan Yogyakarta to Surabaya.
b. Type of bus was economic class-bus with AC facility.
c. Existing tariff for full trip from Yogyakarta to Surabaya was Rp 38.000,00.
d. Tariff limits set by the Government were Rp 30.000,00 as the lower limits and Rp 48.000,00 as the upper tariff limits.
e. Pricing list for calculating vehicle operational costs based on price conditions in 2010.
3
Research Advantages
Benefits of the research will be addressed to:
a. Central Government through the Directorate General of Land Transportation within establish public transport fares should consider affordability of public purchasing power so it needs to be a guideline or standard (standard operation procedure) which applies uniform national and should be used as reference (guidelines) official.
b. Operators of public transportation in an effort to maintain the viability of his efforts.
4
Literature Study
4.1 TariffAccording Muchtarudin Siregar (1990), tariff public transport is a cost that must be paid by users public transport over the facilities in accordance with the price received released by the operator who provide public transport services.
4.2 Tariff Determination
According to Tamin (1999:134) when ATP and WTP parameters are reviewed, then the aspect of the user who serve as subjects in determining the value of tariffs imposed by the principle:
a. ATP is a function of ability to pay, so that the tariffs imposed must not exceed the ATP values of target groups. Government intervention in the form of subsidies, then it takes on a condition in which the tariff applies more of ATP in order to get the maximum tariff equal to the value of ATP.
b. WTP is a function of the level of public transport services, so that when the value of WTP is below the ATP, it is still possible to secure an increase in the tariff with improved public transport services.
Goverment will realize how many users will receive benefit and how many users cannot afford the transportation services, when the new tariff policy is determined.
Fig. 1 Illustration of flexibility of determining tariff based on ATP-WTP
4.3 Ability To Pay (ATP)
Ability to pay is a person's ability to pay for services received on its income. The approach used in the analysis of ATP is based on the allocation of the costs used to transport and travel intensity users.
4.4 Willingness To Pay
Willingness to pay is the willingness of users to issue a reward for services obtained or the average amount of rupiahs that people willing to spend as payment of one unit of transportation service public those enjoyed it.
5
Reseach Method
5.1 Data Collection Method
a. Data was collected through interviews based on questionnaires with a sample of bus passengers in Terminal Giwangan.
b. To solve the weaknesses in data collection, the questionnaire was designed in an attractive format, the questions posed clear and concise, the length of time interview about 15 minutes c. Questionnaires have been through the reliability test and validity before the actual data
collection.
e. Secondary data such as the BOK is obtained by asking directly to PO.Mira.
Fig.2 Research Flow Chart Start
WTP
tariff based on the initial perception
Service improvement priority
Final tariff (after service improvement)
Conclussion
Finish Literature Review
Literatur
Primary Data - Respondents characteristics - ATP
- WTP
Secondary Data
- number of buses which operate per day - Route and travel distance
- Vehicle operational cost components Preliminary Survey
ATP Revenue per month
Transportation cost per month Travel cost out of town per
month
Travel cost out of town per month, route Yogyakarta- Surabaya
BOK
Tariff BOK
Analysis and Discussion
Stage 1
Current Tariff Tariff ATP Tariff WTP
Stage 2
Stage 3 Formulation the problem and research objectives
5.2 Research Design
The questionnaire was designed to investigate the characteristics of the respondent / passenger
bus AC Yogyakarta, Surabaya economy by asking the frequency of the AC bus
Jakarta-Yogyakarta economic, gender, age, education, occupation, frequency of travel, and purpose of
the trip.
The factors used to determine the ATP can be seen in the table below (Table 1) :
Tab. 1 Variables of respondents ATP
ATPuser
Total Revenue per passenger per month Percentage of transportation cost per month
Percentage of reosentase biaya transportasi luar kota Percentage of transport cost (Yogyakarta- Surabaya ) Travel Frequency
The approach used in the analysis of WTP based on the perception of passengers on the bus fare.
Tab. 2 Variabel WTP Responden
WTPuser
Tariff passenger initial perception Priority of service quality improvements Tariff after service improvements
Passengers are given a question about how much tariffs in accordance with current conditions. Users are required to choose one option which is considered the highest priority improvement of service, such as the following:
Tab. 3 Alternative service improvement priorities
Option Variable of service quality
A Convenience in obtaining the service B Punctuality of service
C Responsibility
D Courtesy and hospitality in providing the service
E Variation service model
6
Analysis and Discussion
6.1 Description of Object Reseach
Yogyakarta-Surabaya route is served by several otobus companies which competing against each other. It is marked by the existence of innovations in service, for example, the presence of economic air-conditioned buses. Consumers are also getting benefit from this condition. They were getting pampered because of 24-hour trip serve with a gap of departure between 8-20 minutes. In one bus fleet has a capacity of 54 seats with a variety of economic services AC, fixed seating 2-3 and low-cost (Rp 38.000,00). The route followed, namely: Yogyakarta-Solo-Klaten Giwangan-Sragen-Ngawi-Madiun-Nganjuk-Jombang-Mojokerto-Surabaya with a total distance of 344 km.
6.2 Respondents Characteristic
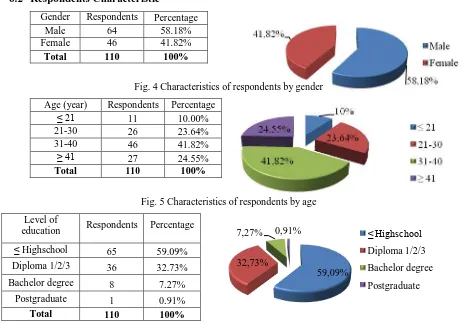
Gender Respondents Percentage
Male 64 58.18%
Female 46 41.82%
Total 110 100%
Fig. 4 Characteristics of respondents by gender
Age (year) Respondents Percentage
≤ 21 11 10.00%
21-30 26 23.64%
31-40 46 41.82%
≥ 41 27 24.55%
Total 110 100%
Fig. 5 Characteristics of respondents by age
Level of
education Respondents Percentage
≤ Highschool 65 59.09%
Diploma 1/2/3 36 32.73%
Bachelor degree 8 7.27%
Postgraduate 1 0.91%
Total 110 100%
Fig.6 Characteristics of respondents by level of education
Figure 4 presents the characteristic respondents by gender. It can be shown that about 58,18% respondent were male. Mayority of respondents were between 30 years to 40 years. Base on Figure 5 it is known that user whose age under 21 year only 10%, which is the minority group. The highest percentage of last education degree respondents (about 60%) were up to high school level. In contrast, respondents who have a final education postgraduate (master and doctoral degree) only 0.91%.
Trip Frequency Respondents Percentage
1-4 times per year 18 16.36%
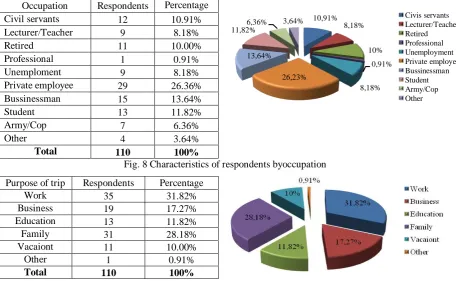
Occupation Respondents Percentage
Civil servants 12 10.91%
Lecturer/Teacher 9 8.18%
Retired 11 10.00%
Professional 1 0.91%
Unemploment 9 8.18%
Private employee 29 26.36%
Bussinessman 15 13.64%
Student 13 11.82%
Army/Cop 7 6.36%
Other 4 3.64%
Total 110 100%
Fig. 8 Characteristics of respondents byoccupation
Purpose of trip Respondents Percentage
Work 35 31.82%
Fig. 9 Characteristics of respondents by purpose of trip
From the 110 respondents known that the frequency of trips for the purpose of Yogyakarta, Surabaya who voted often (3-4 times per month) and quite often (1-2 times per month) have the same amount, which is 29 respondents or 26.36%. Meanwhile, the respondents who travel very frequently (5-6 times per month) amounted to only 3 respondents or 2.73%.
Based on job type (Figure 8), the bus passengers of economic-class with AC facilityy dominated by private employee are 26.36% or 29 respondents. While the respondents who have occupation as a student reach 11.82% or 13 respondents. Only 1 respondent who works as a professional (doctor or notaries).
Most users of public transport economics AC Yogyakarta to Surabaya have a purpose of official travel / work with the highest percentage is 31.82% or 35 respondents. Followed by the second largest amount with the intention of the family affair which is 28.18% or 31 respondents.
6.3 Analysis of Ability To Pay
Total revenue per
month (Rp) Respondents Percentage
≤ 999.000 31 28.18%
Fig. 10 Characteristics of respondents by revenue per month
The income of 64 male respondents (58.18%) and 46 female respondents (41.82%) can be seen in Figure 10. Level of income respondents per month varied greatly. Mayority of respondents have revenue per month among Rp 1.000.000,00- Rp 2.999.000,00. And no respondent had incomes more
than 5 million rupiahs. ATP of bus AC-economic Yogyakarta-Surabaya which has the highest frequency range between Rp 31.800,00- Rp 42.600,00 with the up to 24.55%.
6.4 Analysis of Willingness To Pay
Tab. 1 Priority of service quality improvements
Answer Variable of service quality Respondent Percentage
A Convenience in obtaining the service 12 10.91%
B Punctuality of service 33 30.00%
C Responsibility 39 35.45%
D Courtesy and hospitality in providing the
service 22 20.00%
E Variation service model 4 3.64%
Total 110 100%
Most respondents (35.45%) require the highest priority for improvement of service is responsibility. The responsibility mentioned is the responsibility of the driver. Users require driver drive well, safety and obey the traffic regulations.
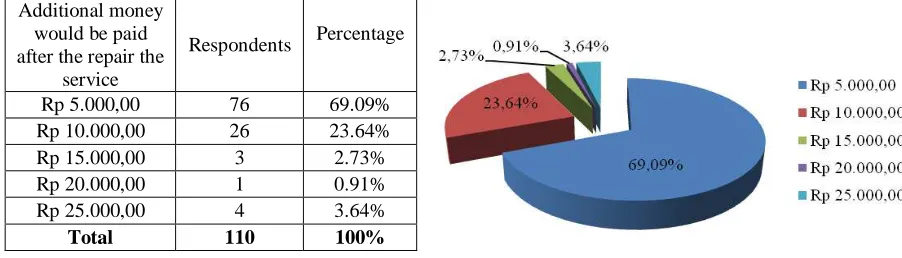
Additional money
Fig. 11 Additional money would be paid by user after service improvements
The largest percentage is respondents willing to pay a 69.09% increase in tariff amounted to Rp 5000.00, if the operator made improvements in accordance with the desired service and 24% respondents is Rp 10.000,00. From the calculation of recent perception tariff (WTP), the highest percentage (52.73%) of respondents have WTP between Rp 39.700 – Rp 44.600,00.
6.3 Tariff
Tab.2 Recapitulation of tariff base on BOK, Goverment and current condition
Current
Tariff/passenger Tariff base on BOK/passenger Tariff set by Goverment/passenger
Fig.12 Positioning tariff base on BOK, Goverment and current condition
Fig.13 Positioning ATP and WTP
The condition of ATP and WTP in existing service quality can be shown at Figure 13. It can be seen that ATP is greater than WTP. This occurs when users have a relatively high income but the utility of these services is relatively low, the user on the condition is called choice riders. This indicates that operator that the operator should be able to provide more services than current conditions.
The first alternative, ideal tariff can be set between Rp 35.600,00 – Rp 42.600,00. From the user side, they able and willing to pay the tariff. For the operators, the range is above the ideal tariff base on BOK with the LF = 59.5%. So, the current tariff is fulfill this condition. However, this region is a zone of discretion the determination of the tariff and service improvements
If the operator does not provide improvements service then the ideal rate between Rp 34200.00 – Rp 35.600,00. This is the ideal tariff zone flexibility without improving service to the limit level of WTP.
Fig.14 Positioning ATP and WTP after service quality improvents Rp 29.100,00
Rp 30.000,00 Rp 34.200,00 Rp 38.000,00
Tarrif Rp/pss/1 trip
Rp 48.000,00
Current Tariff
Tariff, LF = 70% Upper limit
Tariff, LF = 59,5%
Lower limit tariff
Rp 34.200,00 Rp 35.600,00 Rp 38.000,00
Tarrif Rp/pss/1 trip
Rp 42.600,00
Current Tariff
Tariff, LF = 59,5% ATP
WTP
Rp 42.600,00
Rp 34.200,00 Rp 38.000,00
Tarrif Rp/pss/1 trip
Rp 44.600,00
Current Tariff
Tariff, LF = 59,5% ATP
Figure 14 presents the position of ATP and WTP after the respondents demanded a repair service. It can be shown that WTP is higher than ATP. This condition is the opposite of the initial conditions. This may occur for users who have a relatively low income but the utility of transport services is very high, so that the user wishes to pay for these services are relatively more influenced by the utility. In this condition the user is called captive riders. This means that operators have to make improvements and user agree with the alternatives improvements. Users are also willing to provide reasonable prices with the service quality improvement.
However, ATP is still greater than the current tariff so that the user is still able to pay the existing tariffs. This could occur if the operator does not make service improvements also raised tariffs, because with the load factor = 59.5% tariff that can be offered by the operator was Rp 34.200,00.
Ideal tariff can be set up with the ATP value (Rp 42.600,00). The current tariff (Rp 38.000,00) can be set as ideal tariff, because it is higher than tariff base on BOK (LF=59,5%) and also lower than user ATP.
7
Conclussions
To conclude, the current tariff Rp 38.000,00 can be called as an ideal tariffs that accommodate the interests of users and operators both in initial conditions and conditions after the repair service.
8
References
D. Novirani. Kajian Tarif Shuttle service Terhadap Vihicle Operation Cost Operator,Ability To Pay(ATP) dan Willingness To Pay(WTP) Penumpang (Review of Shuttle Service Tariff Against the Operator’s Vehicle Operational Cost, Ability To Pay (ATP)and Willingness To Pay (WTP) Passenger). Thesis . Engineering Faculty ITB., Bandung, 2007.
E.K. Morlok. Pengantar Teknik dan Perencanaan Transportasi (Introduction to Transportation Engineering and Planning). Penerbit Erlangga., Jakarta 1991.
F.D. Hobbs. Perencanaan dan Teknik Lalu Lintas (Planning and Traffic Engineering). Translated by Suprapto and Waldiyono. UGM., Yogyakarta, 1995.
M. Siregar. Beberapa Masalah Ekonomi dan Management Perangkutan(Some Problems of Transportation Economics and Management, Faculty of Economics, University of Indonesia, Jakarta.,1990.
R.E.Walpole and R.H. Myers. Ilmu Peluang dan Statistik untuk Insinyur dan Ilmuwan (Science of Probability and Statistics for Engineers and Scientists). Translated by R.K.Sembiring. ITB Press., Bandung, 1986.
S. Hadi. Statistik (Statistics), Penerbit Andi Offset., Yogyakarta, 1989.
S. Warpani. Merencanakan Sistem Perangkutan (Transportasion System Planning). ITB Press., Bandung, 1990.