Brian C. Cadena is an assistant professor of economics at the University of Colorado–Boulder. A previous version of this paper circulated with the more unwieldy title “How Do Immigration Flows Respond to La-bor Market Competition from Similarly- Skilled Natives?” The author is grateful to Soren Anderson, Becky Blank, George Borjas, John Bound, Charlie Brown, Sheldon Danziger, John DiNardo, Mike Elsby, Ben Keys, Brian Kovak, Alex Resch, Jim Sallee, Jeff Smith, Gary Solon, and two anonymous referees for helpful comments and suggestions. Additionally, he received useful suggestions from seminar participants at the College of William and Mary and the University of Colorado–Boulder, and from conference participants at the 2009 American Economic Association meetings. Ethan Lewis graciously provided STATA code to create consistent geographic boundaries across the three census samples. Much of this project was completed while the author was receiving fi nancial support from the National Science Foundation through a Graduate Research Fellowship. Remaining errors are the author’s own. The data used in this article can be obtained beginning June 2014 through May 2017 from Brian Cadena, Department of Economics, University of Colorado—Boulder, 256 UCB, Boulder, CO 80309 or email: [email protected]. [Submitted September 2011; accepted November 2012]
ISSN 0022- 166X E- ISSN 1548- 8004 © 2013 by the Board of Regents of the University of Wisconsin System
T H E J O U R N A L O F H U M A N R E S O U R C E S • 48 • 4
Immigrant In
fl
ows
Brian C. Cadena
A B S T R A C T
This paper demonstrates that immigration decisions depend on local labor market conditions by documenting the change in low- skilled immigrant infl ows in response to supply increases among the US- born. Using pre- reform welfare participation rates as an instrument for changes in native labor supply, I fi nd that immigrants competing with native entrants systematically prefer cities with smaller supply shocks. The extent of the response is substantial: for each native woman working due to reform, 0.5 fewer female immigrants enter the local labor force. These results provide direct evidence that international migration fl ows tend to equilibrate returns across US local labor markets.
I. Introduction
Nearly 20 percent of working- age adults living in the United States with no more than a high school education were born elsewhere.1 These low- skilled immigrants come to the United States for a variety of reasons, but many choose to
leave their home country in search of better labor market opportunities.2 This paper investigates how geographic differences in expected earnings within the United States infl uence newly arriving low- skilled immigrants’ location decisions. To do so, I de-velop a novel estimation strategy that leverages geographically disparate increases in native labor supply resulting from policy changes to the federal welfare system. Pre-vious empirical treatments of this question have examined whether immigration fl ows are drawn disproportionately to areas with higher wage rates for their skill type.3 There are, however, two primary challenges to interpreting results based on this approach, and they have proven diffi cult to overcome. First, measured geographic differences in wage rates among natives or previous migrants are unlikely to capture exogenous dif-ferences in the wages immigrants can expect. Instead, they may proxy for unobserved quality among existing workers, or they may refl ect unobserved local public goods and other locational amenities (Roback 1982).4 Second, immigrants are new labor market entrants who value both the probability of fi nding employment and the expected wage conditional on securing a job. Focusing exclusively on wages ignores other measures of differential labor market prospects, which are also likely to enter into a new im-migrant’s decision.
In this paper, I overcome both of these diffi culties by exploiting differently sized labor market shocks that lead to within- city changes in labor market prospects, regard-less of the relative importance of employment probabilities or wages. As a result of a series of policy changes to the former Aid to Families with Dependent Children (AFDC) program, the labor market participation rate among low- skilled native women in the target population increased by nearly fi fteen percentage points. The women entering the labor market due to welfare reform tend to work in the same types of jobs as do newly arriving low- skilled immigrants. Thus, the increase in labor supply among natives can be viewed as an outward shift of the supply curve of a close substitute for immigrant labor.
To determine what infl uence these supply shocks have on immigrants’ location choices, I use MSA- level welfare participation rates in 1990 as an instrument for changes in labor market participation among native workers from 1990 to 2000. Al-though many of the policy changes were implemented at the federal level, local in-creases in labor market attachment were strongly related to the share of the population affected by reform. I fi nd that the geographic distribution of immigrants arriving in the 1990s was dramatically different than in the previous decade, with a systematic shift away from cities with more welfare leavers and toward cities with fewer leavers. In order to interpret this result as the causal effect of native labor supply increases on immigrant infl ows, two conditions must be satisfi ed: The share of a city’s popula-tion affected by reform must be uncorrelated with other unobserved changes in the value of locating there, and changes to the welfare system must not affect immigrants’
2. Economists have long considered migration as an investment driven by differences in expected earnings (Sjaastad 1962). Borjas (1987) fi rst developed the hypothesis that US labor markets should be especially attractive to immigrants at the low end of the skill distribution from countries with larger returns to skill. Although empirical evidence suggests that immigrants are more likely to be drawn from the middle of the skill distribution in their home country, they nevertheless tend to fall in the bottom portion of the U.S. skill distribution (Chiquiar and Hanson 2005).
preferences over destinations through any mechanism other than the resulting increase in labor supply among natives. I present multiple pieces of empirical evidence sug-gesting that each of these conditions holds.
My empirical strategy uses long differences in an MSA’s share of the immigrant population, which eliminates the infl uence of fi xed amenities like local public goods. Thus, an alternative interpretation of the results must explain changes in the locations immigrants select. I consider and rule out several possibilities. First, the changes in immigrant share observed from 1990 to 2000 are not the continuation of pre- existing trends. Second, I control directly for additional factors that are likely to affect where immigrants choose to locate, including controls to address coincident demand shifts and a secular decline in the value of enclaves. Third, I control indirectly for multiple unobserved changes in a city’s value by including the change in a city’s share of higher- skilled immigrants as an additional covariate. In sensitivity analysis, I further allow for the possibility that cities offer amenities specifi c to immigrants from differ-ent source regions. Across all of these specifi cations, I continue to fi nd strong evidence that immigrants avoided locating in cities with relatively larger increases in native labor supply.
Finally, I consider the possibility that welfare reform affected immigrants’ choices directly, rather than through increased labor market competition. If immigrants were initially attracted to cities offering higher benefi ts, then reform could have “turned off” these welfare magnets, which provides a potential alternative interpretation of the re-sults. I address this concern directly by allowing for differential infl ow trends based on pre- reform benefi t levels, changes in immigrant welfare receipt, or state- level policy choices that affected immigrants’ eligibility. Consistent with Kaushal (2005), I fi nd no evidence that immigrant infl ows respond to changes in benefi ts, and controlling for this possibility does not qualitatively alter the main results.
After examining each of these alternatives, I present back of the envelope calcula-tions to determine the extent to which differential immigrant infl ows offset the number of new native workers due to welfare reform. The results suggest that immigration infl ows substantially equalized the reform- induced supply shifts across geography. For each additional native woman working in a labor market due to welfare reform, 0.5 fewer female immigrants choose to enter the local labor force.
The fi nding that local low- skilled immigration infl ows are quite sensitive to labor market conditions has important implications across several strands of the literature. This paper contributes most directly to the literature concerned with the extent to which migration fl ows mitigate geographic labor market inequality as selective loca-tion decisions among internaloca-tional migrants will tend to smooth out local shocks.5 This dynamic becomes particularly important given that minority workers and the less- educated have signifi cantly lower mobility rates, and are thus disproportionately affected by local demand shocks (Bound and Holzer 2000). As suggested by the framework presented by Borjas (2001), therefore, the ability of earnings- sensitive
migrants to diffuse local shocks throughout the country provides an often overlooked benefi t of consistently large infl ows of low- skilled immigrants.
Additionally, a large literature has relied on geographic variation in the settlement pattern of immigrants to determine the effect of immigration on native labor market outcomes.6 On the whole, these studies reveal very similar changes in wage and em-ployment outcomes for native workers, regardless of the extent to which immigration altered the skill mix of a local market (Smith and Edmonston 1997). These results contrast with studies that treat the labor market as nationally integrated, which fi nd much more substantial wage effects (Borjas, Freeman and Katz 1997; Borjas 2003). Although several mechanisms have been proposed to explain these different results, none has found empirical support.7 The strong response of immigrant infl ows to ex-ogenous changes in expected earnings that I identify in this paper suggests that this mechanism may help explain this discrepancy.8
Finally, many studies use cross- geography comparisons to evaluate the effect of labor market policies. The results of this paper imply that these types of research designs will tend to underestimate the effect of any policy susceptible to arbitrage by highly mobile low- skilled immigrants.
The remainder of the paper is organized as follows: the next section provides a con-ceptual framework for evaluating the role of labor market conditions in immigrants’ location decisions and presents descriptive evidence detailing welfare reform’s dis-parate geographic effect on native labor supply; Section III presents a discrete choice model and motivates the appropriate empirical methodology for estimation; Section IV provides the main empirical results and additional robustness checks; the fi nal sec-tion further discusses the implicasec-tions of these fi ndings for previous research and for future policy decisions.
II. Welfare Reform and Native Labor Supply
Over the 1990s, several policy changes were implemented, each of which was designed to increase labor market participation among native women previ-ously eligible for cash welfare benefi ts. I begin by discussing these changes and how their combined effect created incentives for many low- skilled native women to enter or remain in the workforce. I then provide empirical evidence that these reforms suc-ceeded in substantially increasing the labor market attachment of the target population and that local welfare participation rates prior to reform reliably predict local increases in native female employment over the reform period.
The federal cash welfare system, fi rst implemented in 1935, was originally
de-6. Card’s (1990) infl uential paper found virtually no effect of the Mariel Boatlift on Miami’s labor market. Additional examples of this general methodology include Altonji and Card (1991), Lalonde and Topel (1991), and Schoeni (1997).
7. The literature has examined possibilities including immigrant infl ows leading to native outfl ows (Card and DiNardo 2000; Card 2001) and local economies adjusting to their changing endowments by altering the mix of products they produce (Lewis 2003).
signed to provide for the material needs of widows with dependent children. By the late 1970s, the demographic makeup of the welfare rolls had changed dramatically: Widows were covered by social security and rising rates of divorce and non- marital childbearing meant that most recipients were in families headed by divorced and never- married mothers. As greater numbers of married women worked, there was po-litical pressure to increase employment among mothers on welfare. In the early 1990s, states were given expanded authority to secure federal waivers from AFDC program rules and in 1996 the Personal Responsibility and Work Opportunity Reconciliation Act (PRWORA) ended the AFDC program.
After reform, cash assistance was no longer a federal entitlement program; seeking or participating in employment became a pre- condition for benefi t receipt. Welfare offi ces implemented work support and “work fi rst” programs to move women into the workforce. Welfare recipients are now subject to a 60- month lifetime limit (fewer at state discretion), giving potential recipients an incentive to delay benefi t receipt and to search more intensely for employment opportunities before applying.9 Most states also reduced the rate at which benefi ts are taxed away as a recipient earns income (forthcoming), and concurrent expansions in the federal Earned Income Tax Credit provided additional fi nancial incentives to work. Each of these policies was designed to increase employment and to raise the return to work among women who, in the absence of reform, might have relied mainly on public assistance (Ellwood 2000). These reforms therefore created the textbook defi nition of a labor supply shift – policy changes resulting in more low- skilled women willing to work at any given wage.
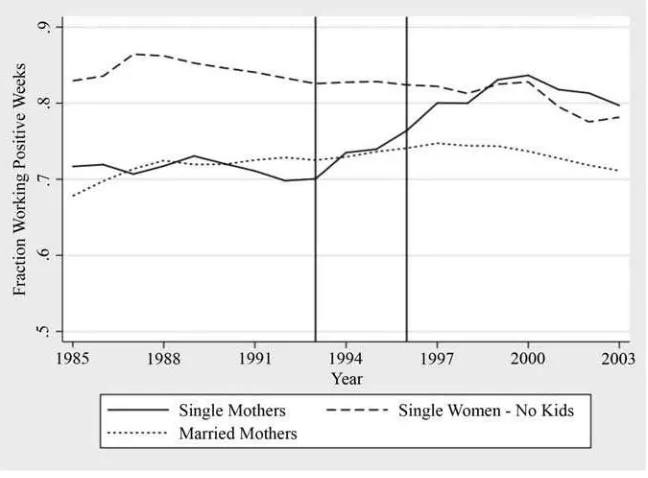
The empirical literature evaluating welfare reform supports the conclusion that these policy changes increased employment among the target population. While any credible study of the effect of these changes includes essential controls for the role of the strong macroeconomy over the period in which reform was implemented, most studies (and especially evaluations of demonstration projects using random assignment) fi nd that the policy changes had a signifi cant effect on the labor force attachment of low- skilled women.10 Figure 1 uses data from the annual March Supplement to the Current Popula-tion Survey (CPS) and shows trends in labor market attachment (working positive weeks during the previous year) for women with at most a high school degree between the ages of 18 and 54 living in large Metropolitan Statistical Areas (MSAs).11 They are classi
fi ed according to marital status and parenthood. Labor market participation among single mothers increased dramatically from 70 percent in 1993 to 84 percent in 2000. There was no similar increase among women in either of two comparison groups – married mothers or single women without children. Additionally, the trends become quite similar after 2000, suggesting that the reforms created a roughly permanent increase in supply.
Even though many of the policy changes were implemented at the national level, local labor markets where welfare recipients represented a greater fraction of potential low- skilled workers experienced larger increases in low- skilled labor supply. As evidence of
9. Grogger, Haider and Klerman (2003) fi nd that as much as half of the decline in caseloads resulted from a decrease in the entry rate.
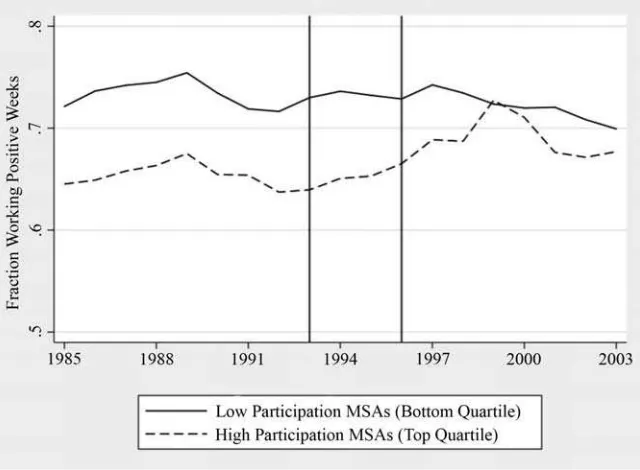
this relationship, consider Figure 2, constructed with the same employment measure as in Figure 1. I fi rst rank each MSA based on the fraction of all low- skilled women receiv-ing cash welfare from 1988 to 1992, and I then calculate annual employment averages for women living in MSAs in the top and bottom quartiles.12 Although the levels are dif-ferent, the time pattern of employment in both quartiles is quite similar prior to the mid- 1990s. After that point, however, employment increased signifi cantly for women in high participation cities. Employment among women in low participation cities, in contrast, remained roughly fl at. By the end of the decade, the employment gap (on average eight to nine percentage points prior to reform) had essentially disappeared. Thus, the level of welfare participation prior to reform reliably predicts increases in native labor supply over the reform period, with overall dynamics consistent with the timing of reform.
How then, should these differential supply shifts affect the expected labor market returns of newly arriving immigrants? In the short run, requiring women to work or search for work will increase the competition for each vacancy, making it less likely
12. This fi gure takes the average over all women living in any city within a quartile. Each quartile contains 33 MSAs and captures a roughly equal fraction of the sample population. A similar, though somewhat noisier pattern emerges when each MSA average contributes one observation to the quartile mean.
Figure 1
Female Employment Rates 1979–2003, Age 18–54, HS Degree or Less.
that any new entrant will fi nd employment in a given period. Eventually, the market will reach a new medium- run equilibrium with more employed low- skilled workers working at lower wages.13 Welfare reform, therefore, provides exactly the type of shock that substantially alters the labor market returns of newly arriving immigrants.
Of course, immigrants are only likely to respond to these supply increases if welfare leavers represent a meaningful increase in competition for jobs that immigrants are likely to search for. Several descriptive facts suggest that this is the case. First, the population affected by welfare reform and the fl ow of new immigrants are of similar magnitudes. Welfare rolls fell by 2.3 million adults (from 3.8 to 1.5 million) between 1990 and 2000 (US Department of Health and Human Services 2007).14 Over that
13. If immigration fl ows fail to offset the differential impact of welfare reform, one might expect that, in the long run, owners of capital will bring the market back into geographic equilibrium by directing investment toward areas with a higher return. If, on the other hand, newly arriving immigrants are suffi ciently sensitive to near- term differences in expected earnings, they may manage to smooth out these disparate labor market shocks even without any change in behavior among native workers or capital owners.
14. Note that these fi gures may understate the number of women affected by reform as the caseload reached a peak of 4.4 million adults in 1994.
Figure 2
same time period 4.4 million low- skilled immigrants (male and female) entered the country (US Bureau of the Census 2007).
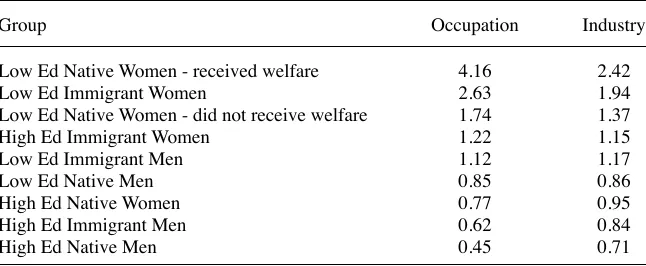
In addition, newly arriving immigrants and welfare leavers tend to work in similar jobs. Altonji and Card (1991) provide a means of calculating the degree to which an infl ux of one type of worker creates an increase in competition for various other groups of workers. Specifi cally, the measure calculates the effective increase in supply experienced by each type of worker due to entry by a single type that results in a one percent increase in the overall labor force.15 Table 1 presents this measure comparing single native women who are currently working but received welfare in the past year to eight other groups of workers based on gender, education and nativity.16 These results suggest that women entering the labor force in response to welfare reform are especially close substitutes for newly arriving female immigrants. The index for occupation is 2.63 while the index for industry is 1.94, and I therefore focus the ma-jority of the location choice analysis on this group. Low- skilled immigrant men do overlap substantially with welfare leavers (occupation and industry values of 1.22 and 1.15 respectively), however, and I present results examining their location choices for completeness.
On the whole, the descriptive evidence presented in this section suggests that wel-fare leavers represent a substantial exogenous increase in labor market competition
15. The exact formula is Σj(SgjSLj/Sj) where Sgjis the share of workers in group g in industry or occupation
j, SLjis the share of welfare leavers in j, and Sjis the share of all workers in j.
16. These data come primarily from the 2000 census, although I calculate the shares for welfare leavers us-ing both the 1990 and 2000 censuses to account for the fact that reform may have affected the types of jobs observed among those with benefi t receipt. I classify both occupations and industries at the most disaggregate level available.
Table 1
Relative Supply Increases Due to Entry by Welfare leavers
Group Occupation Industry
Low Ed Native Women - received welfare 4.16 2.42
Low Ed Immigrant Women 2.63 1.94
Low Ed Native Women - did not receive welfare 1.74 1.37
High Ed Immigrant Women 1.22 1.15
Low Ed Immigrant Men 1.12 1.17
Low Ed Native Men 0.85 0.86
High Ed Native Women 0.77 0.95
High Ed Immigrant Men 0.62 0.84
High Ed Native Men 0.45 0.71
for newly arriving low- skilled immigrants. Further, geographic variation in pre- reform welfare participation induced substantial differences in the degree to which local labor markets were affected. These facts lead to a clear prediction: if newly arriving im-migrants are suffi ciently sensitive to geographic variation in the expected earnings a labor market offers, they will tend to select locations with fewer women entering the labor market as a result of welfare reform. The next section provides an empirical framework for evaluating this hypothesis.
III. Expected Earnings and Location Choice
Suppose that each metropolitan area in the United States offers an im-migrant a level of utility from settling there: Uisdt. In this notation, i indexes individuals,
s indexes the source region, d denotes destinations (MSAs) and t indexes time periods (census decades).17 The immigrant’s decision rule can be expressed in a straightfor-ward way: she chooses to move to location j if and only if Uisjt > Uisdt᭙d≠ j.
The central question is the extent to which relative labor market prospects affect the relative utility that each location offers, and thus the likelihood that an immigrant selects a particular location. To begin, I defi ne the total labor market returns as the present discounted value of the stream of expected future earnings that a location offers. For concreteness, suppose that each worker inelastically supplies one unit of labor when employed. Then the expected earnings k periods after migrating depend on the probability of being employed (pk)and the expected wage conditional on
be-ing employed: E[wk| pk =1]. The total value of the stream of future income an
im-migrant with discount factor <1 expects to earn if she moves to location d in year t
is thus:
Notice that a location’s wage rate is only one component of the total labor market returns it offers (Topel 1986). Several authors have used the wages of similarly- skilled workers as a measure of immigrants’ expected earnings; yet very little attention has been paid to the probability of fi nding and maintaining employment (Bartel 1989; Borjas 2001; Kaushal 2005; Jaeger 2007). This frequent simplifi cation is likely driven by data availability. In the absence of reliable data on the probability of fi nding em-ployment or the length of initial unemem-ployment spells, replacing expected earnings with prevailing wage rates may provide a reasonable approximation.
Yet there are two key reasons why focusing exclusively on wages is likely to mismeasure the actual returns as perceived by new immigrants. First, immigrants are, by defi nition, new entrants into a labor market. Although some may move to a city
17. Because the data I will use do not provide information on potential immigrants who choose not to migrate, I model only the decision of where to locate conditional on deciding to move to the US. This simplifi cation implicitly assumes that the relative utility of cities within the US is independent of the value of remaining at home.
having already secured employment, most will begin their search upon arrival. Ad-ditionally, many immigrants (especially those who are unauthorized) enter the country with a relatively short expected time horizon (low T).19
Despite these concerns, the correlation between wage rates and expected labor market returns is likely still positive. The above discussion suggests, however, that variation in labor market tightness may reduce the strength of this relationship, espe-cially if wages and employment probabilities are negatively correlated. Using native supply increases rather than changes in measured wages ensures a clear prediction of how the location decisions of expected earnings- maximizing immigrants should respond.
One remaining concern is whether immigrants are able to gather suffi cient infor-mation about labor market prospects in order to make an optimal location decision. McLaren (2006) provides time- series evidence that border apprehensions are a re-liable leading indicator of US economic growth, which suggests that unauthorized immigrants have access to information about the labor market and do not undertake the risky venture of crossing the border unless they are reasonably confi dent that they will fi nd work. Selection across geography requires only a minor extension to this fi nding where potential immigrants have network contacts in more than one city, each providing this type of information. Should that fail, there is also room for trial and error. Once immigrants have paid the fi xed costs of moving to the US, they face sub-stantially smaller marginal costs of acquiring more information on where it is easier to fi nd work in addition to lower costs of actually moving again. Of course, many low- skilled legal immigrants enter on family re- unifi cation visas, and most of these likely never consider a location other than where their family members live. Yet immigration fl ows can still help equilibrate local labor markets as long as there is a suffi ciently large group of suffi ciently mobile immigrants. In fact, one might expect unauthorized migrants to be especially earnings- sensitive given their willingness to risk apprehen-sion in order to gain access to US labor markets, and I address this hypothesis in the empirical analysis.
A. Empirical Specifi cation
In this subsection, I provide additional structure and derive an appropriate empirical specifi cation to evaluate the infl uence of labor market returns on location decisions. Suppose that the overall utility a city provides can be expressed as a linear func-tion of its expected labor market returns, other observable characteristics Xsdt, and an individual- specifi c unobserved error term. Then the total utility of a location is given by
(2) Uisdt= γPDVdt+ Xsdtβ+uisdt.
McFadden (1974) demonstrates that if each uisdtis independently and identically distributed Type I extreme value, and can be estimated through conditional logit models using individual- level data. This approach is commonly adopted by other
thors in studies of the location choices of new immigrants (Bartel 1989; Kaushal 2005; Jaeger 2007). Yet the required assumption almost surely fails. In particular, there are most likely unobserved city attributes that have similar value to all immigrants from the same source region (uisdt= ηsdt+ isdt). These common error components pres-ent two challenges to estimation. First, assuming i.i.d. errors in the presence of these grouped unobserved components will vastly understate the standard errors and lead to incorrect inference. More importantly, these unobserved factors are likely correlated with expected earnings.
My empirical approach improves upon previous studies by explicitly modeling these unobserved components of the error term and taking steps to remove their infl u-ence. I employ an estimation strategy new to the immigration literature based on a method previously developed to examine workers’ choices among health insurance options (Scanlon et al. 2002), and my exposition of the econometric model closely follows the original. I begin by deriving an expression relating the observed share of immigrants selecting a particular city to the observed and unobserved components of utility in any given time period. This approach acts as a non- linear analogue to the “group- level regression” solution to the Moulton problem of common error compo-nents (Moulton 1990).
Allowing for common unobserved city attributes yields a new representation of the utility offered by a city:
(3) Uisdt= γPDVdt+ Xsdtβ+ηsdt+εisdt.
Note that this general framework nests the possibility that ηsdt.= ηdt ᭙s, or that the unobserved city attributes have similar value to immigrants from all source regions. I estimate models under both assumptions, but I use the most general form for exposi-tion. Rather than assuming that the u terms are i.i.d., I make the much less restrictive assumption that the εisdt terms are distributed i.i.d. Type I extreme value. In other words, conditional on the observed attributes and any common unobserved amenities, the remaining individual- level errors are well- behaved. Given this assumption, the probability that an immigrant selects a given destination in time period t is
(4) πsdt= e
This expression closely parallels the probability arising in a conditional logit model with the addition of the unobserved group effects in both the numerator and denomina-tor. In expectation, the share of newly arriving immigrants who select each destination will be equal to these choice probabilities. In practice, the observed shares will differ from the actual choice probabilities due to random sampling error. Let Ssdtrepresent the observed share of immigrants from source s selecting location d in year t. Then
(5) Ssdt= e
γPDVdt+Xsdtβ+ηsdt
Dst + υsdt .
(6) ln(Ssdt)=ln(eγPDVdt+Xsdtβ+ηsdt+D
An appropriately transformed version of the share of immigrants selecting a city will thus be approximately linear in the observed and unobserved attributes, and a regression with s х d cells as observations will have much better inference properties than will an individual- level conditional logit.
A cross- sectional version of this model, however, is unlikely to identify a causal relationship because any reasonable proxy for expected earnings is likely correlated with the error term. High wage areas likely offer better amenities, and one cannot use measures of competition for jobs, such as native participation rates, as these are endogenous to immigrant infl ows. Time differencing provides a partial solution by removing the infl uence of any amenities that are fi xed over time. The grouped error components can be partitioned into factors fi xed over time φsd and factors specifi c to each time period ψsdt so that ηsdt = φsd + ψsdt .
The differenced specifi cation is therefore:
(8) Δln(S
sd)≅ γΔPDVd+ (ΔXsd)β − Δln(Ds)+Δψsd+ Δ
υsd πsd.
I estimate a version of Equation (8) by instrumental variables, using changes in native female labor force participation as a proxy for changes in total expected labor market returns and the welfare participation rate prior to reform as the excluded instru-ment. I use labor market participation (working positive weeks over the prior year) because it most closely captures the degree to which natives began competing for low- skilled jobs in a local market. I avoid using alternatives such as wages or instantaneous employment rates, as these are equilibrium outcomes that depend on both the number of natives and the number of new immigrants who enter the labor market. I begin with specifi cations using shares measured across all immigrants, and, in sensitivity anal-ysis, I include source- specifi c intercepts to account for the ∆ln(Ds) terms.
Using this empirical strategy, I cannot estimate the effect of attributes of a destina-tion or source- destinadestina-tion pair that are fi xed over time, including factors commonly considered such as distance and climate similarities. Additionally, parameter estimates for attributes with little variation over time are not well- identifi ed. Many other covari-ates used routinely in the literature fall into this latter category, including the location of previously arriving immigrants and the geographic distribution of potential network contacts. The inability to include these variables should not be considered a limitation of the model. Instead, this approach removes the infl uence of any observed or unobserved aspect of a destination or source- destination pair that is roughly constant across time.
variable and the one suggested by the discrete choice model roughly represent pro-portional differences in a location’s immigrant share. Thus, even if the assumptions underlying this precise discrete choice model are violated, this specifi cation has an intuitive reduced form interpretation and continues to improve on previous work that used wage levels to proxy for expected earnings.
IV. Data and Results
IV. A Data
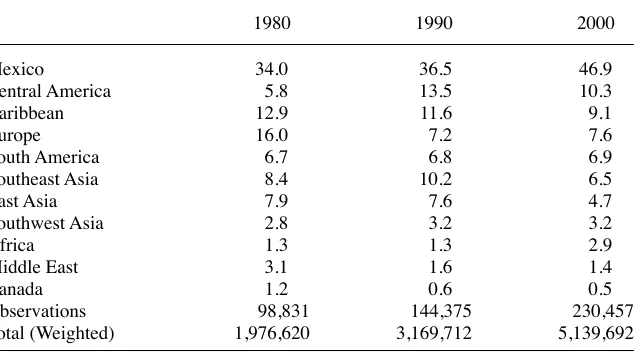
The fi ve percent Public Use Microdata Samples of the 1980–2000 decennial censuses provide the majority of the data for the analysis.20 I consider the location of newly arriving adult immigrants ages 18–54, with at most a high school degree, not living in group quarters. I classify a respondent as an immigrant if he / she is foreign- born and is either a non- citizen or a naturalized citizen. New immigrants are those who arrived in the US during the ten years prior to survey.21 I restrict the analysis to immigrants from the eleven source regions listed in Table 2.22 This table shows the distribution of sources across all three waves of the census. This distribution has remained some-what stable over the sample period with two exceptions: immigration from Mexico increased, while immigration from European countries decreased.23
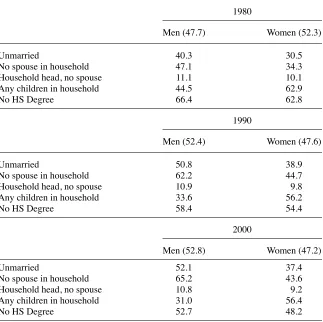
Table 3 provides some basic descriptive statistics for this population. In each census year, the total number of new immigrants is split almost evenly between women and men. Most new immigrants are married and very few live alone as household heads. These values are quite similar across the different waves of the census, suggesting that changes in the locations these immigrants choose are unlikely due to household composition changes.
I consider all MSAs within the continental US with a nonzero immigrant population in all three census years and an adult population (18–54) of at least 150,000 in 1990 as potential locations for newly arriving immigrants. These selection criteria result in 157 destinations in each year.24 For the basic results, I treat the η
sdt terms as constant across all source regions. The dependent variable in these specifi cations is the natural logarithm of the share of all new immigrants living in each city, calculated separately for each census decade. I use person- level weights to calculate these shares, which I calculate separately by gender.
The primary explanatory variable of interest is the change in low- skilled native fe-male labor market participation, which I quantify using the fraction of women working
20. I obtained the data from the IPUMS project (Ruggles et al. 2010), and I use the IPUMS coding of edu-cational attainment that is designed to be consistent across census surveys.
21. These immigrants may have previously lived in the United States, but the census question asks when the respondent arrived in the US “to stay”.
22. This restriction eliminates less than three percent of the sample of new immigrants.
positive weeks over the past year.25 The excluded instrument in the IV speci
fi cations is the welfare participation rate in 1990: the fraction of women who received positive welfare benefi ts during the year prior to the survey. I also construct variables to measure a number of additional attributes (listed in Table 4) that immigrants may consider when deciding where to locate. I include information from external data sources, as well as other variables calculated directly from the PUMS. I discuss the data sources for co-variates from non- census sources as they are introduced to the location choice models.
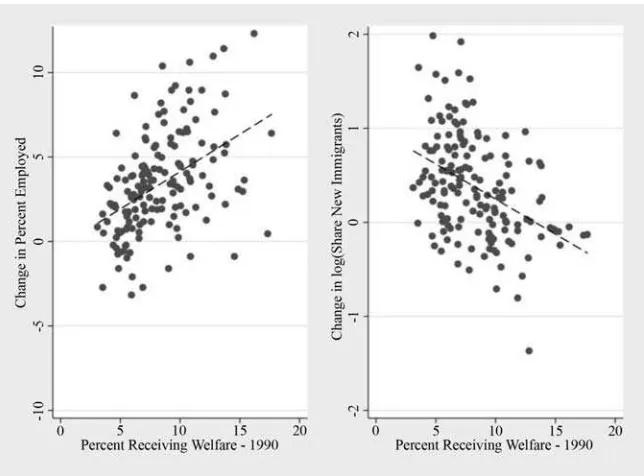
IV. B Immigrants Avoid Larger Supply Increases
Figure 3 displays the fi rst- stage and reduced form results of an instrumental variables version of Equation 8. Each city contributes one equally weighted observation. The left panel plots the data used to fi t the fi rst stage regression, along with the fi tted values. As hypothesized, cities with higher welfare participation prior to reform ex-perienced greater increases in native female labor market attachment over the decade. Each percentage point increase in program participation prior to reform led to a 0.44 percentage point increase in employment. The second panel shows the reduced form, and provides the central fi nding: Female immigrants arriving during the 1990s were
25. I select this defi nition to remove the infl uence of temporary variations in local labor market conditions and to capture the long- run change in the share of the population attached to the labor market. I obtain quali-tatively similar results using changes in the current labor force participation rate.
Table 2
Distribution of Source Regions in Percentages – New Immigrants Ages 18–54, High School Degree or Less
1980 1990 2000
Mexico 34.0 36.5 46.9
Central America 5.8 13.5 10.3
Caribbean 12.9 11.6 9.1
Europe 16.0 7.2 7.6
South America 6.7 6.8 6.9
Southeast Asia 8.4 10.2 6.5
East Asia 7.9 7.6 4.7
Southwest Asia 2.8 3.2 3.2
Africa 1.3 1.3 2.9
Middle East 3.1 1.6 1.4
Canada 1.2 0.6 0.5
Observations 98,831 144,375 230,457
Total (Weighted) 1,976,620 3,169,712 5,139,692
Table 3
Descriptive Statistics of Immigrants Arriving Over the Previous Decade, Ages 18–54, High School Degree or Less
1980
Men (47.7) Women (52.3)
Unmarried 40.3 30.5
No spouse in household 47.1 34.3
Household head, no spouse 11.1 10.1
Any children in household 44.5 62.9
No HS Degree 66.4 62.8
1990
Men (52.4) Women (47.6)
Unmarried 50.8 38.9
No spouse in household 62.2 44.7
Household head, no spouse 10.9 9.8
Any children in household 33.6 56.2
No HS Degree 58.4 54.4
2000
Men (52.8) Women (47.2)
Unmarried 52.1 37.4
No spouse in household 65.2 43.6
Household head, no spouse 10.8 9.2
Any children in household 31.0 56.4
No HS Degree 52.7 48.2
Notes: Author’s Calculations from the 1980–2000 PUMS. Sample selection criteria are the same as for Table 2. The numbers in parentheses give the percent of all immigrants who were of each gender for each census year. Person- level census weights used. All numbers are presented in percentages.
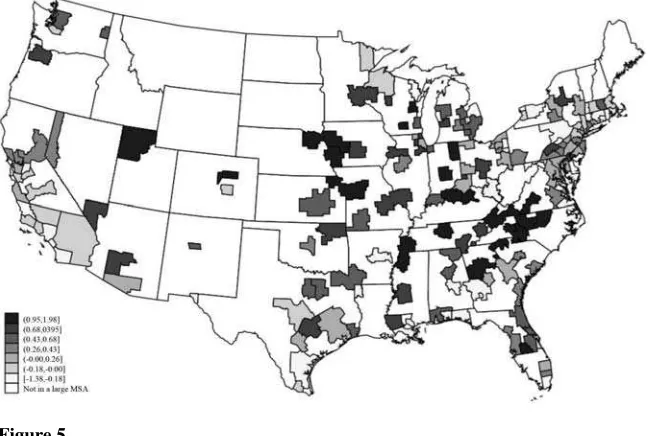
less likely to select cities with larger native populations entering the workforce as a result of welfare reform, as measured relative to the choices of immigrants arriving over the 1980s. Figures 4 and 5 show this relationship geographically. These maps demonstrate that the relationship is not driven by any particular region; instead, the pattern holds broadly across the entire country.26 In each fi gure, darker areas represent
Cadena
925
1980 1990 2000
Mean SD Mean SD Mean SD
Native female employment rate, HS degree or less 66.72 5.77 72.36 5.98 75.74 5.22
Percent receiving welfare - low education women 6.67 2.44 8.29 3.05 4.89 2.02
Average annual employment growth rate - over past decade — — 2.62 1.62 2.08 1.21
Immigrant share of MSA population, previous census — — 6.05 6.27 8.07 8.99
Average increase in Log(current minimum wage) relative to decade start — — –0.21 0.013 0.079 0.077
Maximum cash benefi t, family of three (hundreds of dollars) — — 3.90 1.64 — —
Change in percent of immigrants receiving welfare (from previous decade) –1.11 3.19
MSA in state that restored Food Stamp benefi ts — — — — 0.58 0.48
MSA in state that restored TANF benefi ts — — — — 0.36 0.47
MSA in state that restored Medicaid benefi ts — — — — 0.32 0.46
MSA in state that restored SSI benefi ts — — — — 0.15 0.36
MSAs with values above than the median, and lighter areas represent areas with values below the median. Areas of the country not included in large MSAs are represented as white. The negative relationship is apparent when looking from map to map as cities turn from light to dark and vice versa.
The parameter estimates from this specifi cation are given in the second column of Table 5. As expected given the fi gures, the fi rst stage is strongly signifi cant (the F- statistic on the excluded instrument is well in excess of 10), and the resulting IV estimate is signifi cantly negative. To contrast the IV results, the fi rst column of the table shows the results from estimating this same equation without an instrument. This coeffi cient is substantially more positive, consistent with an omitted variable such as local demand shocks increasing native employment and attracting newly arriving immigrants.
Interpreting the sign and statistical signifi cance of these coeffi cients is straight-forward. The magnitude can be interpreted as roughly the percentage change in the
and / or excluding California and the results are qualitatively unchanged. All results discussed in notes and not presented in tables are available from the author upon request.
Figure 3
Changes in Native Female Employment and New Immigrant Locations 1990–2000 By 1990 Welfare Participation
Figure 4
Percent of Low- Skilled Female Population Using Welfare 1990
Notes: Geographic boundaries are consistent MSAs constructed from PUMAs. Details available in the text.
Figure 5
Change in Log(Low- Skilled Female Immigrant Share) 1990–2000
The Journal of Human Resources
Table 5
Change in Log(Share of Female Immigrants Selecting a City )
OLS (1)
IV (2)
IV (3)
IV (4)
IV (5)
IV (6)
IV (7)
Change in native female –0.0286* –0.169*** –0.189*** –0.131*** – 0.132*** –0.104*** –0.117***
employment rate (0.0158) (0.0428) (0.0432) (0.0263) (0.0288) (0.0240) (0.0271)
Change in decade average 0.249*** 0.138*** 0.138*** 0.0992*** 0.128***
employment growth rate (0.0496) (0.0324) (0.0342) (0.0332) (0.0387)
Immigrant share of MSA population, –0.0337*** –0.0338*** –0.0262*** –0.0349***
1990 (0.00334) (0.00377) (0.00411) (0.00607)
Change in average increase in –0.0146 –0.0851 0.551
log(real minimum wage) (0.424) (0.400) (0.753)
Change in log(share of immigrants 0.371** 0.451***
- college degree) (0.157) (0.155)
Maximum cash benefi t, family of 0.0753**
three (0.0380)
Change in percent of low- skilled 0.0178
Cadena
929
MSA in state that restored TANF –0.0222
benefi ts (0.121)
MSA in state that restored Medicaid –0.213*
benefi ts (0.116)
MSA in state that restored SSI 0.490***
benefi ts (0.134)
Constant 0.470*** 0.944*** 1.144*** 1.163*** 1.169*** 0.935*** 0.581*
(0.0746) (0.144) (0.158) (0.115) (0.220) (0.211) (0.349)
Number of Cities 157 157 157 157 157 157 157
First Stage Coeffi cient 0.442 0.413 0.487 0.474 0.429 0.435
First Stage F- stat 25.51 27.44 50.05 41.98 27.28 30.03
Robust standard errors in parentheses *** p<0.01, ** p<0.05, * p<0.1
probability that an immigrant selects a given city.27 The coef
fi cient in column 2 thus im-plies that a city experiencing a one- percentage point larger than average welfare- induced increase in native female labor supply saw roughly a seventeen percent de-crease in the probability that a female immigrant chose to locate there. This difference in supply increases would result from slightly less than a one standard deviation dif-ference in pre- reform program participation.28
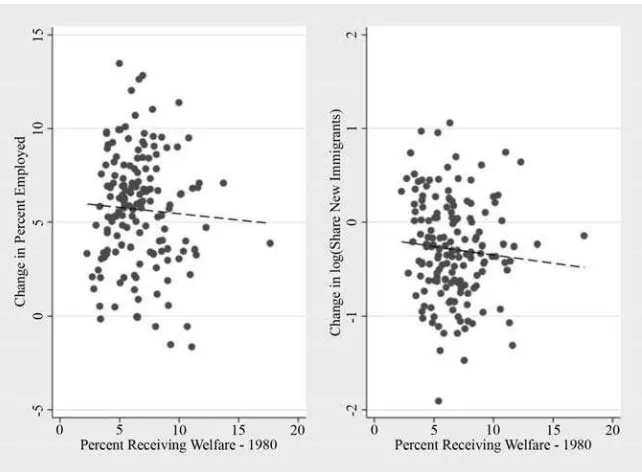
As an initial falsifi cation test, Figure 6 presents analogous results using data from one decade prior. Importantly, neither the fi rst stage nor the reduced form relationship holds in a time period without a dramatic change to welfare policy.29 The lack of a
27. The percentage change in the choice probability resulting from a one unit change in the independent variable is (eβΔx−1) /ΔX, or approximately for small changes in X. This interpretation provides the reduced form interpretation. Based on the discrete choice model, the change in the probability that a city is selected resulting from a one unit change in X is p(1 – p) . With small probabilities (the mean is 1 / 157), the difference between these two interpretations is minimal.
28. The standard deviation in welfare participation is 3.05 percentage points, and the fi rst stage coeffi cient implies that each percentage point difference in pre- reform participation leads to a 0.44 percentage point increase in employment.
29. Both point estimates are slightly negative, and neither is statistically signifi cant.
Figure 6
Falsifi cation Test: Changes in Native Female Employment and New Immigrant Locations 1980–1990 By 1980 Welfare Participation
fi rst- stage relationship over this period rules out certain alternative interpretations of the employment increases over the 1990s. For example, suppose that high welfare participation were indicative of poor labor market conditions and that the subsequent increases in labor supply were the result of negatively serially correlated shocks. The fi rst- stage results over the 1980s provide no support for this hypothesis. Similarly, the lack of a reduced form relationship rules out the possibility of pre- existing trends away from cities with high welfare participation.30 This pair of results strengthens the cred-ibility of interpreting the relationships shown in Figure 3 as resulting from immigrants avoiding labor market competition with welfare leavers.
IV. C Results Robust to Additional Controls
The remainder of Table 5 adds additional control variables to address alternative inter-pretations of the basic set of results. First, suppose that local labor demand shocks over the 1990s were negatively correlated with welfare participation rates at the start of the decade, even though this appears not to have been the case in the 1980s. Under this scenario, these cities may have lost immigrant share even if immigrants did not react to the increases in native labor supply. Column 3 includes the change in the decade average annual employment growth rate as a means of controlling for this potentially omitted factor.31 This variable enters the model with the expected sign: the distribution of immigrants shifted away from cities with slowing employment growth and toward cities with improving growth. The parameter estimate for native female supply is not substantially affected, however, suggesting that the supply shocks created by welfare reform were reasonably uncorrelated with the size of any concurrent demand shocks.
Alternatively, suppose that high welfare participation cities also tended to be tradi-tional locations for immigrants. If traditradi-tional locations became less popular for reasons unrelated to welfare reform then these cities would have lost immigrant share even in the absence of the policy- driven labor supply increases. The specifi cation in Column 4 addresses this possibility. An immigrant arriving in the 1990s faced a very similar geographic distribution of previously arriving immigrants as did an immigrant arriv-ing in the 1980s. In this differenced specifi cation, therefore, including the fraction of a city that was foreign- born in 1990 as a covariate allows for differential infl ow trends based on a city’s status as a traditional destination.32 The negative coeffi cient estimate is consistent with a diffusion of immigrants across the country, with traditional des-tinations tending to lose immigrant share. Yet the coeffi cient on native labor supply remains negative and signifi cant. In fact, even though the point estimate decreases in magnitude, the inclusion of this variable increases the precision of the estimates substantially.
30. The welfare participation rates are remarkably stable across cities from 1980 to 1990. Additional analysis (not shown, but available upon request) using the difference between the 1990–2000 change in share and the 1980–1990 change in share as the dependent variable also shows a statistically signifi cant break in trends in favor of cities with fewer welfare leavers in the 1990s.
31. These data come from the County Business Patterns, and I aggregate to the same consistent geographic boundaries used for variables based on the PUMS. The variable is calculated as the population- weighted average annual growth rate for the counties comprising each MSA.
One may also be concerned that changes in other labor market policies affected the desirability of choosing each location. In particular, differential increases in the mini-mum wage may have affected the returns to entering each local labor market (Cadena, forthcoming). The specifi cation in column 5 includes a measure of minimum wage policy as an additional control to address this concern. I begin by calculating, for each MSA in each month, the percentage change in the minimum wage relative to January at the start of the decade. I then average these changes over each decade and calculate decadal changes. Thus, this variable measures the extent to which an MSA’s minimum wage policy became more or less active from the 1980s to the 1990s.33 The inclusion of this variable has a negligible infl uence on the other coeffi cients, suggesting that differences in minimum wage policy are not confounding the analysis.
The time differencing strategy effectively removes the infl uence of any unobserved city amenities that are fi xed over time, and the specifi cations in Columns 1–5 con-trol directly for multiple time- varying reasons that immigrants selected new locations over the 1990s. Yet there may still be changes in unobserved city- level characteristics that are correlated with the reform- induced supply increases. One way to address this potential source of bias is to include a city’s change in immigrant share among a group whose expected earnings should be relatively less affected by welfare reform. To accomplish this, I include the change in the city’s share of female immigrants with at least some college education. This variable enters with a positive sign and strong signifi cance (column 6), but the coeffi cient of interest remains strongly negative.
The fi nal column addresses the so- called “welfare magnets” hypothesis, which provides an alternative mechanism through which welfare reform may have affected immigrants’ preferences over cities. Previous research contends that states with more generous welfare benefi ts attract larger infl ows of eligible immigrants (Borjas 1999). Suppose that welfare reform essentially “turned off” these magnets, and, as a result, cities in generous states were no longer especially attractive to immigrants. In fact, immigrants arriving after reform were required to wait fi ve years until receiv-ing benefi ts, and unauthorized immigrants were barred altogether. To address this possibility, I include both the maximum benefi t level for a family of three in 1990, which allows for initially generous cities to become less popular as reform equalizes potential benefi ts across locations, and a direct measure of the change in the share of low- skilled immigrants receiving welfare benefi ts. The positive coeffi cient on the maximum benefi t variable and the statistically insignifi cant coeffi cient on the change in benefi t receipt fail to provide support for this alternative interpretation. I also include dummy variables for whether a state restored each of four programs to post- reform legal immigrants using its own funds.34 The resulting coeffi cients are variable and mostly insignifi cant, and they are, on the whole, consistent with previous work fi nding no direct effect of policy reforms on immigrants’ location choices (Kaushal 2005).
33. Because the minimum wage is a state- level policy, I initially calculated this measure for each state. For MSAs that cross state lines, I calculated a population- weighted average of the state- level measure. I use a monthly state panel with exact dates of policy implementation to construct this measure. These data were originally compiled for Cadena (forthcoming).
IV. D Robustness and Response Heterogeneity
The set of results above are consistent with the central hypothesis that newly arriving immigrants tended to avoid locations with more welfare leavers, and that they did so to avoid the increase in labor market competition that those supply increases repre-sented. The remainder of the results present robustness checks and address additional hypotheses suggested by this interpretation of these fi ndings.
I fi rst relax the restriction that unobserved locational amenities are equally valu-able to all immigrants, with results reported in Tvalu-able 6. As discussed in Section III, these attributes are likely different depending on the immigrant’s source region. A changing mix of immigrant sources could lead to a different distribution of settlement patterns, even in the absence of immigrants responding to labor market incentives. This set of regressions addresses that concern by explicitly allowing the unobserved city attributes to vary for each source region and changing the dependent variable to source- specifi c immigrant shares.35 Each city may have as many as eleven observa-tions, one for each source region identifi ed in Table 2.36 In columns (4) through (6), I replace the generic immigrant concentration variable from Table 5 with an analogous measure of whether the city was a traditional location for immigrants from the spe-cifi c source region. The results through all specifi cations are quite similar to the main results in Table 5. Although somewhat smaller in magnitude and less precisely esti-mated, these specifi cations continue to support the conclusion that immigrants chose cities with smaller native supply increases.
The discussion in Section III suggested that immigrants arriving without legal au-thorization are likely to be the most earnings- sensitive. Although the census data do not include an immigrant’s visa status, examining the heterogeneity in responsiveness across source regions presents an opportunity to address this hypothesis. Table 7 lists the coeffi cient and standard error from running the specifi cation in column (6) of Table 6 separately for each source population. The estimates are somewhat noisy, which limits the degree to which these differences allow for sharp conclusions. Nevertheless, the pattern of the point estimates suggests that the most earnings- sensitive migrants are the most likely to be unauthorized, with the largest responses among immigrants from Mexico and Central America.
Table 8 addresses an additional hypothesis implied by the timing of the supply shocks. Although some of the reforms to the welfare system were implemented in the fi rst part of the decade, the descriptive results in Figure 2 suggest that the supply increases were largest in the latter half. If the labor market competition explanation is correct, women arriving early in the decade should be less affected, provided that their initial decision creates some inertia. To create this table, I estimate the specifi ca-tion from column (5) of Table 5 separately for three different subgroups. The fi rst group consists of women who arrived prior to 1995 and who are currently living in
35. Because the share of immigrants selecting each city will be more precisely estimated for regions with more observations, I weight each source- destination pair by the square root of the total number of observa-tions from each source country. I report standard errors clustered by MSA in all specifi cations with multiple observations per city.
The Journal of Human Resources
Table 6
Change in Log(Share of Female Immigrants Selecting a City). Source- Destination Pairs.
OLS (1)
IV (2)
IV (3)
IV (4)
IV (5)
IV (6)
IV (7)
Change in native female employment –0.0208 –0.155*** –0.159*** –0.120*** –0.0989** – 0.0785** –0.0820*
rate (0.0190) (0.0532) (0.0507) (0.0394) (0.0441) (0.0388) (0.0445)
Change in decade average 0.173*** 0.120*** 0.0902** 0.0529 0.0456
employment growth rate (0.0415) (0.0297) (0.0372) (0.0324) (0.0361)
Ethnic group members as percent of –0.236*** –0.222*** –0.200*** –0.176***
MSA pop - decade start (0.0270) (0.0289) (0.0264) (0.0259)
Change in average increase in log(real 0.738 0.510 0.923
minimum wage) (0.508) (0.440) (0.758)
Change in log(share of immigrants 0.305*** 0.275***
- college degree) (0.0479) (0.0444)
Maximum cash benefi t, family of 0.0312
three (0.0399)
Change in percent of low- skilled female –0.0180
immigrants receiving welfare (0.0186)
MSA in state that restored Food –0.142
Cadena
935
MSA in state that restored Medicaid –0.00741
benefi ts (0.120)
MSA in state that restored SSI benefi ts –0.293***
(0.111)
Constant 0.0664 0.430** 0.601*** 0.466*** 0.177 0.147 –0.0414
(0.115) (0.181) (0.181) (0.149) (0.277) (0.246) (0.373)
Observations (Source- Destination Pairs) 1,136 1,136 1,136 1,136 1,136 1,136 1,136
First Stage Coeffi cient 0.357 0.352 0.369 0.364 0.360 0.377
First Stage F- stat 20.70 22.42 26.04 18.91 18.34 21.76
Standard Errors clustered by MSA in parentheses *** p<0.01, ** p<0.05, * p<0.1
Table 7
IV Coeffi cient on Change in Female Employment – By Source Region
Coeffi cient Standard Error
Note: The specifi cation and sample selection criteria are identical to column (6) of Table 6.
Table 8
Reduced Form Estimates of Change in Log(Share) by Arrival Year
All
Welfare participation rate - – 0.0624*** –0.0550*** –0.0652*** –0.0673*** low education women (0.0128) (0.0142) (0.0158) (0.0150)
Change in average 0.0492* 0.0290 0.0329 0.00985
employment growth rate (0.0250) (0.0243) (0.0296) (0.0363) Immigrant share of MSA – 0.0193*** 0.00184 –0.0258*** – 0.0501*** population, 1990 (0.00330) (0.00424) (0.00427) (0.00581)
Change in average increase in 0.205 –0.369 0.664* 0.393 log(real minimum wage) (0.347) (0.457) (0.394) (0.491)
Constant 1.013*** 0.631*** 0.993*** 1.590***
the same MSA as in 1995. The second group includes only women arriving in the US after 1995. The fi nal group consists of those who arrived in the fi rst half of the decade but who have moved across MSAs since 1995.37 Because I do not have a measure of native female employment changes at this fi ve- year interval, I report the reduced form coeffi cients. For reference, the reduced form coeffi cient from Table 5, column (5) that uses women arriving over the entire sample period is reported in the fi rst column. These results reveal that the negative relationship is stronger among later arrivers and internal movers, which is consistent with the timing of the implementation of reform.
For completeness, I consider the responses of low- skilled male immigrants in Table 9. Given the different degree of overlap in occupation and industry seen in Table 1, it is reasonable to expect that these supply shocks represented a larger effective increase in labor market competition for female immigrants than for male immigrants. After the inclusion of important controls (in column 6, for example), the results suggest that men responded to a lesser degree than did female immigrants. The male elasticity is about 75 percent of the female elasticity, which is roughly as anticipated, given that the male indices measuring the effective supply shock of native welfare leavers were 45–60 percent as large as the female indices (Table 1). The somewhat higher than expected coeffi cient may result from a number of factors including joint location deci-sions with a spouse or other female family member, or it may be the case that men are simply more earnings- sensitive in deciding where to locate, which would lead to a stronger male response to any given expected earnings shock.
IV. E Magnitude of Crowdout and Implications for Previous Studies
Taken as a whole, therefore, the results in this section support interpreting the chang-ing distribution of immigrants’ locations as an earnchang-ings- maximizchang-ing response to changes in local labor market opportunities. One fi nal question concerns the extent to which these changing location patterns effectively “undid” the labor supply shocks created by welfare reform. Figure 7 presents a back of the envelope calculation in response to this question, based on the IV regression results in Table 5, column 6. The x- axis measures the predicted increase in native female labor supply based on the fi rst stage regression, expressed as a fraction of the low- skilled female population (both native- born and immigrants) in 1990.38 This measure thus provides the percentage growth in the supply of low- skilled native labor due to welfare reform. The y- axis displays the “extra” female immigrants in the local labor force as predicted by the model, also measured as a fraction of the low- skilled female population in 1990. The “extra” immigrants variable is the difference between the predicted number of immigrants joining a city’s labor force using actual pre- reform welfare participation rates and the predicted number who would have entered if all cities had had the mean participation rate.39 The slope of the linear regression line is – 0.53 with a standard
37. Ideally, one would examine those who chose their current location prior to any reforms (pre- 1993), but the census only asks an immigrant’s arrival year and location in 1995; so this group cannot be precisely identifi ed.
38. The numerator in this calculation is the predicted change in native labor force participation multiplied by the number of natives in 1990.
The Journal of Human Resources
Table 9
Change in Log(Share of Male Immigrants Selecting a City)
OLS (1)
IV (2)
IV (3)
IV (4)
IV (5)
IV (6)
IV (7)
Change in native female –0.0359* –0.203*** –0.224*** – 0.132*** –0.114*** –0.0775*** –0.0661**
employment rate (0.0198) (0.0589) (0.0588) (0.0312) (0.0321) (0.0269) (0.0262)
Change in decade average 0.287*** 0.111*** 0.0809** 0.0374 –0.00243
employment growth rate (0.0624) (0.0363) (0.0397) (0.0379) (0.0403)
Immigrant share of MSA –0.0538*** – 0.0493*** –0.0391*** –0.0339***
population, 1990 (0.00536) (0.00526) (0.00578) (0.00635)
Change in average increase in 1.109** 0.866* –0.685
log(real minimum wage) (0.496) (0.445) (0.812)
Change in log(share of immigrants 0.530*** 0.568***
– college degree) (0.158) (0.151)
Maximum cash benefi t, family of –0.0563
three (0.0421)
Change in percent of low- skilled 0.0138
Cadena
939
MSA in state that restored TANF 0.120
benefi ts (0.164)
MSA in state that restored Medicaid –0.486***
benefi ts (0.146)
MSA in state that restored SSI 0.380***
benefi ts (0.144)
Constant 0.718*** 1.279*** 1.508*** 1.538*** 1.103*** 0.849*** 1.670***
(0.0993) (0.198) (0.221) (0.139) (0.248) (0.212) (0.408)
Number of Cities 156 156 156 156 156 156 156
First Stage Coeffi cient 0.442 0.413 0.487 0.474 0.446 0.436
First Stage F- stat 25.51 27.44 50.05 41.98 30.67 31.86
Robust standard errors in parentheses *** p<0.01, ** p<0.05, * p<0.1
error of 0.07, which implies that when natives representing a one percentage point increase in the local supply of low- skilled female labor entered the labor market, immigrants equivalent to 0.53 percent of the previous workforce chose alternative locations.
This calculation suggests that changing immigration patterns substantially diffused the local supply shocks created by welfare reform throughout the country, which has important implications across multiple literatures. First, the magnitude of the response provides a compelling reason why research examining the effect of reform- induced supply shocks on other native- born groups have tended to fi nd little to no effect. For example, Blank and Gelbach (2006) fi nd little evidence that welfare leavers had any detrimental effect on the employment and wages of low- skilled men.
In addition, this result presents a potential alternative explanation for the
consis-the low- education female population in 1990, and Sˆ represents the share of new immigrants predicted by the regression results. To calculate Sˆshockj I take exp(Δplog(S2000)+log(S1990)), or the exponential of the sum of the log share from 1990 and the predicted change in log share from the regression. Sˆnoshockj is calculated similarly, but using the average pre- reform participation rate rather than the true rate in forming the predicted change in log share. I rescale the predicted shares so that they add to 1 across all locations (the unadjusted shares add to 0.95 and 1.01).
Figure 7
Predicted Additional Immigrants Selecting a City By Predicted Natives Entering Labor Force
tently observed similarities in native labor market outcomes between cities receiving large immigrant infl ows and comparison cities. In contrast to tests of the so- called “skating rink hypothesis”, which fi nd that immigrant infl ows are not offset by native outfl ows (Card and DiNardo 2000; Card 2001), this paper fi nds substantial displace-ment of immigrants in response to competing workers entering a local labor market. The key difference is this study’s focus on the location decisions of a highly mobile factor, and the results suggest that endogenous immigrant infl ows are an important equilibrating force. As a concrete example of how this mechanism may explain other-wise surprising fi ndings, Card and Lewis (2007) fi nd that natives in cities with larger “unexpected” new infl ows of Mexican immigrants during the 1990s fared no worse than did natives in other cities. Yet these new destinations tended to have smaller rela-tive numbers of former welfare recipients entering the labor market.40
A more diffi cult question is whether the degree of endogeneity identifi ed in this paper implies a substantial bias in a city- level regression of native wages or employ-ment on immigrant infl ows more generally. It is certainly true that earnings- sensitive entry will tend to make the estimated coeffi cient in such a regression more positive, which will bias the estimates toward zero when the true elasticity is negative. In the online appendix, however, I show that quantifying the magnitude of this bias requires additional modeling assumptions because knowing how fl ows change in response to changes in labor market prospects provides only a partial answer.41 One also needs to know what share of the variation in immigrant infl ows is due to factors other than earnings- sensitive entry as well as whether infl ows are correlated with unobserved wage changes for merely coincidental reasons.
The total amount of bias can vary substantially depending on these additional fac-tors, even holding constant the degree to which immigrants choose locations based on labor market conditions. For example, if the only source of bias in a wage regression was the response to reform- induced native supply shocks, there would be relatively little bias because the shift away from these supply shocks explains a fairly small portion of the total variation in immigrant infl ows.42 On the other hand, if immigrant fl ows consistently responded as strongly to other unobserved shocks as they did to the supply increases studied in this paper, this endogeneity could produce a substantial bias, even one large enough to produce an estimated coeffi cient that was the opposite sign of the true demand elasticity.43 In any case, this paper provides direct evidence of the type of endogeneity that motivated the use of an instrumental variables ap-proach to isolate exogenous variation in immigrant infl ows. Assessing the validity of the most common instrument – predicting infl ows based on the location pattern of previous migrants from the same sending country – is thus a valuable topic for future research.
40. The cities the authors mention in the text as surprising are Houston, Dallas, Atlanta, Phoenix, Las Vegas, New York, Denver, Portland, Salt Lake City, Washington, DC, Seattle, Raleigh- Durham, Greensboro, and Charlotte. Only New York, Seattle and Raleigh- Durham had pre- reform participation rates above the median (see Figure 4.)
41. This appendix is available through http: // uwpress.wisc.edu / journals / journals / jhr.html.
42. Calculations described in the online appendix suggest that such a coeffi cient would be attenuated by roughly ten percent.