Assessment of Teacher Effectiveness
Charles T. Clotfelter
Helen F. Ladd
Jacob L. Vigdor
a b s t r a c t
Administrative data on fifth grade students in North Carolina shows that more highly qualified teachers tend to be matched with more advantaged students, both across schools and in many cases within them. This matching biases estimates of the relationship between teacher characteristics and achievement; we isolate this bias in part by focusing on schools where stu-dents are distributed relatively evenly across classrooms. Teacher experience is consistently associated with achievement; teacher licensure test scores associate with math achievement. These returns display a form of hetero-geneity across students that may help explain why the observed form of teacher-student matching persists in equilibrium.
I. Introduction
Nearly all observers of the education process, including scholars, school administrators, policymakers, and parents, point to teacher quality as the most
Charles T. Clotfelter is the Z. Smith Reynolds Professor of Public Policy Studies at Duke University. Helen F. Ladd is the Edgar T. Thompson Distinguished Professor of Public Policy Studies at Duke University. Jacob L. Vigdor is an associate professor of public policy studies and economics at Duke University, Box 90245, Durham, NC 27708. The authors thank Roger Aliaga, Russell Triplett, and Jane Cooley for outstanding research assistance, the Spencer Foundation for financial support, Diane Whitmore and three anonymous referees for valuable comments, and participants in seminars or presentations at the University of Virginia, the University of Michigan, the University of Connecticut, the University of Chicago, Duke University, Harvard University, and the APPAM fall conference for their comments and suggestions. A previous draft of the current paper was entitled, “Teacher Sorting, Teacher Shopping, and the Assessment of Teacher Effectiveness.” The data used in this article can be obtained by application to the North Carolina Education Research Data Center, administered by Elizabeth Glennie, Duke University, Box 90312, Durham NC 27708, <eglennie@duke.edu>.
[Submitted April 2005; accepted January 2006]
ISSN 022-166X E-ISSN 1548-8004 © 2006 by the Board of Regents of the University of Wisconsin System
significant institutional determinant of academic success.1Considerable uncertainty remains, however, concerning exactly which aspects of teachers are important, whether those aspects can be measured, and whether that effectiveness differs by type of student. Recent studies by Rivkin, Hanushek, and Kain (2005); Hanushek, Kain, O’Brien, and Rivkin (2005); Ballou, Sanders, and Wright (2004); Rockoff (2004); Nye, Konstantopoulos, and Hedges (2004); and Aaronson, Barrow, and Sander (2003), for example, find evidence of significant across-teacher variation in student test scores, but find little evidence that any observable teacher characteristic, save experience, explains any of this variation.
Estimates of the impact of teacher characteristics in studies like these will be biased in situations where nonrandom sorting of students and teachers into schools and class-rooms introduce correlations between the included characteristics and unobserved determinants of student test scores.2This paper examines the extent to which the non-random matching of teachers to students generated by these sorting processes affects estimates of the relationship between teacher characteristics and student achievement. Our goals are both to provide new evidence on this policy-relevant behavior and to illustrate how rich administrative data can be used to approximate the results that would emerge from a random experiment.
We begin by documenting the extent of nonrandom teacher-student matching, using an administrative data set covering the population of elementary students in the State of North Carolina, which matches most students to their individual classroom teachers. Consistent with previous evidence, we find that teachers with more experience, degrees from more competitive colleges, and advanced degrees tend to teach at schools serv-ing more affluent, higher achievserv-ing and whiter populations. We find additional evi-dence that even withinschools, teachers with stronger credentials tend to teach more affluent students. This evidence is consistent with existing research on teacher labor market sorting and parental efforts to secure better resources for their children.
We then examine how the sorting of teachers and students affects estimates of teacher effectiveness. In contrast to some recent studies, which estimate achievement models with teacher fixed effects and then regress the fixed effects on observable characteristics (see, for example, Nye, Konstantopoulos, and Hedges 2004 or Aaronson, Barrow, and Sander 2003), we focus on the direct estimation of the rela-tionship between teacher credentials and student outcomes.3Any bias uncovered in
Clotfelter, Ladd, and Vigdor 779
1. See, for example, Darling-Hammond 2000 and Hardy 1999. That public policy also recognizes the impor-tance of having highly qualified teachers in every classroom is indicated by government regulation at many levels including standards for highly qualified teachers mandated by the Federal No Child Left Behind Act, state-level licensing requirements, and local hiring practices.
2. The Nye et al. (2004) study, which uses data from the Tennessee STAR experiment, may be immune to this criticism, because it estimates teacher fixed effects within schools where students were assigned to class-rooms randomly. There have been a number of criticisms of the randomization process in the Tennessee STAR experiment, however; see Krueger (1999) for a discussion. See Todd and Wolpin (2003) for a general discussion of omitted variables bias in models of student achievement.
our analysis, it should be noted, applies with equal force to models that employ teacher fixed effects.
We employ three strategies to counter the bias that arises from the processes of sort-ing that arise across and within schools: the addition of an extended set of student-level control variables, the use of school fixed effects, and the use of a subsample of the schools that feature relatively balanced distributions of students across class-rooms, based on observable characteristics.4Our results suggest that the bias from between-school sorting is large; the bias associated with sorting within schools, by contrast, is more limited in nature and may actually vary in sign across subsamples of schools. Ultimately, two characteristics—teacher experience and licensure test scores—emerge as robust determinants of test scores for fifth grade students.
Additional tests for differential effects by type of student provide suggestive evi-dence that the math score returns to teacher attributes are higher for more advantaged, higher performing students. This finding implies, first, that efforts to increase the math achievement of low-performing students by assigning them more experienced teach-ers could reduce average math test scores, potentially setting the stage for a classic equity-efficiency tradeoff. Second, it provides an additional possible explanation for the observed equilibrium patterns of teacher assignment that favor more advantaged students.
II. Sorting, nonrandom matching, and the potential
for bias in estimated teacher effects
The principal empirical strategy used in the economics literature to assess the importance of teachers and teacher characteristics is the estimation of edu-cation production functions, which generally take the form:
(1) yijt= δyijt–1+ β1Xit+ β2Xjt+ ∈ijt
where iindexes students, jindexes classrooms, and tindexes time (Rivkin, Hanushek, and Kain 2005; summaries by Hanushek 1986, 1997, 2002; Goldhaber and Brewer 2000; Summers and Wolfe 1977; and Coleman et al. 1966). The dependent variable is a standardized test score.5The lagged test score is typically included in the equa-tion to reflect the cumulative nature of the educaequa-tion process and is intended to pick up the effects of prior year school and family characteristics. The parameter δis in many cases constrained to be equal to one. In other cases, such as in studies for which lagged test scores are unavailable or in studies using adult outcomes as the dependent
4. While we cannot prove that assignment is truly random in these schools, any within-school sorting of stu-dents would have to be uncorrelated with a vector of six student characteristics including measures of past achievement, socioeconomic status, and race. The ratio of selection on unobservables to selection on observ-ables would have to be very high to attribute the results we obtain to selection (Altonji, Elder, and Taber 2002).
variable, δmay be constrained to 0. In still other cases, the parameter δis estimated explicitly.6The vector X
itmeasures the characteristics of student iat time t, and may
contain time-invariant characteristics such as student gender or race. The vector Xjt
represents measurable school inputs, including class size as well as teacher charac-teristics. Recent literature has included teacher fixed effects as elements of Xjt.
Obtaining unbiased estimates of β2, the marginal effects of school inputs, is diffi-cult because parent- or teacher-driven processes of across-school and within-school sorting are likely to lead to a situation in which observable characteristics of students, teachers, and classrooms are correlated with unobserved, and hence omitted, factors related to student and teacher ability or to other factors that positively influence achievement, such as parental involvement. A similar problem arises in models that use teacher fixed effects.7
The first such process, which we call across-school sorting, has to do with how teachers and students choose, or are assigned to, schools. As numerous empirical stud-ies have shown, teachers’ preferences among districts are influenced by factors such as salary levels and student characteristics, and among schools within districts by the characteristics of the students, with the more qualified teachers often showing both the inclination and ability to transfer to schools with more advantaged students.8At the same time that teachers are making decisions about where to teach, parents are also making decisions that affect how students are distributed across schools. Many of these parental decisions involve the choice of where to live, as in the well-known Tiebout (1956) model.9But in some cases, such as in districts permitting some form of school choice, parents may be able to choose among schools without having to move.
The second major process driving the matching of teachers with students, within-school sorting, has received much less attention in economic models. Parents often form opinions regarding which of the available teachers in a school they would most prefer to teach their children; some act on these preferences by trying to influence administrative decisions regarding who will teach their child (Hollingshead 1949;
Clotfelter, Ladd, and Vigdor 781
6. Typically omitted from the standard model are unmeasured characteristics of students, such as their abil-ity and motivation, that affect achievement. Provided such variables have constant effects on achievement over time and that their effects deteriorate at the same rates as prior achievement, they cancel out in this lagged form of the production function. See Boardman and Murnane (1979) for other assumptions that would generate this particular form of the production function. In an assessment of the econometric issues raised by such models, Todd and Wolpin (2003) argue that the value-added version of the model (δ= 1) assumes that inputs have the same effects at all grade levels, while the explicitly estimated version (lagged achievement) assumes that the effects of inputs decay over time at a constant rate. Constraining δto 0 implies that only contemporaneous inputs matter.
7. The kind of nonrandom sorting observed in schools has similarities to job training programs. LaLonde (1986) compares experimental and nonexperimental estimation strategies in that latter application. 8. Empirical studies of teacher moves and quits reveal that teachers are more likely to switch schools within a district, move from one district to another, or quit altogether if their original school has a higher percent-age of low-achieving, low-income, or minority students or a high student-teacher ratio See New York Public Education Association (1955), Mont and Rees (1996), Freeman, Scafidi, and Sjoquist (2002, Tables 10-12), Lankford, Loeb, and Wyckoff (2002, Tables 10 and 11), Reed and Rueben (2002). Sieber’s (1982, p. 42) study of classroom assignments in a New York City elementary school reports that teachers normally “viewed as a rewarding and prestigious task” the assignment to classes with advanced students.
Sieber 1982; Lareau 1987 and 2000; Oakes 1995). Although many principals appear to resist such efforts, this kind of “teacher shopping” often seems to be successful (Hui 2003). Teachers themselves may be an additional source of within-school sort-ing. Experienced teachers, for example, may successfully resist being assigned less able students.
If these two processes result in the matching of more able students to teachers with stronger qualifications, a state we refer to as positive matching, coefficients on these qualifications will be biased upward. Available evidence indicates that positive match-ing of teachers and students is the empirical norm (Rivkin, Hanushek, and Kain 2005; Betts, Zau, and Rice 2003; Clotfelter, Ladd, and Vigdor 2005).10The alternative con-dition—negative matching–would occur if teachers with stronger qualifications were assigned to classes with the less able students.11In such a scenario, coefficients on teacher qualifications would be biased downward.
III. North Carolina data
The data we use for this study are derived from administrative records maintained by the North Carolina Education Research Data Center (NCERDC).12 North Carolina is an appropriate state for this analysis for several reasons. Because it has a statewide course of study, its tests are closely aligned with what students are expected to know and be able to do. Hence, test scores are likely to measure more fully what teachers have taught than in many other states. The state is relatively large and exhibits substantial variation across its 117 school districts with respect to the racial and socioeconomic mix of the students and student performance. Although teachers’ associations in North Carolina have no collective bargaining power, cross-district variation in salary schedules, and variation in working conditions across schools, create incentives for teachers to sort in nonrandom ways. Finally, we note that the state boasts a stable and relatively sophisticated performance-based account-ability system which could potentially exacerbate the incentives for positive matching (Clotfelter et al. 2004).
We link several different sets of records to form the database used for this analysis. Student information, including race, gender, participation in the federal free and reduced price lunch subsidy program, and standardized test scores are derived from student test records. In addition to these variables, which are available in many admin-istrative data sets, responses to a number of supplemental survey questions, including information on parental education, students’ computer use, hours spent watching tel-evision, and hours spent reading for leisure at home, as well as a measure of time spent on homework are also available. Each student test score record identifies the
10. See Clotfelter, Ladd, and Vigdor (2005) for a discussion of theoretical rationales for positive matching. 11. Negative matching might be predicted by a Lazear (2001)-style model of an aggregate achievement-maximizing administrator, in the event that the returns to teacher quality are highest for low-performing students. Evidence presented below suggest that this condition does not hold, at least for the measure of achievement utilized by North Carolina public schools.
name of the teacher who administered the test. In elementary schools, the teacher administering the test is most likely a student’s regular classroom teacher.13By con-fining our attention to fifth grade students, we are thus able to link the test score data-base to information on teacher qualifications. As far as we know, North Carolina provides the only statewide data set that permits the matching of teachers to students at the classroom level.
The teacher data come from a state-maintained archive of personnel records. For each teacher, information is available on licensure test scores, including the type of test taken and the year it was administrated; undergraduate institution attended, whether the teacher has any advanced degrees or is National Board Certified, and the number of years of teaching experience. We formed a standardized licensure test score variable for each teacher by converting test scores from different test administrations in North Carolina to standardized scores using the means and standard deviations for tests taken in each year by all teachers in our data set.14The years of experience variable is the one used by the state to determine a teacher’s salary, and generally counts all years of teaching whether in the State of North Carolina, or elsewhere, for which the state has given the teacher credit.15Basic demographic information on each teacher, including race and gender, are also available.
Table 1a presents basic summary statistics describing the fifth grade teachers work-ing in North Carolina durwork-ing the 2000–20001 school year, for both the full sample and also the evenly balanced school subsample, to which we will return in Section V. The vast majority of the 3,842 individuals matching our definition of a fifth grade teacher were female and white. The median teacher had between six and 12 years of prior experience and fewer than one in ten had no prior experience. The proportion of teachers with licensure test scores within one standard deviation of the mean is slightly more than would be expected with a purely normal distribution (73 percent
Clotfelter, Ladd, and Vigdor 783
13. To verify that a teacher listed as administering a test to students in grade iin school j, was actually a classroom teacher in grade iin school j, we cross-referenced a separate North Carolina administrative data set, the School Activity Report, which records the identity and assignment of each teacher in each school. This cross-reference eliminates teachers who taught noncore subjects in school j(for example, music, phys-ical education), those who started positions at the school midyear, and those who had no regular position at the school. Student test score records associated with an “eliminated” teacher are excluded from our analy-sis. Moreover, since we focus on schools with more than one classroom per grade in order to exploit within-school variation in teacher characteristics, students with a valid teacher but in a within-school with no other valid teachers were also excluded from the sample.
14. From the early 1960s through the mid-1990s, all elementary school teachers were required to take either the Elementary Education or the Early Childhood Education test. Starting in the mid-1990s, teachers were required to take both an Elemenatary Education Curriculum and an Elementary Education Content test. We normalized test scores on each of these tests separately for each year the test was administered based on means and standard deviations from test scores for all teachers in our data set, not just those in our 2001 sub-set of fifth grade teachers. For teachers with multiple test scores in their personnel file, our teacher test score variable equals the average of all scores for which we can perform this normalization. While in principle it would be interesting to enter licensure test scores separately, rather than as a composite, the potential for endogenous choice of test taken on the part of teachers would complicate any such analysis.
rather than 68 percent), and the teachers with test scores outside this interval are dis-proportionately drawn from the lower tail of the distribution. Provided outside oppor-tunities are positively correlated with teacher test scores, this distribution is consistent with a positive correlation between the probability of departure and access to non-teaching opportunities.16Most teachers graduate from colleges ranked by Barron’s as being competitive, and more teachers are drawn from the schools at the low end of the Table 1a
Summary Statistics for Fifth Grade Teachers in North Carolina
Evenly balanced Full sample school subsample (N = 3,223) (N = 1,287)
Percent female 90.32 91.30
Percent white 84.64 86.48**
Percent black 14.24 12.43**
Percent Hispanic 0.22 0.31
Percent with
0 years experience 7.38 7.46
1–2 years experience 13.34 13.52
3–5 years experience 15.02 14.30
6–12 years experience 21.84 22.84
13–20 years experience 16.29 16.47
20–27 years experience 17.00 15.77
More than 27 years experience 9.12 9.63
Percent with licensure test scores
One standard deviation or more below mean 17.84 16.86
Within one standard deviation of mean 72.54 73.82
One standard deviation or more above mean 9.62 9.32
Percent graduating from college
Ranked as very competitive 9.22 9.17
Ranked as competitive 53.74 55.17
Ranked as less competitive 36.18 34.65
Not ranked by Barron’s 0.87 1.01
Percent national board certified 3.35 3.26
Percent with advanced degree 23.67 23.85
** denotes a statistic that differs between the evenly balanced school subsample and residual set of North Carolina elementary schools at the 5 percent significance level.
Clotfelter, Ladd, and Vigdor 785
Table 1b
Summary Statistics for Fifth Grade Students in North Carolina
Evenly balanced Full sample school subsample
(N = 60,791) (N = 24,824)
Percent female 49.88 49.67
Percent white 62.51 65.46**
Percent black 29.93 27.25**
Percent Hispanic 3.19 3.26
Percent free/reduced price lunch 41.91 40.19**
Percent labeled as gifted 16.56 16.83
Percent labeled as handicapped 10.66 10.90 Percent limited English proficient 1.22 1.33** Percent with fourth grade test score
One standard deviation or more below mean 16.07 15.14** Within one standard deviation of mean 67.10 66.93 One standard deviation or more above mean 16.83 17.93** Percent who have repeated a grade 1.08 1.12 Percent with parental education:
No high school diploma 10.24 11.15**
High school diploma only 51.04 48.45**
Some post secondary 13.75 14.12**
College graduate 25.00 26.28**
Percent reporting homework time
None 1.57 1.53
Less than one hour per week 25.72 24.98**
1–3 hours per week 39.65 40.15**
3–5 hours per week 16.85 17.08
5–10 hours per week 13.11 13.07
More than ten hours per week 3.10 3.19
Percent reporting home PC use
Almost every day 5.03 5.05
Once or twice a week 11.67 11.56
Once or twice a month 17.27 17.18
Hardly ever 29.35 29.64
Never 18.70 18.80
No computer at home 17.98 17.77
Percent reporting reading
No free time spent reading 6.20 6.05
30 minutes per day 45.87 44.95**
1 hour per day 25.17 26.17**
1–2 hours per day 15.24 15.32
More than 2 hours per day 7.52 7.50
Percent reporting TV use
None 4.84 4.89
Less than 1 hour per day 28.48 29.23**
2 hours per day 25.84 25.98
2 hours per day 18.64 18.78
4–5 hours per day 12.94 12.62*
6 hours or more per day 9.26 8.49**
college quality spectrum than from the high end.17This pattern reflects the fact that the largest teacher education programs in North Carolina are, by state policy, located in the state colleges, which are relatively unselective. Although North Carolina boasts the largest number of National Board Certified teachers in the country, they account for less than 4 percent of the state’s fifth grade teachers.
The characteristics of North Carolina’s 2000–20001 cohort of public school fifth grade students are summarized in Table 1b. Once again, we focus here on the charac-teristics of the full sample and postpone the discussion of the evenly balanced school subsample to Section V. Students are more racially diverse than their teachers, and the proportion of black students significantly exceeds the national average. The median student has parents with a high school diploma but no postsecondary degrees, watches between two and three hours of television per day, only rarely uses a personal com-puter at home, spends 30 minutes per day reading for pleasure, and spends one to three hours on homework per day.18Nearly four students in nine are eligible for sub-sidized lunch; and substantial numbers are rated as exceptional, whether gifted or handicapped. Relatively few students are either repeating the fifth grade or have limited English proficiency.
IV. Evidence of across- and within-school sorting
As discussed above, in the absence of purposeful intervention on the part of administrators or other officials, theory and previous empirical research sug-gest that teachers with better credentials will gravitate toward schools with more advantaged students. Table 2 provides evidence of across-school sorting in North Carolina fifth grade classrooms. The rows of the table categorize teachers in five ways, and the columns refer to average characteristics of students at the school level. The table entries are means of these averages, weighted by the number of teachers having the specified qualifications. In all cases higher entries for school characteris-tics represent higher proportions of more advantaged or higher performing students.
17. The categories were derived from information from Barron’s College Admissions Selector for 1988, based on information for first-year students in each university in 1986–87. Our category of very competitive includes universities rated as most competitive, highly competitive, or very competitive; competitive are those rated as competitive; less competitive are those rated as less competitive or noncompetitive; and the unranked category includes special programs such as art schools, international universities, or universities for which we were not able to find a rating. Barron’s uses criteria such as the median entrance examination scores, percentages of students scoring 500 and above, and 600 and above on both the math and verbal parts of the SAT or comparable scores for the ACT, percentage of students who ranked in the upper fifth or two-fifths of their high school class, and the percentage of applicants who were accepted. If information for a uni-versity was missing for 1988, we substituted the ranking for the 1979 or 1999 Selector, with the choice varying with the era in which the teacher attended college.
Clotfelter, Ladd, and Vigdor 787
Table 2
Evidence of Across-School Sorting: Characteristics of Students Taught by the Typical Teacher Having Specified Qualification, North Carolina Schools Offering Fifth Grade
Percent with Parents
Percent Not Who Are Prior
Receiving College Mean
Percent Subsidized Graduate Test Year
Teacher Qualification White Lunch Parents Score (z)
Teacher experience
0 to 1 year 58.0 51.8 22.9 −0.134
2 to 5 years 58.2 54.4 23.8 −0.072
6 or more years 62.8 54.5 23.5 0.000
Barron’s college rank
Less competitive 53.7 49.8 20.3 −0.206
Competitive 64.4 57.1 24.4 0.118
Very competitive 59.3 58.2 30.4 0.126
Not ranked 58.8 53.5 24.9 −0.047
Licensure test score
Z-score < −1 51.2 46.4 18.2 −0.306
−1 < Z-score < 1 62.9 56.0 24.3 0.054
Z-score > 1 66.2 58.4 26.8 0.158
National Board Certification
No 61.0 54.4 23.4 0.000
Yes 65.0 57.6 23.8 −0.002
Advanced degree
No 60.0 53.5 22.9 −0.043
Yes 64.9 57.8 25.2 13.8
Overall mean 61.1 54.5 23.5 0.000
Note: For teachers with a given qualification, table entries are averages of school-wide figures computed over those schools with at least one such teacher. Using F-tests, the hypothesis that student characteristics are equal across teacher qualification categories is rejected in all but the following cases: teacher experience and percent of students with parents who are college graduates; teacher National Board Certification and all four student characteristics.
Consistent with the hypothesis of positive matching, the table shows that, by most measures, teachers with better qualifications typically work in schools serving higher proportions of advantaged students.19Teachers with more experience, degrees from more highly ranked colleges, higher licensure test scores, or advanced degrees are more likely to be found in schools with higher proportions of students who are white,
not receiving subsidized lunches, have college-educated parents and who scored well on the prior year test. The only nonmonotonic patterns appear in the relationships between teacher experience and parent education, and between college rank and percent nonwhite. Nonetheless, the general pattern is clear.
Measures of within-school sorting are shown in Table 3. The rows display the same set of teacher qualifications as those shown in Table 2 and the columns refer to the Table 3
Evidence of Within-School Sorting: Classroom Characteristics for Teachers with Varying Qualifications, Relative to School, North Carolina Schools with more than One Fifth Grade Class
Percent
Percent Not with Parents Mean
Receiving Who Are Prior
Percent Subsidized College Year Test
Teacher Characteristic White Lunch Graduates Score (z)
Teacher experience
0 to 1 year 0.99 0.97 0.94* −0.050
2 to 5 years 1.01 1.00 1.00 0.004
6 or more years 1.00 1.00 1.00 0.009
Barron’s College Rank
Less competitive 1.00 1.00 0.98 −0.052*
Competitive 0.99 0.99 1.00 0.017
Very competitive 1.04 1.00 1.07 0.052*
Not ranked 0.97 0.87 1.08 −0.184
Licensure test score
Z-score < −1 0.98*** 0.98 0.94* −0.133***
−1 <Z-score <1 1.01 1.01 1.00 0.023
Z-score >1 1.01 1.00 1.08 0.075**
National Board Certification
No 1.00 1.00 0.99 −0.006
Yes 1.06 1.11* 1.23** 0.182**
Advanced degree
No 1.00 1.00 1.00 0.004
Yes 0.99 0.98 1.00 −0.011
Note: For teachers with a given qualification, table entries in the first three columns are ratios of classroom characteristics to school-wide averages. Table entries in the last column are mean differences between class-room and school-average test scores.
Clotfelter, Ladd, and Vigdor 789
20. In this and subsequent analysis, we restrict our attention to schools with more than one classroom per grade. The mean for each school characteristic in the first three columns is 1 and in the fourth column is 0. 21. We used the prior year teacher’s report in order to break any potential relationship between the errors in the current teacher’s estimates of parental education levels and the particular students she teachers. 22. In these tests, we compare the actual distribution of students in each classroom to the expected distri-bution under the hypothesis of even assignment within each grade. In other words, variation in student com-position across grades within a school does not increase the size of the chi-squared statistic. Some schools have data or multiple classrooms only for certain grades; for these schools our tests are based only on the grades with adequate data. The previous year test score and previous year attendance tests use only fourth and fifth grade data, since we have no information on test scores or school attendance prior to third grade. same student characteristics. The entries, however, now refer to the average charac-teristics of students at the classroom level relative to the school-wide average.20The clearest patterns emerge for the teachers with the lowest licensure test scores and the teachers who are National Board Certified. Teachers with the lowest test scores tend to teach in classrooms that have below-average percentages of white students and of students with college-educated parents, and they teach students with less average abil-ity as measured their prior year test scores than those in other classrooms. In contrast, teachers who are National Board Certified teach students who are more affluent, whose parents are more likely to be college graduates, and who are more able than students in other classrooms. Further evidence of this positive matching at the class-room level emerges from the observation that the least experienced teachers tend to teach in classrooms with below-average proportions of students with college-educated parents, and teachers who have degrees from the least competitive colleges tend to be in classrooms with the least able students. Thus, the net effect of within-school sort-ing is qualitatively quite similar to the effect of across-school sortsort-ing in that it tends to match the most qualified teachers with the most able students.
To investigate the extent of within-school sorting more formally, we conducted a series of χ2tests using 1,160 North Carolina elementary schools with at least two fifth grade classrooms in 2000–2001. We conducted up to six tests in each school to exam-ine whether students’ classroom assignments are statistically independent of a set of six student characteristics: gender, race, participation in the Federal subsidized school lunch program, whether the student attended the same school in the previous year, the student’s prior year test score (with categories being above or below the state aver-age), and the prior year teacher’s report of parental education.21The null hypothesis in each test is that students were assigned randomly across classrooms within the school with respect to the specified characteristic.
Table 4
Summary of Chi-Squared Tests of Random Assignment of Students Across Fifth Grade Classrooms Within Elementary Schools
Number of Tests Failed Number of Schools Percent of Schools
0 of 6 521 44.9
1 of 6 326 28.1
2 of 6 163 14.1
3 of 6 75 6.5
4 of 6 41 3.5
5 of 6 14 1.2
6 of 6 0 0.0
Total 1,160 100.0
Note: This table reports the results of Chi-squared tests of the null hypothesis that students are randomly dis-tributed across classrooms within schools along six different observable student characteristics: race, gender, subsidized lunch receipt, parental education, previous year test score, and previous year school attendance. The tests are based on data on the composition of classes for up to three grades in each school; significance is based on the 10 percent level. See text for further details.
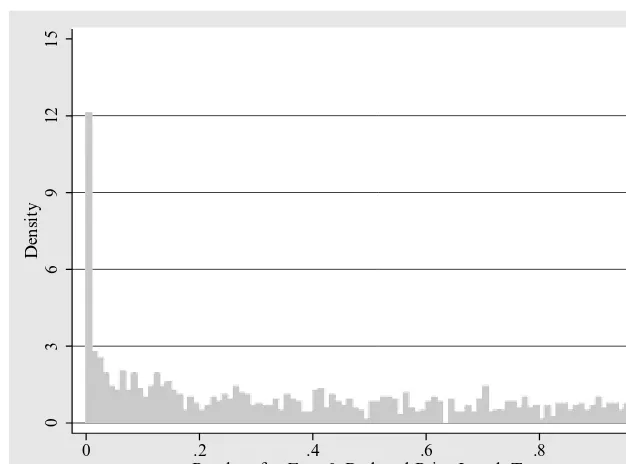
As shown in Table 4, in 521 out of the 1,160 schools we failed to reject the null hypothesis of random assignment for all six of our tests.23 Figure 1 displays the distribution of p-values for the parental education test for all the schools in the sample. The tests for about 6 percent of these schools exhibit p-values less that 1 percent, indicating particularly extreme departures from a random distribution of students by parental education. Beyond the 10 percent level, and particularly beyond the 15 percent level, however, the p-values display a nearly uniform distri-bution, with close to 1 percent of all p-values in each band of width 0.01. This sug-gests that a relatively small number of schools are responsible for a large share of the systematic sorting made apparent in Table 3.
Figures 2 and 3 show the distributions of p-values from the χ2tests for students by race and subsidized lunch status. The near uniform distribution of the p-values for the racial composition test suggests that only a very small fraction of North Carolina schools systematically segregate students by race within schools. At the same time, only a small mass of points emerge with p-values very close to one, indicating that few if any schools perfectly balance the racial composition of all classrooms. That pattern is consistent with prior findings of low racial segregation across classrooms within ele-mentary schools (Morgan and McPartland 1981 and Clotfelter, Ladd, and Vigdor 2003). The pattern of p-values is less uniform for the free and reduced lunch status of
0
036
Density
91
2
1
5
.2 .4 .6
P-values for Parental Education Test
.8 1
Figure 1
Distribution of p-values for parent education chi-squared tests
0
036
Density
91
2
1
5
.2 .4 .6
P-values for Race Test
.8 1
Figure 2
0
036
Density
91
2
1
5
.2 .4 .6
P-values for Free & Reduced Price Lunch Test
.8 1
Figure 3
Distribution of p-values for subsidized lunch chi-square tests
24. Although it would be interesting to explore the reasons that schools differ in the apparent randomness of their classroom assignments, observable indicators show little relation with assignment patterns. Tables 1a and 1b show that the nonrandom schools on average have slightly higher shares of black teachers and black, poor, and low-achieving students, compared to apparently random schools. Other than these relatively small differences, it is possible only to speculate that, for one reason or another, principals in the nonrandom schools are simply more open to parental suggestions regarding classroom assignments than are principals in the apparently random schools.
students. This measure of student socioeconomic status is actually the strongest pre-dictor of separation across classrooms in North Carolina, yet only a small fraction of schools show evidence of systematic separation by this variable.24We return to the sample of schools that failed none of the six tests in our modeling effort below.
V. Estimating the effect of teacher qualifications on
student achievement
that the actual distribution of teachers in North Carolina is far from random across schools, and that at least some schools systematically assign teachers to classrooms with significantly different characteristics. As a result, the estimation strategy must be more complex and must explicitly account for the nonrandom distribution of teach-ers. The goal is to approximate the results that would emerge from a truly random experiment.
Our strategy for estimating the effects on teacher qualifications on student achieve-ment in the presence of across-school and within-school sorting has three main com-ponents. First is the use of a rich set of student-level control variables that includes both the demographic characteristics of students and their survey responses about the time they spend watching TV, reading, and doing homework. To the extent these char-acteristics are correlated with both achievement and teacher credentials, including them will ameliorate omitted variable bias. Second is the addition of school fixed effects. These fixed effects imply that coefficients are identified on the basis of varia-tion in teacher qualificavaria-tions across classrooms within each school, eliminating any bias associated with across-school sorting. Third, we restrict the sample to the set of schools that, based on the χ2tests just discussed, have distributed students across classrooms in a way that balances observable student characteristics. Because any bias associated with nonrandom matching within schools is likely to be most severe in schools that show evidence of a departure from even balancing, restricting the sample in this way will reduce if not eliminate it.
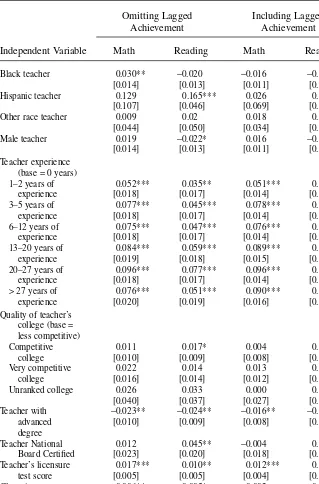
As a benchmark for analyzing the impact of sorting on estimates of teacher cre-dential effects, the first two columns of Table 5 present a very simple descriptive spec-ification. Fifth grade math and reading test scores, standardized in each regression to have mean 0 and standard deviation one, are estimated as a function solely of teacher characteristics, as well as class size. The absence of control variables means that the estimated effects should be interpreted as associations, not as causal relationships.
The table indicates that many teacher characteristics, including both demographic characteristics and qualifications, exhibit strong and statistically significant partial correlations with student achievement. Relative to white teachers (the omitted racial category) black teachers and teachers of other races teach students with significantly lower test scores. Similarly, relative to female teachers, male teachers teach students with lower math and reading scores. The relationship between student achievement and teacher experience is nonlinear, with the peak occurring in those classrooms with teachers having between 13 and 26 years of experience; novice teachers (the omitted base category) are associated with the lowest test scores. Teachers with degrees from less competitive institutions teach students with significantly lower test scores, and teachers with advanced degrees show a slight but insignificant tendency to teach stu-dents with higher test scores. Higher licensure test scores are associated with higher-test scores. Finally, class size is a significant positive predictor of higher-test scores, which could reflect efforts on the part of school administrators to put low-performing students in smaller classes as in Lazear (2001).
The other four regressions in Table 5 reflect the addition of student-level covariates to the basic specification. The third and fourth regressions include controls for student gender, race, subsidized lunch receipt, parental education, time spent watching televi-sion, reading for pleasure, using a computer, and doing homework, but not for the
The Journal of Human Resources
Table 5
Basic Estimates of Teacher Qualification Effects, with and without Student Controls
Including Student Covariates
Omitting Lagged Including Lagged
No Student Covariates Achievement Achievement
Independent Variable Math Reading Math Reading Math Reading
Black teacher −0.248*** −0.244*** 0.061*** −0.059*** −0.019 −0.016
[0.026] [0.025] [0.017] [0.015] [0.014] [0.011]
Hispanic teacher 0.181 0.284* 0.069 0.062 −0.06 0.072
[0.141] [0.151] [0.101] [0.066] [0.070] [0.046]
Other race teacher −0.243*** −0.294*** 0.134*** −0.181*** −0.051 −0.097**
[0.081] [0.080] [0.049] [0.048] [0.043] [0.045]
Male teacher −0.057** −0.090*** 0.007 −0.031** 0.004 −0.034***
[0.027] [0.025] [0.019] [0.016] [0.014] [0.012]
Teacher experience (base = 0 years)
1–2 years of experience 0.060* 0.046 0.029 0.017 0.058*** 0.046***
[0.035] [0.032] [0.023] [0.020] [0.019] [0.015]
3–5 years of experience 0.108*** 0.081** 0.074*** 0.049** 0.082*** 0.055***
[0.035] [0.032] [0.023] [0.020] [0.018] [0.015]
6–12 years of experience 0.170*** 0.142*** 0.084*** 0.064*** 0.086*** 0.067***
[0.034] [0.030] [0.022] [0.019] [0.018] [0.014]
13–20 years of 0.181*** 0.178*** 0.085*** 0.085*** 0.077*** 0.078***
experience [0.035] [0.032] [0.023] [0.020] [0.018] [0.015]
20–27 years of 0.179*** 0.172*** 0.086*** 0.086*** 0.093*** 0.091***
Clotfelter
, Ladd, and V
igdor
795
> 27 years of experience 0.160*** 0.147*** 0.094*** 0.081*** 0.104*** 0.092***
[0.039] [0.035] [0.026] [0.023] [0.021] [0.017]
Quality of teacher’s college (base = less competitive)
Competitive college 0.083*** 0.097*** 0.01 0.026*** 0.000 0.014*
[0.018] [0.016] [0.012] [0.010] [0.009] [0.007]
Very competitive college 0.123*** 0.111*** 0.028 0.025 0.024 0.017
[0.031] [0.029] [0.019] [0.017] [0.015] [0.013]
Unranked college −0.018 0.019 −0.023 0.003 −0.032 −0.003
[0.094] [0.096] [0.053] [0.048] [0.041] [0.043]
Teacher with advanced 0.010 0.015 −0.028** −0.023** −0.028*** −0.023***
degree [0.020] [0.018] [0.013] [0.011] [0.010] [0.008]
Teacher National Board 0.026 0.035 0.004 0.018 0.008 0.024
Certified [0.047] [0.041] [0.031] [0.022] [0.024] [0.016]
Teacher’s licensure 0.060*** 0.048*** 0.023*** 0.015*** 0.018*** 0.011**
Test score [0.010] [0.009] [0.007] [0.006] [0.005] [0.004]
Class size 0.017*** 0.018*** −0.001 0.001 −0.002 0
[0.003] [0.002] [0.002] [0.001] [0.001] [0.001]
Student covariates No No Yes Yes Yes Yes
Lagged student No No No No Yes Yes
achievement controls
Observations 68,421 68,071 61,509 61,242 60,656 60,502
R2 0.027 0.026 0.484 0.449 0.724 0.687
student’s prior year test score.25 The addition of these control variables alters the coefficients of the teacher characteristics in ways that are consistent with the phe-nomenon of positive matching. The difference between black and white teachers is greatly reduced, and the negative coefficient on teachers of “other race” has been reduced in the equation for reading and reversed in sign for math. The estimated impact of male teachers on reading scores is reduced by two-thirds in reading and is indistinguishable from 0 for math. The coefficients on the teacher experience vari-ables continue to be largely significant, and the peak continues to occur among highly experienced teachers, but the magnitude of the relationships have declined apprecia-bly. Teachers graduating from less competitive colleges continue to be associated with lower-performance in reading, and those with lower licensure test scores are associ-ated with lower scores in both areas, but the magnitudes of these effects decline as well. Point estimates of class size effects continue to be positive, but the magnitudes are at most one-fifth the level of the initial estimates.26
The final pair of regressions in Table 5 adds a single control variable for each student: the student’s fourth grade test score. As we noted earlier, lagged test scores are usually included in achievement models to account for the cumulative nature of the education process. When error terms are serially correlated, however, the inclusion of a lagged dependent variable can lead to biased and inconsistent coefficient estimates, with the sign and magnitude of the bias depending on the direction of serial correlation.27
Given certain conditions, however, estimates of the effects of teacher qualifications on student achievement will be unbiased under either specification. The conditions are that the teacher qualifications be uncorrelated with both past values of observable char-acteristics and the error term, conditional on other observed variables. These condi-tions would be clearly met if teachers were randomly assigned to students. In such a scenario, teacher credentials are uncorrelated with observed and unobserved student characteristics, both past and present. An empirical test for whether our regression esti-mates mirror those that would be obtained from a random assignment trial, then, is
25. Because time spent on homework may be endogenously determined by teacher behavior, we have also estimated models that exclude the homework variables. The results are similar except that the estimated effects of teacher experience are all somewhat larger than in equations that omit the behavioral variables. Coefficients on student characteristics, derived from the regressions reported in Table 6, appear as Appendix Table A1. Student characteristic coefficients derived from other specifications are available from the authors upon request.
Our sample size declines by roughly 7,000 students in each regression that adds student covariates, owing primarily to missing data on subsidized lunch receipt. Results estimated on a constant set of students across specifications yield qualitatively identical results.
26. It is worth noting that the addition of student covariates has much the same effect in models with school fixed effects: the model without student covariates exhibits consistently larger estimated teacher effects. The implication is that positive matching within schools is at work, thus imbuing estimated teacher characteris-tics with unwarranted impact, owing to omitted variable bias.
whether the estimated coefficients are sensitive to the inclusion of a lagged dependent variable.28
Comparing the final two columns of Table 5 with the previous two indicates sig-nificant differences between models that do or do not include lagged student test scores and, hence, that we have not yet estimated unbiased causal effects of teacher characteristics. For example, the fact that the addition of the lagged dependent achievement variable causes the large negative effect of being a black teacher to dis-appear provides evidence that the other control variables are not sufficient to break the correlation between being a black teacher and being assigned to low performing students. Other differences have similar interpetations.
Fortunately, the unusually detailed character of our data, which makes it possible for us to match teachers and students at the classroom level, allows us to incorporate school fixed effects into our achievement regressions (see Table 6). The inclusion of these school fixed effects means that the coefficients of teacher characteristics in that table are estimated based only on the within-school variation in teacher characteris-tics, thereby eliminating any remaining bias associated with the nonrandom sorting of teachers and students across schools (but not within schools).29
Two clear patterns emerge from Table 6. First, introducing school fixed effects drives most of the effects of qualifications down, even relative to the attenuated lev-els observed in the final columns of Table 5.30Nonetheless, many of them remain sta-tistically significant. Second, the two sets of estimates of the effects of teacher qualifications—those from the models with and without the lagged achievement vari-able—converge. The high degree of concordance of results across specifications gives us confidence that we now have obtained relatively unbiased estimates of the effects of teacher qualifications.
As displayed in Table 6, statistically significant positive effects on student achieve-ment emerge for teacher experience (for both math and reading), teacher test scores (most clearly for math) and National Board Certification (for reading only). Compared to students assigned to teachers with no prior experience, students assigned to highly experienced teachers attain standardized reading and math test scores roughly tenth of a standard deviation higher in math and slightly less than
one-Clotfelter, Ladd, and Vigdor 797
28. As with tests of over identifying restrictions in instrumental variable estimation, this check focuses on a necessary but not sufficient condition. (Hausman 1978).
29. There may be some concern that our use of school fixed effects biases estimates of teacher credential effects downward. Such a bias would occur, for example, if school administrators had access to superior information on teacher quality and hired teachers of uniform quality. In such a scenario, observed differences in teacher characteristics across classrooms within a school would be offset by opposite differences in unob-served components of quality. While we suspect that such a bias is not likely to be empirically noteworthy, readers with differing opinions may wish to consider our estimates in Tables 6 and 7 as lower bounds for the true effect of teacher credentials on student test scores. The estimates in Table 5 would then serve as upper bounds.
Table 6
Effects of teacher qualifications, with school fixed effects, full sample
Omitting Lagged Including Lagged
Achievement Achievement
Independent Variable Math Reading Math Reading
Black teacher 0.030** −0.020 −0.016 −0.007 [0.014] [0.013] [0.011] [0.010] Hispanic teacher 0.129 0.165*** 0.026 0.052 [0.107] [0.046] [0.069] [0.045] Other race teacher 0.009 0.02 0.018 0.022
[0.044] [0.050] [0.034] [0.030] Male teacher 0.019 −0.022* 0.016 −0.023**
[0.014] [0.013] [0.011] [0.009] Teacher experience
(base = 0 years)
1–2 years of 0.052*** 0.035** 0.051*** 0.035*** experience [0.018] [0.017] [0.014] [0.013] 3–5 years of 0.077*** 0.045*** 0.078*** 0.046***
experience [0.018] [0.017] [0.014] [0.013] 6–12 years of 0.075*** 0.047*** 0.076*** 0.051***
experience [0.018] [0.017] [0.014] [0.013] 13–20 years of 0.084*** 0.059*** 0.089*** 0.065***
experience [0.019] [0.018] [0.015] [0.014] 20–27 years of 0.096*** 0.077*** 0.096*** 0.079***
experience [0.018] [0.017] [0.014] [0.013] > 27 years of 0.076*** 0.051*** 0.090*** 0.067***
experience [0.020] [0.019] [0.016] [0.014] Quality of teacher’s
college (base = less competitive)
Competitive 0.011 0.017* 0.004 0.008
college [0.010] [0.009] [0.008] [0.007]
Very competitive 0.022 0.014 0.013 0.002
college [0.016] [0.014] [0.012] [0.011]
Unranked college 0.026 0.033 0.000 0.011 [0.040] [0.037] [0.027] [0.032] Teacher with −0.023** −0.024** −0.016** −0.018***
advanced [0.010] [0.009] [0.008] [0.007]
degree
Teacher National 0.012 0.045** −0.004 0.030*
Board Certified [0.023] [0.020] [0.018] [0.016] Teacher’s licensure 0.017*** 0.010** 0.012*** 0.005 test score [0.005] [0.005] [0.004] [0.004]
Class size 0.006** 0.005* 0.002 0.001
[0.003] [0.003] [0.002] [0.002]
Student covariates Yes Yes Yes Yes
tenth of a standard deviation in reading.31About half of this gain occurs for the first one or two years of teaching. After that point the experience-test score profile flattens considerably, with the peak occurring in the 20–27 year category in all four specifi-cations. Students assigned to teachers with higher licensure test scores apparently do better in math, but the effect is relatively modest. A one-standard-deviation increase in teacher test score implies at most a 0.017 standard deviation increase in average student math test scores and a somewhat smaller increase in reading scores. Students assigned to National Board Certified teachers score on average 0.030–0.045 standard deviations higher in reading, but no higher in math.32
The estimated impact of the quality of the teacher’s college is uniformly small and in general is not statistically significant. The most surprising result is the consistently neg-ative effect of a master’s degree on student achievement. The coefficients suggest that, all else constant, teachers with master’s degrees are less effective than those without.33
Clotfelter, Ladd, and Vigdor 799
Table 6 (continued)
Omitting Lagged Including Lagged
Achievement Achievement
Independent Variable Math Reading Math Reading
Lagged student No No Yes Yes
achievement controls
Observations 61,509 61,242 60,656 60,502
R2 0.538 0.486 0.756 0.707
Note: standard errors, in square brackets, have been corrected for within-classroom clustering. *, **, and *** denote significance at the 10 percent, 5 percent and 1 percent levels. Demographic controls include gender, race, and free/reduced price lunch status. Extended set of controls includes categorical measures of computer use, time spent free reading, time spent watching TV, parental education, and time spent on homework.
31. In a model applying student and school fixed effects estimated for fourth through seventh graders Rivkin, Hanushek, and Kain (2005, pp. 444–45) find that novice teachers were associated with math achieve-ment gains of 0.103 standard deviations below those for teachers with six or more years of experience; for reading the novice deficit was 0.045 standard deviations. Rockoff (2004) finds the difference in reading scores between teachers with 0 and ten years to be about 0.17. Our findings for 0 versus 6–12 years of 0.085 and 0.064 for math and reading, respectively, are in this general range.
32. These results may appear to conflict Goldhaber and Anthony (forthcoming), which is generally cited as a study finding significant positive effects of National Board Certification. A close reading of that article, however, reveals that no direct conflict exists. The Goldhaber and Anthony study finds that teachers who are destined to become National Board Certified in the futureare most effective, and find no significant evidence that teachers who became certified in the past—the only group flagged in our analysis—are more or less effective than teachers who never applied for certification. Goldhaber and Anthony also focus on older North Carolina data, from the late 1990s.
In contrast to the teacher qualification variables, the coefficients of the teacher race variables in Table 6 continue to exhibit substantial variation across the specifications with and without controls for lagged student achievement. Because fixed effects for schools are included, the difference in coefficients only can be attributable to nonran-dom assignment of teachers across classrooms within schools. In particular, it appears that black teachers tend to teach the lower performing math students within schools. Evidence for that conclusion emerges from that fact that once prior year performance is included in the equations, the coefficient for black teachers is closer to 0 and not statistically significant.
Analogously, the fact that the inclusion of the lagged achievement score eliminates the statistically significant positive effect of class size that appears in Columns 1 and 2 suggests that, consistent with Lazear’s (2001) theoretical prediction, low performing students may be disproportionately placed in smaller classes within schools. The absence of class size effects in Columns 3 and 4 does not mean that class size is irrel-evant for student achievement. Instead it simply means that once we use school fixed effects to focus on differences within a school, we do not observe sufficient variation in class sizes to estimate an effect. This methodology is thus far better suited to mea-suring the effects of teachers, which do indeed vary quite significantly within schools, than to measuring class size effects.34
Although we have a good bit of confidence in the estimated effects of teacher cre-dentials that emerge from Table 6, these equations still might not fully address the bias that arises from within-school sorting. To address that source of bias, we restrict the sample to the schools in which students were assigned to classrooms in a balanced manner, namely the schools that failed none of the six χ2tests for random assignment of students. While it is still possible for there to be some form of nonrandom selec-tion into classrooms in these schools, any such selecselec-tion would have to be along a dimension uncorrelated with any of the six characteristics used in our tests.35If noth-ing else, the probability of selection on unobservables should be significantly lower in schools that do not also feature selection on unobservables.
Tables 1a and 1b compare summary statistics for the overall sample and this evenly balanced school subsample, which includes roughly 40 percent of the full set of stu-dents. In general, the characteristics of teachers and students in the balanced school subsample are quite similar to those in the full sample. With respect to the character-istics of teachers, only the racial charactercharacter-istics differ between the two samples, with the share of white teachers in the balanced school subsample being about two per-centage points higher than the share in the full sample (Table 1a).
get a master’s degree would be desirable. One interpretation of these results is that the financial incentives to get a master’s degree that are embedded in the single salary schedule represented wasted money except insofar as they keep some teachers in the profession so that students can benefit from their experience. 34. By way of comparison, we estimated a school fixed effects model comparable to those in Table 6 using gains in achievement rather than the lagged dependent form. Except for differences in the first experience term (a larger effect for math and a smaller one for reading) and a large and significant positive effect for other race teachers, the estimated effects in the achievement gain model were generally close to those in the lagged achievement model.
Clotfelter, Ladd, and Vigdor 801
With respect to the two sets of students, a larger number of statistically significant differences emerge, as shown in Table 1b. The students in the balanced school sub-sample are on average somewhat more advantaged, in the sense of being more white and have higher prior year test scores and parents with more education than those in the full sample. Still, the differences between the two samples are generally quite small in magnitude.
Table 7 shows the results of regression specifications identical to those in Table 6, including school fixed effects and student-level covariates, estimated on the balanced school subsample. Although the smaller sample generates somewhat larger standard errors and hence coefficients that are somewhat less precisely estimated, the patterns and estimated coefficients are quite similar to those obtained with the full sample. These findings provide added support for our previous conclusions about the effects of teacher credentials. The factors associated with higher student test scores in the full sample, namely teacher experience and teacher licensure test scores, continue to be significant predictors of achievement, with estimated magnitudes that are similar across the two samples. As with the full sample, the difference in test scores between students with novice teachers and those highly experienced teachers is roughly one-tenth of a standard deviation, with a large portion of these returns to experience occur-ring within the first few years of teaching. These experience effects are in the range of those found in other studies employing similar data, but smaller than the largest estimates.36In addition, a one-standard deviation increase in a teacher’s licensure test score now predicts a 0.012 standard deviation in student achievement in math.
In both Tables 6 and 7, coefficients exhibit a tendency to be higher when controls for lagged test scores are introduced as explanatory variables. In Table 7, the higher coefficients are somewhat troubling as they suggest that lagged test scores are corre-lated with teacher characteristics even in schools that appear to be evenly balanced. Note, however, that the fact that the coefficients are larger rules out the possibility of positive matching in evenly balanced schools. Instead they suggest that teachers with better credentials in these schoools are being assigned to less able students. If any-thing, then, the coefficients we report here are biased toward 0—the opposite of the typical concern in studies of this nature.37
36. See Footnote 31, above, for a discussion of estimates found in existing literature.
37. To provide further evidence along these lines, we estimated models analogous to those in Table 7 for the set of schools that failedone or more tests for random assignment—that is, the set of schools excluded from Table 7. These estimates are shown in Appendix Table A2. Comparing specifications with and without lagged achievement test scores reveals substantial evidence of bias associated with positive matching in this sample. The majority of teacher experience coefficients, for example, decline upon introduction of the lagged dependent variable.
We also estimated identical specifications using the set of schools where we uniformly failed to reject the null hypothesis of random assignment using the 20 percent significance level. Whereas the original 10 per-cent criterion produced a sample about 40 perper-cent as large as the full sample, the 20 perper-cent criterion yielded one slightly smaller than one-fourth the original size. Results, shown in Appendix Table A3, show the same pattern of increasing upon introduction of lagged achievement controls shown in Table 7. The typical coef-ficient increase is smaller, however, suggesting that further increases in stringency would produce more complete convergence of coefficients across specifications.
Table 7
Effects of Teacher Qualifications, with School Fixed Effects; Evenly Balanced School Subsample
Omitting Lagged Including Lagged
Achievement Achievement
Independent Variable Math Reading Math Reading
Black teacher 0.021 −0.009 −0.008 0.005
[0.022] [0.020] [0.018] [0.016]
Hispanic teacher 0.098 0.056 −0.084 0.057
[0.113] [0.070] [0.094] [0.059]
Other race teacher 0.058 0.042 −0.054 0.042
[0.068] [0.056] [0.057] [0.042] Male teacher 0.012 −0.022 −0.006 −0.011 [0.022] [0.018] [0.018] [0.013] Teacher experience
(base = 0 years)
1–2 years 0.049** 0.001 0.066*** 0.017 experience [0.023] [0.022] [0.020] [0.017] 3–5 years 0.078*** 0.035 0.080*** 0.035*
experience [0.025] [0.022] [0.021] [0.018] 6–12 years 0.055** 0.034 0.085*** 0.064***
experience [0.025] [0.022] [0.020] [0.018] 13–20 years 0.081*** 0.037 0.113*** 0.073***
experience [0.026] [0.024] [0.022] [0.019] 20–27 years 0.084*** 0.064*** 0.101*** 0.080***
experience [0.024] [0.022] [0.021] [0.018] > 27 years 0.108*** 0.070*** 0.130*** 0.095***
experience [0.028] [0.024] [0.023] [0.020] Quality of teacher’s
college (base = less competitive)
Competitive college −0.011 0.01 −0.013 0.006
[0.014] [0.012] [0.012] [0.010]
Very competitive −0.023 −0.002 −0.005 0.009
college [0.024] [0.019] [0.020] [0.014]
Unranked college −0.022 0.072 −0.067* 0.027
[0.058] [0.053] [0.039] [0.041] Teacher with advanced −0.023 −0.009 −0.023** −0.007
degree [0.014] [0.013] [0.012] [0.010]
Teacher National −0.044 −0.004 −0.035 0.005
Board Certified [0.032] [0.025] [0.028] [0.023] Teacher’s licensure 0.012* 0.001 0.012* 0.002 test score [0.007] [0.007] [0.006] [0.006]
Class size 0.008 0.003 0.006 0.002
[0.005] [0.005] [0.004] [0.003]
Student covariates Yes Yes Yes Yes
Clotfelter, Ladd, and Vigdor 803
VI. Differential effects by type of student
How teachers are distributed among schools and across classrooms within schools relative to students clearly affects the distribution of student achieve-ment. One final question is whether it also affects the average level of achieveachieve-ment. The answer to this question hinges on the existence of nonlinearities in the relation-ship between teacher characteristics and student achievement.38 To this point, our regression estimates have maintained the assumption that the effects of teacher qual-ifications do not vary systematically across types of students. Table 8 summarizes the results of regression specifications that relax this assumption by interacting the full set of teacher characteristics with particular student characteristics, including subsi-dized lunch receipt, parent education, and prior year achievement.39The regressions are estimated on the sample of North Carolina elementary schools with evenly bal-anced classroom assignment patterns, using covariates identical to those employed in Table 7 (continued)
Omitting Lagged Including Lagged
Achievement Achievement
Independent Variable Math Reading Math Reading
Lagged student achieve- No No Yes Yes
ment controls
Observations 25,147 25,045 24,768 24,711
R2 0.553 0.496 0.766 0.708
Note: standard errors, in square brackets, have been corrected for within-classroom clustering. *, **, and *** denote significance at the 10 percent, 5 percent and 1 percent levels. Demographic controls include gender, race, and free/reduced price lunch status. Extended set of controls includes categorical measures of computer use, time spent free reading, time spent watching TV, parental education, and time spent on homework. Sample is restricted to the 521 elementary schools for which chi-square tests fail to reject the hypothesis of random assignment along six dimensions: race, gender, parent education, prior year test score, whether a stu-dent attended the same school in the previous year, and free/reduced price lunch receipt.
38. The answer to this question is also sensitive to the measurement of student achievement scores. Indeed, by testing for nonlinear effects on achievement we are assuming that we have identified a valid measure of achievement and are measuring it linearly. Nonlinear but monotonic transformations of our achievement test scores may be equally valid measures of achievement but also may yield very different conclusions regard-ing the existence of nonlinear effects. We proceed with this exercise under the presumption that the scale of our achievement measure is an important one for policy purposes—it is used by the State of North Carolina for the purpose of gauging progress in schools, and applying positive and negative sanctions to schools and their staff (Clotfelter et al. 2004).
The Journal of Human Resources
Table 8
Do teacher qualification effects vary across students?
Free/reduced Price Parent Education: Fourth Grade Test Score:
Student Characteristics Lunch: No = 1 High =1 above Average = 1
Teacher Credentials Math Reading Math Reading Math Reading
Black teacher −0.019 0.002 −0.041* 0.002 −0.038 −0.013
[0.023] [0.026] [0.023] [0.028] [0.028] [0.032]
Hispanic teacher −0.059 −0.016 −0.084 −0.102 −0.221** −0.234***
[0.097] [0.200] [0.085] [0.163] [0.060] [0.109]
Other race teacher −0.065 0.009 −0.178** −0.091 0.071 0.164
[0.061] [0.102] [0.078] [0.072] [0.081] [0.111]
Male teacher 0.010 0.010 0.014 −0.022 0.020 0.013
[0.029] [0.029] [0.024] [0.026] [0.031] [0.035]
Teacher experience (base is no experience)
1–2 years 0.021 0.012 0.039 −0.016 0.021 −0.039
[0.032] [0.038] [0.029] [0.036] [0.037] [0.042]
3–5 years 0.038 0.050 0.033 −0.043 0.057 −0.041
[0.032] [0.036] [0.029] [0.034] [0.036] [0.039]
6–12 years 0.015 0.018 0.041 −0.011 0.042 −0.055
[0.029] [0.035] [0.028] [0.033] [0.035] [0.038]
13–20 years 0.030 0.020 0.055* −0.026 0.026 −0.091
Clotfelter
, Ladd, and V
igdor
805
20–27 years 0.062** −0.003 0.083*** −0.028 0.053 −0.052**
[0.030] [0.036] [0.029] [0.035] [0.036] [0.041]
> 27 years 0.063* 0.054 0.068** −0.004 0.046 −0.012
[0.034] [0.040] [0.034] [0.037] [0.042] [0.042]
Quality of undergraduate institution (base is less competitive college)
Competitive college 0.022 −0.017 0.015 −0.014 0.048** 0.030
[0.016] [0.017] [0.016] [0.017] [0.019] [0.021]
Very competitive college −0.021 −0.019 −0.003 0.002 −0.027 −0.019
[0.029] [0.027] [0.028] [0.025] [0.031] [0.033]
Unranked college 0.163*** 0.019 0.095* −0.013 0.111* 0.031
[0.061] [0.064] [0.049] [0.056] [0.061] [0.077]
Teacher National Board 0.040 0.001 −0.027 0.029 −0.031 0.001
Certified [0.035] [0.048] [0.032] [0.041] [0.054] [0.063]
Teacher with advanced 0.010 0.003 0.009 0.004 −0.005 0.026
degree [0.017] [0.018] [0.018] [0.018] [0.021] [0.021]
Teacher’s licensure 0.002 −0.002 0.003 −0.014 0.016 0.014
test score [0.009] [0.009] [0.009] [0.009] [0.011] [0.012]
N 24,768 24,711 24,970 24,912 25,147 25.045
R2 0.766 0.708 0.765 0.707 0.654 0.590