Environmental Tax Reform and Producer
Foresight: An Intertemporal Computable
General Equilibrium Analysis
Brita Bye, Statistics Norway, Research Department
This article analyzes the nonenvironmental welfare costs of an environmental tax reform using a numerical intertemporal general equilibrium model for the Norwegian economy. By exploiting existing tax wedges in the labor market and between consumption and saving, the total nonenvironmental welfare effect of the tax reform is positive. The article also analyzes how imperfect price expectations for the investors in real capital influence the total welfare costs of the tax reform. The welfare effect is the same due to exploitation of initial distortions, but the transitional dynamics are quite different in the two paths. 2000 Society for Policy Modeling. Published by Elsevier Science Inc.
Key Words: Dynamic general equilibrium analysis; Environmental tax reforms; Imper-fect expectations.
1. INTRODUCTION
By increasing environmental taxes to curb pollution and using the revenues to cut distortionary taxes on income, it may be possible to obtain a “double dividend,” i.e., not only a better environmental standard, but also a less distortionary tax system, thereby improving economic welfare. Goulder (1994) and Chris-tiansen (1996) discuss different interpretations and definitions of the term “double dividend,” and give an overview of the literature. In recent years there has been increasing concern about the potential contributions of carbon dioxide (CO2) emissions to the
greenhouse effect and global climate change. A carbon tax, a tax
Address correspondence to Brita Bye, Statistics Norway, Research Department, P.O. Box 8131 Dep., N-0033 Oslo, Norway.
I am grateful to Erling Holmøy and Diderik Lund for useful suggestions and comments on earlier drafts, and to Birger Strøm for excellent computer assistance. The Norwegian Research Council has provided financial support through the SAMMEN program.
Received March 1997; final draft accepted December 1997.
Journal of Policy Modeling22(6):719–752 (2000)
on fossil fuels—coal, oil, crude oil and natural gas—in proportion to their carbon content, will internalize these externalities associ-ated with fossil fuel combustion. It is clear that the introduction of a carbon tax combined with changes in other taxes will, through their effects on prices and costs, have long-term welfare effects through changing the rate of capital accumulation and economic growth. Hence, the suitable model framework is intertemporal general equilibrium models that generate optimal consumption-savings paths. Intertemporal general equilibrium analyses of such environmental tax reforms for the United States are presented in Jorgenson and Wilcoxen (1993), Goulder (1995), and Bovenberg and Goulder (1995).
Recent Norwegian analyses of environmental tax reforms as Brendemoen and Vennemo (1994), Ha˚konsen and Mathiesen (1995), and Mathiesen (1996),1 are all based on static general
equilibrium models with exogenous stocks of real and financial capital. Hence, these analyses only consider reallocation effects of the tax reforms, given the resource constraints, and do not consider the effects of the tax reforms on the accumulation of real and financial capital. In addition the models allow for terms of trade gains from domestic tax increases, a property that is much criticized (see, e.g., Norman, 1990). There is a need for additional analyses that take into consideration the dynamic effects of envi-ronmental tax reforms and where the tax reforms do not give rise to terms of trade gains. The analyses by Jorgenson and Wilcoxen (1993), Goulder (1995), and Bovenberg and Goulder (1995) all use intertemporal models, but a small open economy as the Norwegian behaves and reacts differently under tax reforms, compared to a large economy as the U.S. This demands another model specifica-tion that implies that analyses on the Norwegian economy will give additional insight into measuring and interpreting the effects of environmental tax reforms. Compared to these U.S. analyses, the small open economy framework implies that the interest rate and prices on export are given in the world market. The assump-tion of internaassump-tionally mobile capital implies that net savings in financial capital may be uncorrelated with net investment in real capital. In addition, the tax rates in Norway are generally higher. The marginal excess burden of labor taxation is especially high (see Brendemoen and Vennemo, 1996). All these elements may
ENVIRONMENTAL TAX REFORM 721
contribute to give other welfare implications of environmental tax reforms than the above cited U.S. analyses. The analysis in this paper is also based on the tax system of the 1992 tax reform,2
which especially implied approximate neutrality between the taxa-tion of real and financial capital, and lower average marginal tax rate on wage income.
This paper analyzes the total nonenvironmental welfare costs of an increase in the carbon tax combined with a reduction in the payroll tax by using an intertemporal disaggregated general equilibrium model for the Norwegian economy. The model pic-tures a small open economy because the domestic producers and consumers are assumed to be price takers in the world market, and the interest rate is exogenously given from international financial markets. But the producers are assumed to execute some market power in the domestic market.
The total welfare effect of the tax reform measured as the change in total discounted utility from a reference path, is positive, due to exploitation of existing tax wedges, especially in the labor market and between consumption and saving. This paper also examines whether the welfare effect is sensitive to expectation formation. The welfare gain is approximately the same with imper-fect expectations equal to unchanged expectations from the refer-ence path, but the transitional paths are quite different in the two simulations. The reason for these differences is the negative effect of the tax reform on the domestic producer prices, implying nega-tive capital gains in the user cost of capital along the transitional path with perfect foresight, while the negative capital gains are absent with unchanged expectations. This initializes reallocation of saving from financial to real capital along the path, increasing net foreign debt, which induces a welfare loss. This negative effect is though outweighed by the positive welfare effect of higher employment, especially in the announcement period, but also in the stationary solution.
The paper is organized as follows: Section 2 gives some com-ments on the literature concerning the double dividend hypothesis and the possibilities for obtaining welfare gains through environ-mental tax reforms. Section 3 describes the model framework, data, and important parameter values. In Section 4, the simulations of the environmental tax reform are presented and interpreted,
including the simulation with imperfect expectations. Section 5 concludes.
2. TAX REFORMS AND THE DOUBLE DIVIDEND HYPOTHESIS
The recent literature on environmental taxation and the double dividend in a second-best economy with other distortionary taxes and a revenue requirement, gives, in general, little support for the double dividend hypothesis (see, e.g., Bovenberg and de Mooij, 1994; Bovenberg and van der Ploeg, 1994a, 1994b). However, an existing tax system is in general far from being in a second-best situation, such that there may be a potential for welfare improve-ments by introducing an environmental tax reform. Bovenberg and de Mooij (1996) extend these previous analyses by exploring how inefficiencies in the initial tax system affect the potential for a double dividend. It is possible to obtain a double dividend if the tax system is made more efficient from a nonenvironmental point of view, and the carbon tax does not erode such positive tax-shifting effects between, for example, labor and capital used as input factors in the production in the economy. Hence, by extending the model framework to incorporate initial distortions, the possibilities for obtaining a double dividend of an environmen-tal tax reform are larger.
The literature on the marginal costs of public funds (MCF) indicates that there are substantial efficiency costs of existing taxes. Brendemoen and Vennemo (1996) are using a static general equi-librium model for Norway and calculate the MCF for labor income taxation to 1.76, which implies that the marginal efficiency costs is 76 percent.3 According to Brendemoen and Vennemo (1996),
the MCF of a carbon tax is 0.82, indicating that there should be a large potential for welfare gains of increasing the carbon tax and reducing the taxes on labor income. This is supported by Ha˚konsen and Mathiesen (1995) and Mathiesen (1996), who are using a static general equilibrium model for Norway to analyze the effects of a revenue neutral increase in the carbon tax.4
Ac-cording to Ha˚konsen and Mathiesen (1995), there may be a small
3Ballard, Shoven, and Whalley (1985) and Jorgenson and Yun (1990) calculate a MCF
for labor income taxes in the range of 1.2–1.4 on U.S. data, which is substantial lower than the Norwegian analyses. Jorgenson and Yun (1990), using an intertemporal model, get a higher MCF for capital income taxes than for labor income taxes.
ENVIRONMENTAL TAX REFORM 723
welfare gain from imposing a carbon tax of 25–100 $ per ton CO2,
which reduces the CO2 emissions by 5–15 percent, and rebating
the tax revenue by reducing the payroll tax.
Neither Bovenberg and Goulder (1995) nor Goulder (1995) obtain a double dividend, independently of how the tax revenue is rebated, but the welfare loss is smallest by rebating through the payroll tax. Jorgenson and Wilcoxen (1993) obtain a double dividend by rebating the carbon tax revenue through lowering the capital income tax, but find it impossible to obtain the same by reducing the labor income tax. This reflects the higher marginal excess burden of capital taxation compared to labor income taxa-tion in the United States. As is also pointed out by Jorgenson and Wilcoxen (1993) and Bovenberg and Goulder (1995), fossil fuels are used as input in the capital-producing industries, and the carbon tax implies higher capital costs, so that reducing the capital taxation may be more beneficial than reducing the labor taxation. Compared to Goulder (1995) and Bovenberg and Goulder (1995), the positive effect by Jorgenson and Wilcoxen (1993) of reducing the capital income tax may be explained by differences in the mobility of capital in the two model frameworks. Jorgenson and Wilcoxen (1993) assume full capital mobility, while Goulder (1995) and Bovenberg and Goulder (1995) assume that capital is immo-bile between different sectors, which implies that the elasticity in capital demand is substantially larger in Jorgenson and Wilcoxen (1993).
3. THE MODEL
other hand, to assume that the domestic producers in a small open economy as the Norwegian have market power in the world market, implies that there are possibilities for unrealistic terms of trade gains. This model incorporates both the small open economy assumption of given world market prices, and avoids specialization by assuming that the producers are price takers in the export markets, while they have market power in the domestic market. Empirical analyses of Norwegian producer behavior support the existence of some market power (see, e.g., Klette, 1994; Bowitz and Cappelen, 1994). The model has 41 private and 8 governmental production activities, which are listed in Appendix A, and 17 consumer goods (see Figure 3.2). This section briefly outlines some of the important features of the model.
3A. Producer Behavior
The model of producer behavior is described in detail by Holmøy and Hægeland (1997). Producer behavior in an industry is generally specified at the firm level. All producers are considered as price takers in the world market, but have monopoly power in the home market. Each firm allocates the production,X, between the domestic market,XH, and the world market,XA, when
max-imizing profit. Abstracting from net subsidies, profit,R, in each firm is given by equation 1:
R5BHXH1PWXA2C(X), (1)
which is maximized w.r.t. the domestic producer price,BH, and the
deliveries to the world market,XA, given the following constraints
X5[(XH)(111/sHA)
For convenience, the firm label i is suppressed. Equation 2 is the transformation frontier. PW is the world market price and
sHA is the elasticity of transformation between deliveries to the
domestic and the world market. Equation 3 is the cost function. There are decreasing returns to scale in the variable costs,PS[X/
g]1/r. PS is the price of the input aggregate, g is the firm specific
ENVIRONMENTAL TAX REFORM 725
The average cost curve is downward sloping around producer equilibrium due to fixed costs,CF. Each domestic firm produces
a different variety of the composite industry product. Equation 4 is the subjective demand function for the firm, wheresHH is the
subjective demand elasticity andb is regarded as a constant by the producer but is endogenous in the model. The market structure is assumed to belong to the Chamberlanian large group case. According to Holmøy and Hægeland (1997), the following param-eter restriction has been imposed:
sHA5 r 12 r.
This restriction implies that the technology becomes additively separable in export and domestic deliveries. In Holmøy and Hæge-land (1997) it is shown that following the profit maximization, the deliveries to the domestic market and the export markets are given by
by Equations 5 and 6 and the true demand function (see Holmøy and Hægeland, 1997).
The ideal market price index of the composite of domestic varieties, PH
D, is derived from a CES preference structure, often
referred to as Spence–Dixit–Stiglitz (SDS) preferences.
PH
The firm’s subjective demand elasticity, sHH, is assumed to be
equal to the elasticity of substitution between the different domestic varieties (Holmøy and Hægeland, 1997). The indirect tax rate,t, is common to all domestic and imported varieties. The ideal price index of the composite of a fixed number of imported varieties
PI
Dis also derived from a SDS preference structure. Because all the
variety prices are exogenous since Norway is assumed to play a negligible role in the world market, the pretax c.i.f. price index
BI
PI
D5(11t)BID. (8)
The ideal price index of the composite good that is used for domestic investment and consumer purposes is given by the fol-lowing CES aggregate:
where sHI is the elasticity of substitution between the domestic
composite good and the composite import good. In Equation 9, symmetric preferences are imposed for notational simplicity.
An industry consists of N heterogeneous firms, which are or-dered according to their productivity levels such that firm 1 is the most efficient one. The differences in the productivity levels are assumed to follow a simple exponential structure such that it is possible to derive exact closed form solutions for the industry aggregates as the price index given in Equation 7 (see Holmøy and Hægeland, 1997). The entry–exit condition for the marginal firmN(the number of firms,N, is endogenous) requires that the after tax pure rents equal the fixed costs.
(12tD)fBHNXH
N1PWXAN2PKPKNP 2C(X)g5CFN, (10)
wheretDis the effective profit tax rate,KP
Nis the stock of structures,
andCF
Nare other fixed costs. The dynamics due to intertemporal
behavior is captured by the user cost of structures (dwellings, nonresidential buildings, and other structures),PKP. The user cost
formulas are derived from a standard arbitrage condition (see Holmøy, Norde´n, and Strøm, 1994, for a detailed description). Abstracting from several details in the tax code and the risk pre-mium, the user cost of capital can be written as
PKk5
3
r(12tD)1dk11wherek5M(Machinery),T(Transport equipment) orP (Struc-tures). r is the world market interest rate, dk
11is the net rate of
economic depreciation, which includes perfectly foreseen capital gains on asset k, ak is the rate of capital allowances of asset k,
and PJk is the purchaser price index for capital good k. dk
11 is
ENVIRONMENTAL TAX REFORM 727
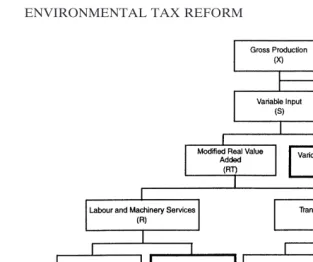
Figure 1. The production structure.
of the capital good. The tax code in the model represents the system of the 1992 tax reform, whose intention was to give approxi-mate neutrality between the effective tax rates of the different capital incomes. However, with significant positive or negative capital gains, the effective rate of capital taxation will deviate from the neutral rate.
3B. Production Structure
The structure of the production technology is represented by a nested tree structure of CES aggregates given in Figure 1. The input structure has a detailed description of the use of energy commodities and the demand for polluting and nonpolluting trans-port activities. All factors are completely mobile and malleable.5
3C. Household Behavior
Consumption, labor supply, and saving result from the decisions of an infinitely lived representative consumer maximizing inter-temporal utility with perfect foresight. In year t the consumer chooses a path of “full consumption,”F, by maximizing
Ut5
o
where r is the subjective rate of time preference and sF is the
intertemporal elasticity of substitution in full consumption. The consumer maximizes intertemporal utility subject to an intertem-poral budget constraint requiring that the present value of full consumption in all future periods does not exceed total wealth (current nonhuman wealth plus the present value of labor income and net transfers). The demand for full consumption following from the utility maximization, is given by
Fs5 l2sF
3
11r(12twherer is the world market interest rate on financial wealth, tD
is the tax rate on capital income, l is the marginal utility of wealth, andPFis the ideal price index of full consumption. Full consumption is a CES composite of material consumption,C, and leisure,LE. The corresponding ideal price index is given by
PFs5
3
aCPCs(12sC)1(12 aC)1
PLEs11g
2
(12sC)
4
12s1C, (15)wherePCis the price index of material consumption andPLEis the price of leisure measured in efficiency units such as labor, implying that the price of leisure must be adjusted withg, the factor augmenting technical change. sC is the elasticity of substitution
between material consumption and leisure, andaCis the intensity
parameter for material consumption. In each period full consump-tion is distributed between leisure and material consumpconsump-tion, and the demand functions follow from applying Shepard’s lemma to Equation 15.
ENVIRONMENTAL TAX REFORM 729
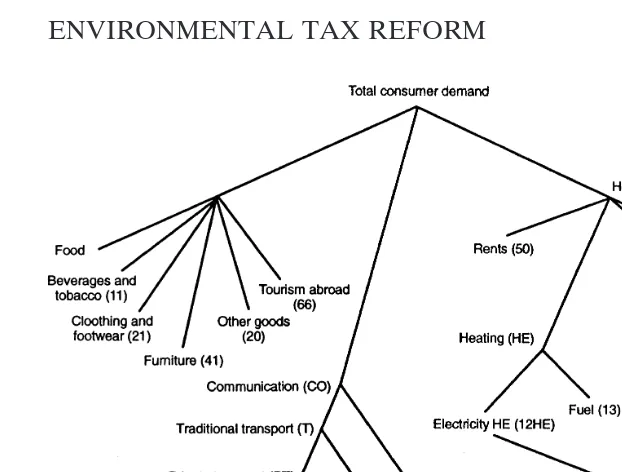
Figure 2. The demand system.
L5T2 LE
11g. (18)
The aggregate endowment of total available time in each period,
T, is exogenous and grows at the constant rate,g, which determines the long-run (steady-state) growth rate of the economy.
The total of material consumption is allocated acrossNdifferent consumer goods according to a nested OCES (Origin Adjusted Constant Elasticity of Substitution) structure as shown in Figure 2 (Holtsmark and Aasness, 1995). The OCES demand system implies that the Engel elasticities are not equal to 1, and is designed for studying the effects of environmental tax reforms due to the detailed description of both the use of energy commodities for residential purposes, and the demand for public and private trans-port services.
3D. The Government Sector
revenues and expenditures. In the policy experiments it is required that the nominal deficit and real government spending follow the same path as in the reference case. To meet its cash flow requirements, the government’s nominal tax receipts under a pol-icy change must be the same as in the reference case. The carbon tax increase is accompanied by a reduction in the payroll tax, to obtain revenue neutrality in each period.
3E. Intertemporal Equilibrium
Intratemporal equilibrium requires that demand equals supply in all commodity markets and the labor market in each period. Intertemporal equilibrium requires fulfillment of the two transver-sality conditions; total discounted value of net foreign debt and the value of real capital, respectively, must both be zero. The model is characterized by a path-dependent steady-state solution (see Sen and Turnovsky, 1989; Bye and Holmøy, 1992, for theoreti-cal expositions). A necessary condition for reaching a steady-state solution is
11r(12tD)5(11 r) (11g)
1
sF, (19)
which is a “razor’s edge” condition becauser, tD,r, andg are all
considered as exogenous. In the analyses, Equation 19 is assumed to hold at all points in time. The firms determine their net invest-ments by maximizing total discounted value of each firm, given the transversality condition for the value of real capital. The other transversality condition regarding the net foreign debt is fulfilled by adjusting the optimal level of full consumption for the represen-tative consumer. Numerically, this transversality condition is taken into account in the same way as in Bye and Holmøy (1992); the marginal utility of wealth, l, in Equation 14, will be constant during a transitional path, and is adjusted to find the optimal path of full consumption, which also satisfies this transversality condition. The endogeneity of the domestic prices in the model prevents steady state from occurring immediately.6
3F. Data and Parameters
The model is calibrated to the 1992 national accounts. For the production functions the elasticities of substitution between
6The intertemporal model with perfect foresight expectations is solved by using a
ENVIRONMENTAL TAX REFORM 731
machinery and energy, the elasticity of substitution between the energy–machinery aggregate and labor and the elasticity of substi-tution between the modified real value added and various material inputs (see Figure 1), are adjusted to parameters of a Generalized Leontief (GL) cost function estimated on time-series data from the national accounts (see Alfsen, Bye, and Holmøy, 1996). The elasticities of substitution between electricity and fuel oil in the energy aggregate are based on CES function estimates on time-series data by Mysen (1991). Most elasticities of substitution are smaller than 1, indicating fairly low substitution possibilities at each step in the factor tree. The elasticities of substitution between nonpolluting and polluting transports, and the corresponding elas-ticities between the modified real value aggregate and various material inputs are set to 0.5 for all industries.
In the model of producer behavior the elasticities of transforma-tion between deliveries to the domestic and foreign market are set equal to 4. The elasticities of scale are then calibrated to 0.83, given the elasticities of transformation. The elasticities of substitution between domestic products and imported goods, are partly based on estimated parameters (see, e.g., Svendsen, 1990), but adjusted upwards such that all are around 4. The elasticities of substitution between the different domestic varieties are cali-brated by using the observed values of mark-ups in the industries. For further details of the calibration of the model of producer behaviour, see Holmøy and Hægeland (1997).
For the household model the calibration of the parameters in the complete demand system is based on detailed econometric studies using both micro- and macrodata (see Holtsmark and Aasness, 1995). The elasticity of substitution between material consumption and leisure equals 0.25, which is based on estimates of labor supply for married women and men on microdata by Aaberge, Dagsvik, and Strøm (1995). Estimates of the wage elas-ticity of the labor supply will, in general, depend on the ratio of hours worked compared to total available time. Hence, the larger this ratio, the larger the wage elasticity of labor supply. The share of leisure in the full consumption aggregate is set equal to 0.51. The intertemporal elasticity of substitution, sF, equals 0.3
(Stei-gum, 1993). Econometric estimates of sF vary considerably
4. SIMULATION RESULTS
4A. Reference Case
The effects of policy shocks are measured as deviations from a reference path. The reference path is simulated by keeping all tax rates and other policy variables constant at their benchmark (1992) values. All other exogenous variables as, for example, the world market prices, are also kept constant along the reference path. The benchmark year is not interpreted as a steady-state solution. Instead, the model is simulated to obtain a steady-state solution, given the assumption of constant exogenous variables. The economy adjusts along a saddle-point stable path, and in the long run the economy reaches a steady state with a constant growth rate and constant relative prices.7 The long-run growth rate is
set to zero. This simplifies the solution of the model without significantly affecting the marginal multipliers in the model.
4B. The Environmental Tax Reform
This section analyzes to what extent the gross costs of CO2
taxation measured by welfare changes of a unilateral CO2tax, are
reduced when revenues are rebated through cuts in the payroll tax rate.
In Norway, the existing CO2tax8differs substantially between
different kinds of fossil fuels and between industries. In 1995, the CO2tax on gasoline was 360 NOK (approximately 50 USD) per
ton CO2, nearly twice as much as the CO2tax on other fuel oils and
coke and coal. Production and transport of petroleum products are taxed at the same level as gasoline. There is no tax on domestic use of natural gas and on the use of fossil fuels for processing purposes in the production of industrial chemicals, metals, and refined oil products. For most of the fossil fuels, especially for gasoline, the CO2tax is levied on top of other commodity taxes,9
which is also the case in this analysis. The carbon tax implemented in the analysis is equal per ton of CO2 emissions for every kind
of fossil fuel and does not differ between industries or consumers.
7The steady-state solution is reached after 40 periods. 8In the following the terms carbon tax and CO
2tax are used interchangeably. 9In an analysis of the effects of optimal carbon taxes on the Norwegian economy by
ENVIRONMENTAL TAX REFORM 733
In the policy simulation the carbon tax on gasoline is increased to 700 NOK (approximately 100 USD) per ton CO2, as for the
other kinds of fossil fuels. A carbon tax of 700 NOK gives an increase in the price of heating oils, transport oils, and gasoline of 50, 60, and 10 percent, respectively. The carbon tax suggested in the Ministry of Finance (1996) is 50 NOK per ton CO2, but
Mathiesen (1996) analyzes the effects of a carbon tax of 650 NOK per ton CO2. The carbon tax is implemented in year 2000, and
kept constant at this level for the rest of the simulation period. The carbon tax is announced in the first simulation period, which implies that the agents start adjusting to the new tax immediately.
4C. Long Run Effects
Total welfare, measured as total discounted utility ignoring the environmental effect, increases by 0.12 percent. The emissions of CO2are reduced by 13.5 percent; hence, the tax reform supports
the double dividend hypothesis. What are the effects present in this analysis of an environmental tax reform that make it possible to obtain a double dividend? To answer this question, I will first examine the main sources of possible welfare changes.
In an intertemporal general equilibrium model, first-order wel-fare gains are obtained by intra- and intertemporal reallocations originating from existing tax wedges. I will especially mention here two initial tax wedges; (1) the discrepancy between the mar-ginal value of labor and leisure due to the taxation of labor, influencing the labor–leisure choice; and (2) the taxation of income from net financial wealth implying that the social marginal value of net foreign wealth is larger than the private marginal value, influencing the consumption–saving decision. As the discussion of the results shows, there are also other initial tax wedges and distortions that contribute to the results. The long-run effects on full consumption, employment, net foreign wealth, and the stock of real capital are all positive (see Table 1). It is the positive effects on employment, net foreign wealth, and the real capital stock that make room for the positive effect on full consumption and then overall welfare. Let us start with the effects on full consumption and net foreign wealth to justify this conclusion.
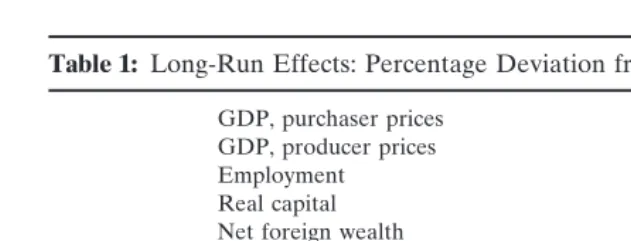
Table 1: Long-Run Effects: Percentage Deviation from the Reference Path
GDP, purchaser prices 20.02
GDP, producer prices 0.01
Employment 0.08
Real capital 0.05
Net foreign wealth 4.2
Full consumption 0.08
Material consumption 0.26
Leisure 20.06
Wage costs per hour 22.8
Price of leisure 0.8
Price index, material consumption 20.5
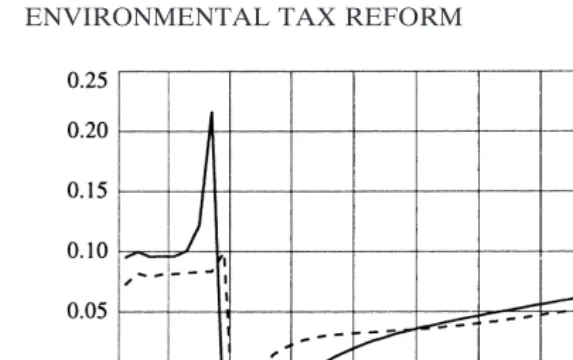
the constancy of the marginal utility of wealth, and the intertempo-ral substitution effect, depending on the price of full consumption, which varies along the path. The marginal utility of wealth is determined by the transversality condition. The marginal utility of wealth is lower under the tax reform, reflecting a positive income effect on full consumption along the whole path. Whether the total effect on full consumption is positive in each period (see Figure 3), depends on whether the increase in the price of full consumption through the intertemporal substitution effect (see Figure 4), outweighs the positive income effect from the marginal utility of wealth.
The long-run level of net foreign debt is lower. This is mirrored by a reduction in the long-run trade surplus. The society’s cost of net foreign debt is higher than the private cost, due to the taxation of income from financial capital for the private investors. This tax-adjusted interest rate is assumed to equal the intertemporal rate of time preference for the consumer, which determines the consumption–saving path. Reducing net foreign debt has a positive effect on full consumption and welfare, due to this discrepancy between the social and private cost of net foreign debt.
ENVIRONMENTAL TAX REFORM 735
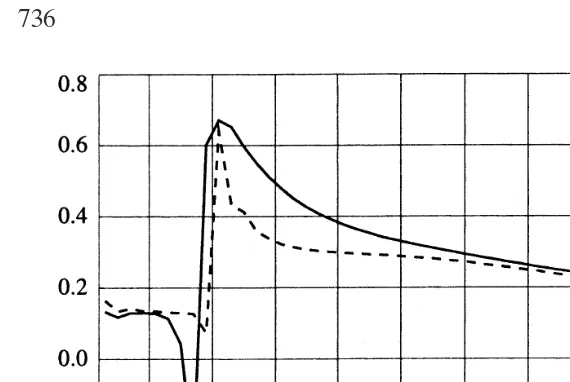
Figure 3. Effects on full consumption: percentage deviation from the Reference path.
services. These industries are more labor intensive. Accordingly, total labor demand increases both due to substitution within the industries over to labor because labor becomes relatively cheaper, but also due to interindustry substitution over to more labor-intensive industries. In the long run equilibrium the wage rate paid to the employees is 0.8 percent higher. Due to the reduction in the domestic producer prices the price on material consumption is reduced by 0.5 percent (see the discussion later on), implying that material consumption has become relatively cheaper than leisure. In the long run material consumption is 0.26 percent higher and consumption of leisure is 0.06 percent lower, so labor supply and employment measured in man hours increase by 0.08 percent under the environmental tax reform. Higher employment has a positive welfare effect because the marginal productivity of labor is higher than the marginal willingness to pay for leisure.
The tax reform’s effects on the domestic costs and prices differ between the industries according to the intensity of fossil fuels in the production process. Implementation of the carbon tax gives a substantial increase in the price of fossil fuels, inducing a large increase in the production costs for the pollution-intensive (w.r.t. CO2 emissions) industries such as manufacturing of industrial
Figure 4. Effects on the price of full consumption: percentage deviation from the Reference path.
limited possibilities of substituting away from the CO2tax because
the use of fossil fuels such as coke and coal is directly connected to the production processes in the industries. Both the production and export from these industries are reduced by 20 to 30 percent in the long run, contributing to a reduction in total export.
Manufacturing of industrial chemicals and metals are also inten-sively using subsidized hydro power. Production of hydro power is the only industry in the model with no possibilities to run down the capacity due to irreversibility of the investments.10The
reduction in the demand for electricity for these industries induces a fall in the average electricity price of 17 percent. Reallocation of hydro power from the subsidized deliveries to the pollution-intensive industries to ordinary consumption has a positive welfare effect. On the other hand, the reduction in the average price of hydro power implies that the value of the hydro power resources is reduced, contributing negatively to total welfare. Approximately all Norwegian electricity is produced by hydro power, which is not subject to the carbon tax. In the analysis there are no possibilities of exporting the excess capacity of hydro power. This may seem
10See Johnsen (1991) for a more detailed description of the model of the electricity
ENVIRONMENTAL TAX REFORM 737
unrealistic in such a long-run analysis, but the existing export capacity is small, and it is assumed as a simplification that this capacity is unchanged during the analysis.
The reduction in the electricity price gives an additional substi-tution from fossil fuels to electricity and contributes to reduce total private energy costs. Together with the reduction in the hourly wage costs, this induces a negative shift in the cost curve for all industries except for the pollution intensive-industries, from the year of implementation. Hence, the level of production and export from the nonpolluting industries (including the primary industries) increases. On the domestic market, where the produc-ers are assumed to have market power, the negative cost effect is dominating the positive-demand effects, such that the producer prices are reduced, except for the pollution-intensive industries. The fall in the domestic producer prices gives a reduction in both the price of capital goods and material consumption. In addition, the domestic price fall induces substitution over to domestic prod-ucts, and total import is reduced in the long run.
The total stock of real capital has increased by 0.05 percent in the long run, due to an increase in structures, especially dwelling services, but also from higher consumer demand for housing. On the other hand, the stock of transport equipment and machinery declines due to lower demand and activity in the pollution inten-sive industries, such as land and air transport and the manufactur-ing of industrial chemicals and metals. The marginal utility of housing capital is lower than for other structures, because the effective tax rate on housing capital is small compared to other structures.11Hence, reallocations within the stock of structures in
favor of housing contribute negatively to overall productivity. Higher employment and stock of real capital should induce an increase in GDP, but as is shown in Table 1, GDP is reduced. The measurement of GDP, though, deserves a comment. The value of GDP is measured in purchaser prices, which include indirect taxes. When commodities with high indirect taxes are substituted with commodities with low indirect taxes, the total value of GDP measured in purchaser prices is reduced, due to these reallocations of demand. The substitution over to material consumption has a positive effect on the consumer demand for fossil fuels, but the substitution between the commodities within
Figure 5. Effects on the stock of real capital: percentage deviation from the Reference path.
the aggregate material consumption gives an overall reduction in the consumer demand for gasoline, transport services, cars, and fuel oil for heating purposes. These commodities initially have high indirect taxes, leading to a reduction in GDP in purchaser prices, but measured in producer prices GDP increases by 0.01 percent. Compared with the increase in the stock of real capital of 0.05 percent and total employment of 0.08 percent, the increase in GDP of 0.01 percent still implies a reduction in total factor productivity. As mentioned earlier, this is partly due to within capital substitution over to housing, but also increases in produc-tion in low-productivity industries as the primary industries. In addition, decreasing returns to scale contribute to lowering total factor productivity.
ENVIRONMENTAL TAX REFORM 739
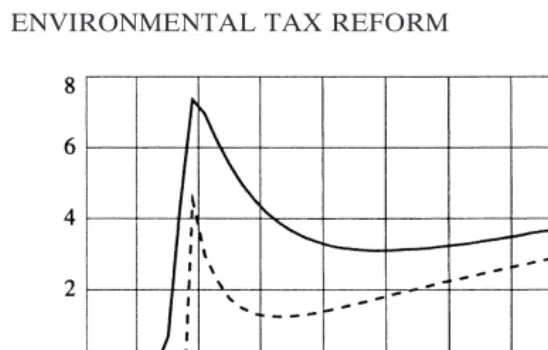
Figure 6. Effects on net foreign wealth: percentage deviation from the Reference path.
private marginal costs. To compare with corresponding analyses by Goulder (1995) and Jorgenson and Wilcoxen (1993), which do not obtain a welfare gain by such tax a reform, the difference may be explained by the higher marginal excess burden of capital taxation than labor taxation in the United States. Because the carbon tax in general has a positive effect on the costs of using capital equipment, it can be interpreted as an indirect tax on capital, reducing the capital stock and the possible welfare gains by reinforcing the existing tax wedge on real capital (Figures 5 and 6).
4D. Transitional Dynamics
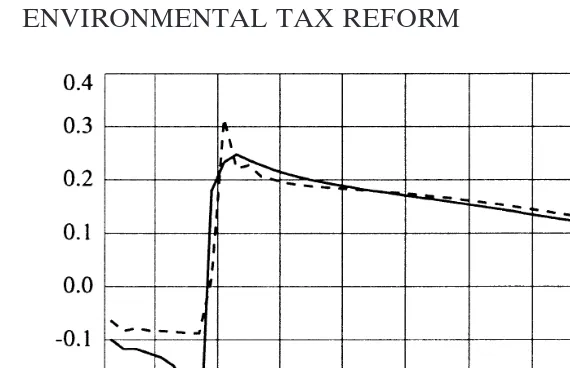
Figure 7. Effects on the price of leisure: percentage deviation from the Reference path.
implies that there are some periods just after the tax reform is implemented where the negative intertemporal substitution effect outweighs the positive income effect, such that full consumption is reduced during these periods, compared to the reference path. Hence, there are some transitional effects that modify the positive long-run effect on total welfare. The next question to ask is then; what are the effects creating this transitional path for the price of full consumption?
ENVIRONMENTAL TAX REFORM 741
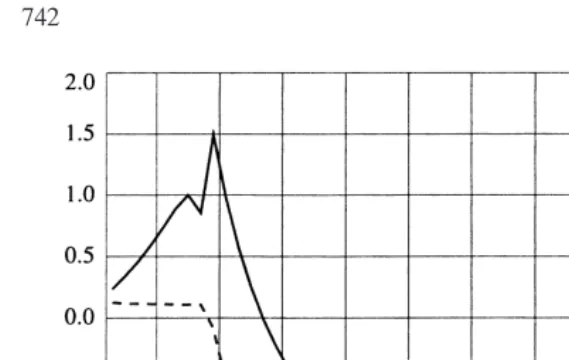
Figure 8. Effects on total numbers of man hours: percentage deviation from the Reference path.
not outweigh the positive income effect, so full consumption is higher compared to the reference path in the announcement period. After the implementation of the tax reform in year 2000, the equilibrium wage rate (price of leisure, Figure 7) increases due to higher demand for labor following the reduction in the payroll tax (see Figure 8). The increase in the price of leisure outweighs the reduction in the price of material consumption, contributing to an increase in the price of full consumption that is large enough to reduce full consumption in the first years after the implementa-tion of the tax reform. As the economy adjusts towards the new stationary solution, the price of full consumption reaches its new higher long-run level, but the increase does not outweigh the positive-income effect on full consumption from the reduction in the marginal utility of wealth.
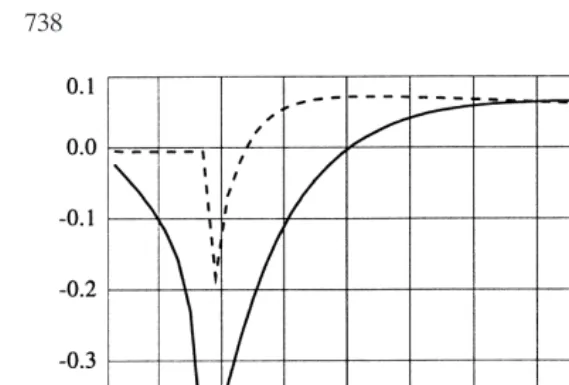
Figure 9. Effects on the user cost of structures: percentage deviation from the Reference path.
(see Figure 10). The negative capital gains induce an increase in the user cost of structures. The capital gains, relative to the refer-ence path, are negative from the first period of simulation, and the user cost of structures is increasing towards the period of implementation. From the entry–exit condition this increase in the user cost of capital contributes to reduce total after tax profit, having a negative effect on the total capacity in an industry. The least efficient firms will exit, reducing the stock of structures in an industry. In addition, the consumer demand for housing is reduced due to substitution over to the other commodities. The user cost of transport capital and machinery also follows this kind of path, reducing the demand for the corresponding capital equipment. All these effects contribute to reduce the stock of real capital in the announcement period (see Figure 5). In the periods just after the implementation of the tax reform there are still negative capital gains due to reduction in the price of structures as it adjusts towards the new lower stationary equilibrium level. From 2003, the effect of the negative capital gains is neutralized by the effect of the lower price of structures.
ENVIRONMENTAL TAX REFORM 743
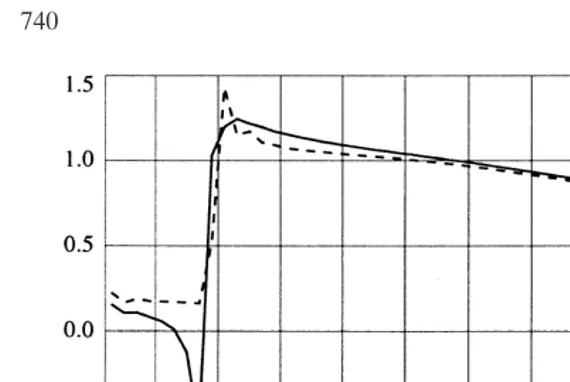
Figure 10. Effects on the price of structures: percentage deviation from the Reference path.
lower domestic demand for both consumption and investment purposes, reducing net foreign debt. In the year of implementation, saving in both real and financial capital increases. The investments in total real capital are positive, due to an increase in the demand for housing and dwelling services. From 2001, saving is reallocated to real capital.
To summarize the transitional effects due to intertemporal sub-stitution effects and the implications for total welfare, the an-nouncement of the tax reform implies that full consumption is put forward in time to the announcement period, due to future increase in the price of full consumption. After the implementation of the tax reform, full consumption is postponed as the price of full consumption following an initial jump just after the implemen-tation is reduced as the economy adjusts towards the new steady-state solution. The higher level of employment and net foreign wealth from the year of implementation of the tax reform are the major contributors to the positive welfare effect.
4E. Implications of Imperfect Expectations
In the reference path and in the simulation of the tax reform, it is assumed that the agents have perfect foresight. In this section it is analyzed whether and to what extent imperfect expectations will influence the total welfare costs. It is assumed that the invest-ors in real capital have imperfect expectations of future prices. To be able to single out the partial contribution of the investors making an expectation error, it is assumed that the investors do not change price expectations from the reference path. This as-sumption can be interpreted as if they do not recognize future price changes due to the tax reform. This seems to be the best way to design the experiment testing for partial implications of imperfect expectations. By choosing another process of expecta-tion formaexpecta-tion, the policy simulaexpecta-tion and the reference path with perfect foresight would not have been comparable w.r.t. the partial implications of imperfect expectations, because both the assump-tion about expectaassump-tions and the policy variables are altered, com-pared to the reference path. The consumers are still having perfect foresight, and they are optimizing their consumption–saving path, given the restriction from the transversality condition.
Bye and Holmøy (1992) discuss the effects of an anticipated versus an unanticipated price change in an aggregate intertempo-ral model with perfect foresight and no distortive taxes. It is shown that the economy will experience a welfare loss with an unantici-pated change in an exogenous world market price compared to an anticipated change, because the price expectations in some periods are wrong compared to the prices that actually occur, i.e., perceived prices deviate from shadow prices. In my experiment, the investors have imperfect expectations during the whole transi-tion period,12in a first best economy that would certainly lead to
a welfare loss. But, in an initially distorted economy as in the analysis presented here, the welfare implications of imperfect ex-pectations may be different from a first best situation. Imperfect expectations may contribute to reduce the distortion between the social and private marginal valuation of savings, and generate reallocations between distorted markets that may be welfare im-proving. Such gains from imperfect expectations are found and discussed in Ballard and Goulder (1985) and Ballard (1987), who
12Expecting zero capital gains is, of course, correct in the steady-state solution when
ENVIRONMENTAL TAX REFORM 745
analyze welfare effects of a consumption tax under the assumption of either perfect or myopic expectations for the consumer.
The critical factor explaining their result is the difference be-tween the marginal social benefit and marginal social cost of sav-ing, due to a tax on capital, in an initially distorted economy. The consumption tax leads to capital deepening, so that the price of capital services falls over time. When consumers have perfect foresight, they predict these price reductions, and save less in a transitional period, which reduces welfare. The existence of myo-pic expectations contributes to reduce the wedge between the social and private return on capital. In these studies the steady-state solution is independent of the transitional path. The positive welfare effect is only due to changes in the transitional path of consumption and saving towards the steady-state solution. The analysis in this paper differs from these U.S. studies by using an intertemporal model for a small open economy, implying a path-dependent steady-state solution, and analyzing imperfect expecta-tions by the investors. The initial distorexpecta-tions in the economy are also, of course, different.
the path and in the stationary solution that contribute positively to total discounted utility.
The negative capital gains in the user cost of capital are influenc-ing the investment behavior, both in the announcement period and after the implementation. When the investors have unchanged expectations, they do not expect the negative capital gains from the beginning of the simulation period, which implies that the perceived user cost of capital is lower. The effect on the user cost is strongest for structures (see Figure 9), and machinery, because they are both produced domestically, while it is much smaller for transport equipment. Hence, the differences between the two transitional paths are mainly caused by differences in the user costs of structures and machinery. In the announcement period investments in housing capital, dwelling services, and machinery increase. Higher domestic demand for structures and machinery implies higher labor demand, which has a positive effect on the equilibrium wage rate. After implementation of the tax reform, the lack of negative capital gains implies that the user costs of structures and machinery adjust faster to their new lower level. The consumer price of housing is further reduced, and this is the main contributor to the reduction in the price of material consumption. The wage rate is also slightly lower, reinforcing the negative effect on the price of full consumption (see Figure 4).
ENVIRONMENTAL TAX REFORM 747
8), contributing positively to overall welfare because the marginal productivity of labor is considerably higher than the marginal willingness to pay for leisure.
To summarize the effects of the investors having imperfect expectations in an initially distorted economy, the reallocation of saving from financial to real capital along the path and lower total savings induce a welfare loss due to the expectation error. The social marginal cost of net foreign debt is higher than the private marginal cost of net foreign debt and the social marginal return on real capital. On the other hand, by exploiting the large existing tax wedge in the labor market, higher employment outweighs the negative welfare effect of the shift in the composition of savings along the path.
The sensitivity analysis w.r.t. the year of implementation and the importance of the announcement period13, supports the conclusion
that the positive welfare effect of the tax reform is approximately independent of whether the investors have imperfect expectations or perfect foresight.
5. CONCLUDING REMARKS
This paper has analyzed the nonenvironmental welfare costs of carbon taxes and the possibilities of obtaining a double dividend with an environmental tax reform, in an intertemporal general equilibrium framework. There are several features of the model that make it substantially different from other CGE models used for analyzing the effects of carbon taxes on the Norwegian econ-omy. An intertemporal model, where the agents have perfect foresight, gives endogenous accumulation of both real and finan-cial capital, and a consistent welfare measure by total discounted utility. In addition, producers are price takers in the world market, which implies that it is not possible to obtain terms of trade gains following domestic tax increases. The analysis shows that it is possible to obtain a double dividend by introducing a CO2tax of
700 NOK, which increases the prices of heating oils, transport oils, and gasoline of 50, 60, and 10 percent, respectively, and using the tax revenue to reduce the payroll tax, by exploiting existing tax wedges in the labor market and between consumption and saving.
13Announcement effects are absent in both Ballard and Goulder (1985) and Ballard
This paper also analyzes how imperfect price expectations for the investors influence the welfare costs of the tax reform. The welfare gain is approximately unchanged when changing expecta-tions from perfect to imperfect, but the transitional paths are quite different. The reason for these differences is the negative effect of the tax reform on the domestic producer prices, implying negative capital gains in the user cost of capital along the transitional path with perfect foresight, while the negative capital gains are absent with unchanged expectations. This initializes reallocation of saving from financial to real capital along the path, increasing net foreign debt, which induces a welfare loss. The negative effect is, though, outweighed by the positive welfare effect of higher employment. The results in this study should be kept in perspective. The welfare gain of the tax reform is very small, but small welfare effects are common in numerical analyses of tax reforms (see, e.g., Auerbach, 1989; Goulder, 1995). There are no economy– environment–economy feedbacks in the model, which would have given an additional positive effect on total welfare in this analysis. It is also obvious that the assumption of complete factor mobility must be important for the welfare costs of the tax reform. Analyz-ing the effects of environmental tax reforms usAnalyz-ing a dynamic model framework with economy–environment–economy feedbacks and restricted short-run factor mobility, is left for further research.
REFERENCES
Aaberge, R., Dagsvik, J.K., and Strøm, S. (1995) Labour Supply Responses and Welfare Effects of Tax Reforms.Scandinavian Journal of Economics97:635–659. Alfsen, K., Bye, T., and Holmøy, E. (1996)MSG-EE: An Applied General Equilibrium
Model for Energy and Environmental Analyses.Social and Economic Studies 96. Statistics Norway.
Auerbach, A. (1989) The Deadweight Loss from “Non-Neutral” Capital Income Taxation. Journal of Public Economics4:1–36.
Ballard, C.L., and Goulder, L.H. (1985) Consumption Taxes, Foresight, and Welfare: A Computable General Equilibrium Analysis. InNew Developments in Applied Gen-eral Equilibrium Analysis(J. Piggot and J. Whalley, Eds.). Cambridge, MA: Cam-bridge University Press.
Ballad, C.L., Shoven, J.B., and Whalley, J. (1985) General Equilibrium Computations of the Marginal Welfare Costs of Taxes in the United States.American Economic Review75:128–138.
Ballard, C.L. (1987) Tax Policy and Consumer Foresight: A General Equilibrium Simula-tion Study.Economic Inquiry25:267–284.
ENVIRONMENTAL TAX REFORM 749
Bovenberg, A.L., and de Mooij, R.A. (1994) Environmental Levies and Distorting Taxa-tion.American Economic Review94:1085–1089.
Bovenberg, A.L., and de Mooij, R.A. (1996) Environmental Taxation and the Double Dividend: The Role of Factor Substitution and Capital Mobility. InEnvironmental Fiscal Reform and Unemployment(C. Carraro and D. Siniscalco, Eds.). New York: Kluwer Academic Publishers.
Bovenberg, A.L., and van der Ploeg, F. (1994a) Environmental Policy, Public Finance and the Labour Market in a Second-Best World. Journal of Public Economics 55:340–390.
Bovenberg, A.L., and van der Ploeg, F. (1994b) Green Policies in a Small Open Economy. Scandinavian Journal of Economics96:343–363.
Bowitz, E., and Cappelen, A˚ . (1994) Prisdannelse og Faktoretterspørsel i Norske Næringer (Price formation and factor demand in Norwegian industries). Social and Economic Studies 85, Statistics Norway (in Norwegian).
Brendemoen, A., Bye, T., and Hoel, M. (1995) Utforming av CO2-Avgifter: Teoretisk
Grunnlag og Økonomiske Konsekvenser (Design of CO2-taxes: Theoretical basis
and economic consequences).Norsk Økonomisk Tidsskrift (NØT)109:77–106 (in Norwegian).
Brendemoen, A., and Vennemo, H. (1994) A Climate Treaty and the Norwegian Economy: A CGE Assessment.The Energy Journal15:77–93.
Brendemoen, A., and Vennemo, H. (1996) The Marginal Costs of Funds in the Presence of Environmental Externalities.Scandinavian Journal of Economics98:405–422. Bye, B., and Holmøy, E. (1992) Dynamic Equilibrium Adjustments to a Terms of Trade
Disturbance. Discussion Papers 72, Statistics Norway.
Christiansen, V. (1996) Optimal og “Grønn” Beskatning. InGrønne Skatter—en Politikk for Bedre Miljø og Høy Sysselsetting (Optimal and “green” taxation, in Green taxes—a policy for increased environmental quality and high employment). NOU 1996:9. Ministry of Finance, Norway. Appendix 1 (in Norwegian).
Goulder, L.H. (1994) Environmental Taxation and the Double Dividend: A Reader’s Guide. Paper presented at the 50th Congress of the International Institute of Public Finance, Harvard University, Cambridge, MA.
Goulder, L.H. (1995) Effects of Carbon Taxes in an Economy With Prior Tax Distortions: An Intertemporal General Equilibrium Analysis.Journal of Environmental Eco-nomics and Management29:271–297.
Ha˚konsen, L., and Mathiesen, L. (1995) Towards a More Comprehensive Cost Measure for CO2-Reductions. Working Paper 3/95, Department of Economics, Norwegian
School of Economics and Businesss Administration, Bergen, Norway.
Holmøy, E., Norde´n, G., and Strøm, B. (1994) MSG-5, A Complete Description of the System of Equations. Rapporter 94/19, Statistics Norway.
Holmøy, E., and Vennemo, H. (1995) A General Equilibrium Assessment of a Suggested Reform in Capital Income Taxation.Journal of Policy Modeling17:531–556. Holmøy, E., and Hægeland, T. (1997) Aggregate Productivity Effects and Technology
Shocks in a Model of Heterogenous Firms: The Importance of Equilibrium Adjust-ments; Discussion paper 198, Statistics Norway.
Holtsmark, B., and Aasness, J. (1995) Effects on Consumer Demand Patterns of Falling Prices in Telecommunication. Working Paper 1995:8, Center for International Cli-mate and Environmental Research—Oslo (CICERO), Norway.
Jorgenson, D.W., and Wilcoxen, P.J. (1993) Reducing U.S. Carbon Emissions: An Econo-metric General Equlibrium Assessment.Resource and Energy Economics15:7–25. Jorgenson, D.W., and Yun, K.Y. (1990)Tax Policy and the Cost of Capital.New York:
Oxford University Press.
Klette, T.J. (1994) Estimating Price-Cost Margins and Scale Economies from a Panel of Micro Data. Discussion Papers 130, Statistics Norway.
Mathiesen, L. (1996) Grønn Skattereform: Beregning av Noen Konsekvenser (Green tax reform: Some empirical consequences). SNF-rapport 30/96, The Foundation for Research in Economics and Business Administration (SNF), Norway (in Norwe-gian).
Ministry of Finance. (1996) Grønne Skatter—en Politikk for Bedre Miljø og Høy Sysselset-ting (Green taxes—a policy for increased environmental quality and high employ-ment). NOU 1996:9. Ministry of Finance Norway (in Norwegian).
Mysen, H.T. (1991) Substitusjon Mellom Olje og Elektrisitet i Produksjonssektorene (Sub-stitution between fuel oil and electricity in the industries). Rapporter 91/7, Statistics Norway (in Norwegian).
Norman, V.D. (1990) Assessing Trade and Welfare Effects of Trade Liberalization. Euro-pean Economic Review34:725–745.
Sen, P., and Turnovsky, S.J. (1989) Deterioration of the Terms of Trade and Capital Accumulation: A Re-Examination of the Laursen-Metzler Effect.Journal of Inter-national Economics26:227–250.
Steigum, E., Jr. (1993) Accounting for Long Run Effects of Fiscal Policy by Means of Computable Overlapping Generations Models. InMacroeconomic Modelling and Policy Implications(S. Honkapohja and M. Ingberg, Eds.). Amsterdam: Elsevier Science Publishers B.V.
ENVIRONMENTAL TAX REFORM 751
Appendix A: Production Activities in MSG-6
MSG-6 Code Production activities
22 Meat and dairy products
16 Grain, vegetables, fruit, oils, etc.
17 Beverages and tobacco
18 Textiles, wearing apparel and footwear
26 Furniture and fixtures
27 Chemical and mineral products, incl. mining and quarrying 28 Printing and publishing
34 Manufacture of pulp and paper articles 37 Manufacture of industrial chemicals
41 Gasoline
42A Diesel fuel
42B Heating fuels, paraffin, etc.
43 Manufacture of metals
46 Manufacture of metal products, machinery, and equipment
47 Hired work and repairs
48 Building of ships
49 Manufacture and repair of oil drilling rigs and ships, oil production platforms etc.
55 Construction, excl. oil well drilling
60 Ocean transport—foreign
63 Finance and insurance
66 Crude oil
67 Natural gas
68 Services in oil and gas exploration 69 Pipeline transport of oil and gas 71 Production of electricity
72 Power net renting
73 Sales and distribution of electricity 75 Car and other land transportation
76 Air transport
77 Railroads and electrical commuters
78 Ocean transport—domestic
79 Post and telecommunication 81 Wholesale and retail trade
83 Dwelling services
85 Other private services
89 Imputed service charges from financial institutions
Appendix A: Continued
MSG-6 Code Production activities
Government Input Activities
Central government
92C Defence exclusive of military submarines and aircrafts 92U Military submarines and aircraft
93S Central government education and research
94S Central government health-care and veterinary services etc. 95S Other central government services
Local government
93K Local government education and research