Ž .
Journal of Health Economics 19 2000 271–282
www.elsevier.nlrlocatereconbase
The effects of beer taxes on physical child abuse
Sara Markowitz
a,b,), Michael Grossman
b,ca
Department of Humanities and Social Sciences, New Jersey Institute of Technology, UniÕersity Heights, Newark, NJ, 07102-1982, USA
b
National Bureau of Economic Research, 365 Fifth AÕenue, 5th Floor, New York, NY 10016-4309, USA
c
PhD Program in Economics, City UniÕersity of New York Graduate School, 365 Fifth AÕenue, 5th Floor, New York, NY 10016-4309, USA
Abstract
The purpose of this paper is to examine the effects of alcohol regulation on physical child abuse. Given the positive relationship between alcohol consumption and violence, and the negative relationship between consumption and price, the principal hypothesis to be tested is that an increase in the price of alcohol will lead to a reduction in the incidence of violence. We also examine the effects of illegal drug prices and alcohol availability on the incidence of child abuse. Equations are estimated separately for mothers and fathers, and include state fixed effects. Results indicate that increases in the beer tax may decrease the incidence of violence committed by females but not by males. q2000 Elsevier Science
B.V. All rights reserved.
JEL classification: I10; J13
Keywords: Alcohol regulation; Beer taxes; Child abuse; Domestic violence
1. Introduction
Child abuse has become a national epidemic. The statistics are grim: more than 1 million children each year are confirmed as victims of child abuse and neglect by child protective service agencies, and every day, at least three children die as a
)Corresponding author. Department of Humanities and Social Sciences, New Jersey Institute of
Technology, University Heights, Newark, NJ, 07102-1982, USA. Tel.:q1-973-596-6375; fax:q 1-973-642-4689; E-mail: [email protected]
0167-6296r00r$ - see front matterq2000 Elsevier Science B.V. All rights reserved.
Ž .
( ) S. Markowitz, M. GrossmanrJournal of Health Economics 19 2000 271–282
272
result of abuse and neglect. Many studies have shown that alcohol plays a significant role in incidents of domestic violence. It is estimated that about 40% of
Ž
all cases of child maltreatment including physical abuse, sexual abuse and
. Ž .
neglect involve alcohol Children of Alcoholics Foundation, 1996 . Given the observed positive relationship between alcohol consumption and violence, and the well-established negative relationship between alcohol consumption and its price, the principal hypothesis to be tested in this paper is that an increase in the price of alcohol will lead to a reduction in the incidence of violence. We also examine the effects of the prevalence and ease of obtaining alcohol and illegal drug prices on physical child abuse. Reduced form equations for the probability of violence are used, and equations are estimated separately for violence committed by mothers and fathers. Results indicate that increases in the tax on beer may decrease the incidence of violence committed by females. The evidence on violence by males is inconclusive. The other drug and alcohol regulatory variables seem to have no effect on the probability of violence.
Ž .
In an earlier paper Markowitz and Grossman, 1998a using the 1976 National
Ž .
Family Violence Survey NFVS , we show that increasing the state excise tax on beer is an effective policy tool in reducing both the probability and frequency of violence towards children. In addition, we show some evidence that restrictions on the availability of alcohol may decrease violence. We refer the reader to this previous study for background on the motivation for this current study, and for discussions on evidence on the relationship between alcohol and violence, the theories behind this observed positive relationship, and a review of the relevant literature.
This current study expands upon our previous work on the effects of alcohol regulation on child abuse in two important ways. First, we perform the analyses separately by gender of the parent, and second, we add data from another comparable survey conducted 10 years later: the 1985 NFVS. The separation by gender is important because of different observed patterns of drinking and violence by men and women. For example, studies have shown that men are more
Ž
likely than women to become violent when drinking see Fagan, 1990 and the
.
references therein . This may imply that price increases have larger impacts on violence by males than females, holding all other things equal. In addition, some studies have shown that females drink less than males and are more price-sensitive
ŽKenkel, 1993; Moore and Cook, 1995 , implying that price increases may have.
larger reductions on violence by females than males, holding all other things equal.
( )
S. Markowitz, M. GrossmanrJournal of Health Economics 19 2000 271–282 273 2. Analytical framework and data
A reduced form violence equation is used as the basis for empirical estimation. For a complete derivation of the model, we refer the reader to Markowitz and
Ž .
Grossman 1998b . In short, the reduced form equation comes from a structural relationship between violence and alcohol consumption, the latter of which is determined by the full price of alcohol. Substituting consumption for its exogenous price determinants gives the reduced form equation where violence is a direct function of the full price of alcohol.
Data on violence aimed at children come from the 1976 and 1985 NFVS. The 1976 data consist of a nationally representative sample of 1147 married or cohabiting individuals with children ages 3–17 living at home. The 1985 data are a nationally representative sample of 2675 married, cohabiting, or single parents who have children ages 0–17 living at home. Measures of domestic violence in
Ž .
the NFVS surveys are collected by use of the ‘‘Conflict Tactic Scale’’ CTS . The dependent variable, termed the ‘‘severe violence’’ indicator, is a dichotomous indicator which equals 1 if the respondent committed any of the following acts towards a randomly chosen child in the household in the past year: kicked, bit or hit with fist; hit or tried to hit with something; beat up the child; burned or scalded
Ž . 1
himrher 1985 survey only ; threatened with or used a gun or knife on the child. These acts were chosen because they have the potential to seriously injure a child, and the designers of the CTS identify these acts as most closely resembling what is commonly thought of as child abuse. We refer the reader to our previous papers
Ž .
and to Straus and Gelles 1990 for discussions about variations on the definition of the dependent variable and the reliability of the responses.
Simple means of the data show that 18.0% of women in the 1976 sample and 11.4% of women in the 1985 sample responded that they had committed at least one of the acts in the severe violence scale in the past year. These numbers represent a downward trend in violence by women since these proportions are statistically different from each other. The comparable numbers for men are 10.1% in the 1976 data and 9.4% in the 1985 data. There is no statistical difference in rates of violence by men across years. Hypothesis tests of the proportions by gender also reveal that females are more violent than men in both years, but the null hypothesis can only be rejected at the 10% level in the 1985 sample.
The primary independent variable of interest is the price of alcohol which is
Ž .
measured by the real 1982–1984 dollars state excise tax rate on a case of beer
Ž24 12-oz cans . This measure was chosen because beer is the most commonly.
consumed alcoholic beverage and because the tax is the only price data available
1
( ) S. Markowitz, M. GrossmanrJournal of Health Economics 19 2000 271–282
274
for both years of the survey.2 The 1976 survey was conducted in the first quarter of 1976, but pertained to violence in the past year; therefore, the beer tax was taken from 1975. The 1985 survey was conducted during the summer of 1985, so the tax on beer was taken as an average of the tax rates that existed in the first two quarters of 1985 and the last two quarters of 1984. In the discussion of the results below, it is important to note that there is substantial variation in the nominal tax rate across time. Results stemming from variation due to only a few states with large changes in tax rates would be much less trustworthy. Of the 36 states which are included in both years of the survey, 20 states increased their nominal tax rate on beer between 1975 and 1985. The mean nominal tax in 1976 was US$0.47, and the average increase was US$0.10 with a standard deviation of $0.17.
A variety of measures are included to represent the availability and prevalence of alcohol in each state which contribute to the full price of alcohol. Dichotomous indicators are included for whether a state prohibits each of the following: price advertising of beer in newspapers and magazines; billboards advertising beer; window displays of signs, packages and products in liquor stores; consumer novelty giveaways; and grocery store sales of beer. The percentage of each state’s population living in counties that are dry for beer and the number of retail outlets per 1000 population that are licensed to sell alcoholic beverages for on-premise or off-premise consumption are also included. Finally, the price of 1 g of pure cocaine and a dichotomous indicator for whether a state decriminalized marijuana are included. These drug prices are included because there is some evidence that drugs may lead to violence and because drugs and alcohol may be complementary
Ž .
goods Saffer and Chaloupka, 1999 . The reader is referred to our previous work for sources and further explanations of all of the independent variables.
All models include variables which capture the individual and household characteristics of the respondent. Dichotomous indicators are included to represent whether or not the respondent’s parents used physical punishment on the respon-dent and if the responrespon-dent’s parents hit or threw things at each other during the respondent’s teenage years. Measures of stressful lifestyles are also included, although there are differences in the wording of stress questions in the 2 survey years so these variables are omitted from models which pool the two cross-sec-tions. The respondent’s age, gender, race, education, income, occupation,
employ-Ž
ment status, religion, frequency of religious service attendance in the 1976
. Ž
cross-section only , an indicator for whether the respondent is a single parent in
.
1985 only , the number of children at home, and the child’s gender and age are included in all models.
2
The most commonly used data on beer prices come from the American Chamber of Commerce Research Association’s Inter-City Cost of LiÕing Index; however, beer prices are not available for 1975
( )
S. Markowitz, M. GrossmanrJournal of Health Economics 19 2000 271–282 275 3. Estimation and results
The probability of participation in violence is specified as a probit function and depends on the full price of alcohol, the price of illegal drugs, and the individual characteristics. For reasons discussed above, models are estimated separately for males and females. Likelihood ratio tests on all of the independent variables in each of the two surveys reveal that the two sexes should not be pooled.3 In addition, models which include interaction terms between gender and all the
Ž
independent variables show that coefficient on the interaction for the beer tax the
.
coefficient of interest in this paper and gender is insignificant in the 1976 data but significant in the 1985 data. This implies that at least in the 1985 data, there are differences in the tax coefficients for males and females.
Two basic models are estimated. The first model contains the state excise tax rate on beer and the individual characteristics. The second adds to the first all the price, advertising, and availability measures. One potential problem is that the effects of state-specific regulatory variables will reflect unobserved state sentiment towards violence andror drinking. This issue is addressed by including models which pool the two cross-sections, thus allowing for state fixed-effects to be added. Only states that appear in both years are included in the pooled models. The primary advantage of including state dummies is to capture the culture of drinking in each state. This culture may affect the level of alcohol regulation, and if not accounted for, may be correlated with the included variables and could lead to biased estimates of the tax and the other regulatory variables. One limitation of the fixed effects is that because of the small sample size, there is an average of 58 females and 39 males in each of the 36 states. There simply may not be enough variation in violence among states to estimate statistically significant results for each state dummy.
The inclusion of state dummies does not control for unobserved state effects that vary over time. Thus, models were tested that include the state unemployment rate to capture the impacts of state-specific trends. In all models, however, the coefficient of the unemployment rate is not statistically significant and the
Ž
inclusion of this variable has no effect on the other coefficients results not
.
shown .
Table 1 shows the effectiveness of increases in the beer tax in reducing the probability of severe violence by gender and year. Given that the measures of alcohol control are the variables of interest, the individual characteristics included in each model are not shown in the tables. Results of the individual characteristics
3
()
S.
Markowitz,
M.
Grossman
r
Journal
of
Health
Economics
19
2000
271
–
282
276
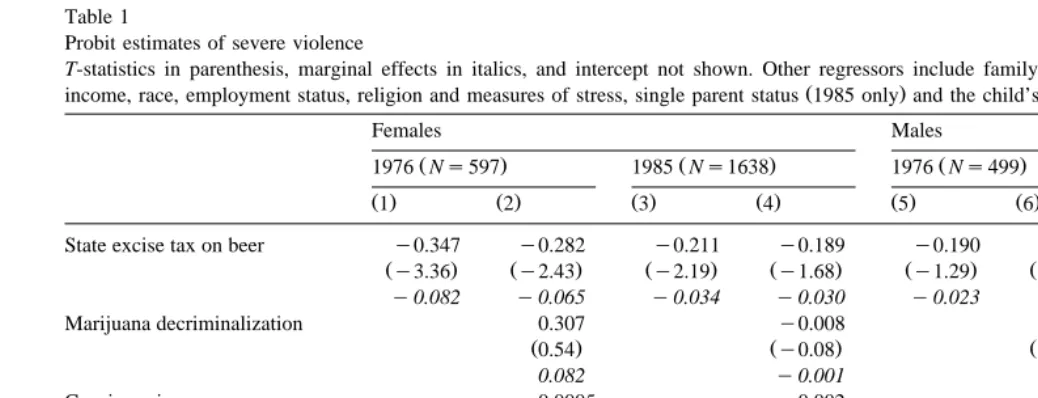
Table 1
Probit estimates of severe violence
T-statistics in parenthesis, marginal effects in italics, and intercept not shown. Other regressors include family history of violence, the respondent’s age,
Ž .
income, race, employment status, religion and measures of stress, single parent status 1985 only and the child’s age and sex.
Females Males
Ž . Ž . Ž . Ž .
1976 Ns597 1985 Ns1638 1976 Ns499 1985 Ns1037
Ž .1 Ž .2 Ž .3 Ž .4 Ž .5 Ž .6 Ž .7 Ž .8
State excise tax on beer y0.347 y0.282 y0.211 y0.189 y0.190 y0.004 0.228 0.296
Žy3.36. Žy2.43. Žy2.19. Žy1.68. Žy1.29. Žy0.02. Ž2.04. Ž2.17.
y0.082 y0.065 y0.034 y0.030 y0.023 y0.0005 0.017 0.019
Marijuana decriminalization 0.307 y0.008 y0.232 0.110
Ž0.54. Žy0.08. Žy0.28. Ž0.78.
0.082 y0.001 y0.021 0.007
Cocaine price 0.0005 y0.002 y0.002 y0.001
Ž0.53. Žy1.67. Žy1.51. Žy0.55.
0.0001 y0.0003 y0.0002 y0.0001
Number of outlets 0.262 y0.057 0.261 0.138
Ž1.75. Žy0.59. Ž1.50. Ž1.06.
0.061 y0.009 0.029 0.009
Percent dry y0.021 0.001 0.010 0.012
Žy1.86. Ž0.18. Ž0.66. Ž1.62.
()
S.
Markowitz,
M.
Grossman
r
Journal
of
Health
Economics
19
2000
271
–
282
277
Grocery sales of beer prohibited 0.117 0.357 y0.171 y0.067
Ž0.30. Ž1.38. Žy0.25. Žy0.17.
0.029 0.070 y0.171 y0.004
Billboards prohibited 0.168 y0.081 0.059 y0.464
Ž0.47. Žy0.37. Ž0.13. Žy1.38.
0.042 y0.013 0.007 y0.023
Window displays prohibited y0.478 y0.015 0.268 y0.075
Žy1.76. Žy0.11. Ž0.80. Žy0.39.
y0.098 y0.002 0.033 y0.005
Consumer novelties prohibited 0.327 0.135 y0.331 0.830
Ž1.10. Ž0.43. Žy0.78. Ž2.09.
0.085 0.023 y0.031 0.106
Price advertising prohibited 0.115 y0.065 y0.145 y0.022
Ž0.73. Žy0.33. Žy0.68. Žy0.08.
0.027 y0.010 y0.015 y0.001
( ) S. Markowitz, M. GrossmanrJournal of Health Economics 19 2000 271–282
278
Ž .
are discussed in Markowitz and Grossman 1998b . Beginning with the 1976 sample of females, the results show that the coefficients on the beer tax in both models are negative and significant.4 Specifically, a 1% increase in the tax on
Ž
beer will decrease the probability of violence by about 0.33% which is a simple
.
average of the elasticities of the two models . Tax elasticities are calculated by multiplying the marginal effects by the ratio of the average tax to the proportion of respondents who are violent.
Column 2 of Table 1 shows that the number of outlets licensed to sell liquor is positive and significant, indicating that an increase in the number of outlets will increase the probability of violence towards children. In addition, increases in the percentage of a state living in dry counties will reduce violence. The prohibition of the sale of beer in grocery stores and the drug prices do not explain any of the variation in violence, nor do three of the four advertising restrictions.
Violence by female respondents in the 1985 sample is also responsive to changes in the state excise tax rate on beer, with an average elasticity ofy0.13. The results also show that severe violence by women in 1985 is sensitive to the
Ž .
price of cocaine at the 10% level in a two-tailed test , whereas the same does not hold true for females in 1976. Another contrast to the 1976 data is that in 1985, the availability and advertising measures appear to have no impact on the probability of severe violence committed by women in 1985. This result is surprising, given the larger sample size in the 1985 data.
Columns 5–8 of Table 1 show results from the 1976 and 1985 cross-sections for males. In the 1976 cross-section, the coefficient on the beer tax is negative and significant at the 10% level in the model that includes only the beer tax and the individual characteristics. However, this effect is greatly reduced when the other control variables are added. The coefficients on the beer tax in the 1985 data are surprisingly positive and significant in both models. There is also no evidence that the other regulatory variables may be effective in reducing violence by males. In both years, almost none of the drug prices, availability measures, or advertising variables is statistically significant in reducing the probability of violence, al-though the signs of the availability measures are as anticipated in both years.
Turning next to the pooled results in Table 2, one may question the validity of pooling two sets of data which are 10 years apart. It is quite plausible that the slope coefficients for many, if not all, of the variables had changed over the sample period. A likelihood ratio test for pooling is performed, and for males, the test reveals that the 2 years should not be pooled. For females, the test shows that only the more inclusive model can be pooled. However, most of these results against pooling are being driven by the individual, household, and child
character-4
()
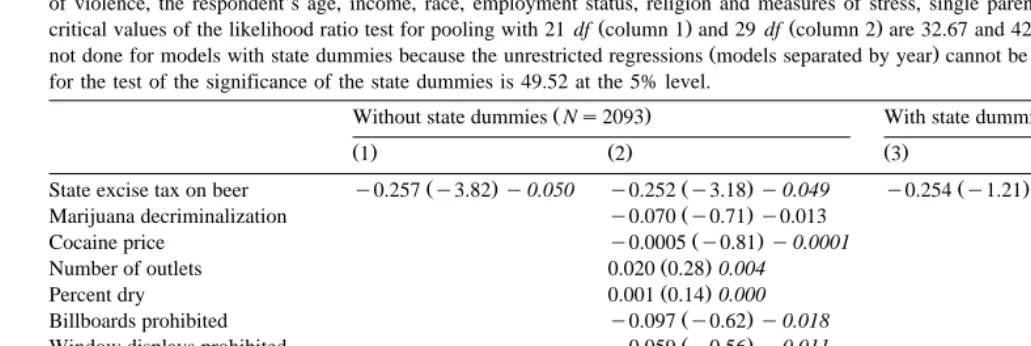
Pooled years probit estimates of severe violence by females
T-statistics in parenthesis, marginal effects in italics, p-values in brackets for chi-squared test, and intercept not shown. Other regressors include family history
of violence, the respondent’s age, income, race, employment status, religion and measures of stress, single parent status, and the child’s age and sex. The
Ž . Ž .
critical values of the likelihood ratio test for pooling with 21 df column 1 and 29 df column 2 are 32.67 and 42.56, respectively. Likelihood ratio tests are
Ž .
not done for models with state dummies because the unrestricted regressions models separated by year cannot be run with state dummies. The critical value for the test of the significance of the state dummies is 49.52 at the 5% level.
Ž . Ž .
Without state dummies Ns2093 With state dummies Ns2093
Ž .1 Ž .2 Ž .3 Ž .4
Ž . Ž . Ž . Ž .
State excise tax on beer y0.257 y3.82 y0.050 y0.252 y3.18 y0.049 y0.254 y1.21 y0.048 y0.255 y1.09 y0.048
Ž . Ž .
Marijuana decriminalization y0.070 y0.71 y0.013 y0.038 y0.20 y0.007
Ž . Ž .
Cocaine price y0.0005 y0.81 y0.0001 0.001 0.62 0.0002
Ž . Ž .
Number of outlets 0.020 0.28 0.004 0.660 1.17 0.123
Ž . Ž .
Percent dry 0.001 0.14 0.000 0.028 0.88 0.005
Ž . Ž .
Billboards prohibited y0.097 y0.62 y0.018 y0.510 y1.58 y0.076
Ž . Ž .
Window displays prohibited y0.059 y0.56 y0.011 0.589 1.77 0.130
Ž . Ž .
Consumer novelties prohibited y0.101 y0.61 y0.018 y0.329 y1.14 y0.051
Ž . Ž .
Price advertising prohibited 0.122 1.23 0.024 0.073 0.37 0.014
Ž . Ž . Ž . Ž .
1976 0.361 3.84 0.076 0.520 1.88 0.113 0.355 3.08 0.073 0.007 0.01 0.001
Log likelihood y760.263 y757.149 y745.207 y742.068
Likelihood ratio test for pooling 52.62 39.71
w x w x
Chi-squared on state dummy 28.63 0.768 28.31 0.781
( ) S. Markowitz, M. GrossmanrJournal of Health Economics 19 2000 271–282
280
istics, for in models that include interaction terms between all the independent variables and a dummy for 1985, there is evidence that the coefficient on the real beer tax does not change between the 2 years. This result holds for the sample of women in models that include and exclude the state dummies. For men, the same conclusion holds only for the models that include the state dummies. Since the models without the state dummies for males cannot legitimately be pooled, the pooled models are only shown for women.
Table 2 shows the pooled results for females only. For females, the cross-sec-tional analyses showed separately that increases in the beer tax would reduce the probability of violence towards children. Not surprisingly then, the pooled sample
Ž
exclusive of the state fixed-effects shows the same results see columns 1 and 2 of
.
Table 2 . The tax elasticity isy0.22 in the model in column 1 and isy0.21 in the model in column 2. These are comparable to the average elasticity derived from the two cross-sections, which is y0.23. It is interesting to note that pooling the sample and thereby increasing the sample size does not result in measurable effects of the advertising or availability measures on violence, even though in the 1976 cross-section, both the percent dry and the number of licensed outlets were significant.
When the state dummies are added to the models in columns 1 and 2 in Table 2, the coefficients on the beer tax remain negative, but are not statistically
Ž .
significant see columns 3 and 4 . However, the magnitudes of the coefficients and marginal effects are largely unaffected by the inclusion of the state dummies. Given that as a set, the state dummies are not significant, these results most likely reflect collinearity between the state dummy variables and the state-specific tax on beer. Including regressors that have no explanatory power but are correlated with other included regressors, serve only to inflate the variance of the estimator
ŽGreene, 1997, p. 404 . In other words, it is likely that the state dummies do not.
capture any unobserved state sentiment towards drinking or violence; rather, they act as irrelevant included variables that are correlated with the beer tax. This last statement is verified by running models which exclude the beer tax but include the state dummies along with the individual characteristics. If the state dummies in such a model are significant, then the beer tax could be considered as the irrelevant included variable and it would be hard to attribute reductions in violence to increases in the beer tax. This is not the case, however, for in models which w exclude the beer tax, the state dummies remain insignificant. The chi-square p
x w x
value on the set of state dummies is 40.17 0.25 in the model that includes only w x
state dummies and individual characteristics, and is 35.96 0.42 in the model that adds the other state-specific alcohol and drug control variables. The critical value for a chi-square with 35 df is 49.52 at the 5% level.
( )
S. Markowitz, M. GrossmanrJournal of Health Economics 19 2000 271–282 281 odds with the results of this paper. However, as shown in Table 2, the downward trend in violence by women can be accounted for by including a dummy for time
Ž1976s1 , which has a positive and statistically significant coefficient in the.
models without the state dummies. These are the relevant specifications since the
Ž .
state dummies are not significant. Gelles and Cornell 1990 point to a variety of factors that can account for the reduction in child abuse over time. Since 1976, individuals have begun to marry and have children later in life and have fewer unwanted children. The importance of the last factor is underscored by noting that most of the children in the 1976 survey were born before abortion became legal and widely available throughout the U.S. in 1973, while almost all the children in the 1985 survey were born after abortion was legalized. This argument is
Ž .
consistent with findings by Gruber et al. 1999 that children born after the legalization of abortion experienced reductions in a variety of adverse outcomes. Finally, there has also been increased awareness and expansion of child abuse treatment and prevention programs.
Acknowledgements
Research for this paper was supported by grant no. 1 R01 AA10817 from the National Institute on Alcohol Abuse and Alcoholism to the NBER. We are indebted to Philip J. Cook, Jeffrey DeSimone, Linda N. Edwards, Theodore J. Joyce, Robert Kaestner, Donald S. Kenkel, Joseph P. Newhouse, Helen V. Tauchen, and two anonymous referees for helpful comments. This paper has not undergone the review accorded official NBER publications; in particular, it has not been submitted for approval by the Board of Directors.
References
Children of Alcoholics Foundation, 1996. Helping children affected by parental addiction and family violence: collaboration, coordination, and cooperation. Children of Alcoholics Foundation, New York.
Ž .
Fagan, J., 1990. Intoxication and aggression. In: Tonry, M., Wilson, J.Q. Eds. , Drugs and Crime: Crime and Justice, A Review of Research, Vol. 13. The University of Chicago Press, Chicago, pp. 241–320.
Gelles, R.J., Cornell, C.P., 1990. Intimate Violence in Families. Sage Publications, Newbury Park, CA. Greene, W.H., 1997. Econometric Analysis. Prentice-Hall, Upper Saddle River, NJ.
Gruber, J., Levine, P., Staiger, D., 1999. Abortion legalization and child living circumstances: who is the marginal child?. Quarterly Journal of Economics 114, 263–291.
Kenkel, D.S., 1993. Drinking, driving, and deterrence: the effectiveness and social costs of alternative policies. Journal of Law and Economics 36, 877–913.
( ) S. Markowitz, M. GrossmanrJournal of Health Economics 19 2000 271–282
282
Markowitz, S., Grossman, M., 1998b. The effects of alcohol regulation on physical child abuse. NBER Working Paper No. 6629.
Moore, M.J., Cook, P.J., 1995. Habit and heterogeneity in the youthful demand for alcohol. NBER Working Paper No. 5152.
Saffer, H., Chaloupka, F., 1999. The demand for illicit drugs. Economic Inquiry 37, 401–411. Straus, M.A., Gelles, R.J., 1990. Physical Violence in American Families: Risk Factors and