Market restructuring and pricing in the
hospital industry
Ranjani Krishnan
∗Eli Broad School of Business, Michigan State University, N251 North Business Complex, East Lansing, MI 48824, USA
Accepted 20 September 2000
Abstract
This paper examines the diagnosis related group-level (DRG) price effects of recent hospital mergers and acquisitions that occurred in Ohio and California. Empirical results indicate that hos-pital mergers and acquisitions increase prices at the DRG level. Further, price increases are greater in DRGs where the merging hospitals gained substantial market share compared to DRGs where the merging hospitals did not gain significant market share. These results suggest that DRG specific market share plays an important role in a hospital’s post-merger pricing strategy. © 2001 Elsevier Science B.V. All rights reserved.
JEL classification: D40; I11; L80
Keywords: Mergers and acquisitions; Market share; Hospitals; DRG analysis
1. Introduction
Regulators are often concerned that merger related increases in market power can ad-versely affect consumers through higher prices, while merging firms usually claim that efficiency gains and cost reductions from the merger will lead to lower prices. The price effects of mergers are of great current relevance in the US hospital industry. In response to changes in the Medicare reimbursement system, the rise of managed care, and declining patient reimbursements, the hospital industry has undergone significant restructuring in re-cent years. Over 45% of the US hospitals have been involved in mergers, acquisitions, and joint ventures since 1990 (Jaspen, 1998).
Many of the recent horizontal within-market hospital mergers and acquisitions have caused large increases in the market share of the merging hospitals. For example, two
merg-∗Tel.:+1-517-353-4687; fax:+1-517-432-1101. E-mail address: [email protected] (R. Krishnan).
ers in Cincinnati in 1994 caused the Herfindahl–Hirschman index1 (HHI) in the Cincinnati market to increase from 1238 in 1993 to 2102 in 1995. Similarly, mergers and acquisitions in the Pittsburgh market caused the Pittsburgh HHI to increase from 763 in 1990 to 3506 in 1998. As per the 1992 Horizontal Merger Guidelines issued by the Department of Justice (DOJ) and the Federal Trade Commission (FTC), the above examples represent large in-creases in market concentration (Bazzoli et al., 1995). This study examines the price effects of recent hospital mergers and acquisitions.
In addition to local within-market mergers, several across-market acquisitions have also occurred. Across-market integration is the merger of two or more firms producing the same product in different markets, as in the case of regional or national hospital chains and networks2 (Snail and Robinson, 1998). Prior studies have not examined the price effects of across-market acquisitions separately from within-market mergers.
This study examines price effects of hospital mergers and acquisitions at the level of the individual diagnosis related group (DRG).3 Data from mergers and acquisitions that occurred in the states of Ohio and California during the period 1994–1995 are used to analyze the post-merger price changes for individual DRGs within hospitals. For the Ohio within-market mergers, three different types of analyses are conducted. First, the change in prices for DRGs where the merging hospitals gained substantial market share from the merger is compared to the change in prices for DRGs where the merging hospitals did not gain substantial market share.4 Second, the change in prices for merging hospitals in DRGs where they gained substantial market share from the merger is compared to the change in prices for an identical set of matched DRGs from a non-merging hospital located in the same hospital market. Third, the change in prices for merging hospitals for high-volume DRGs is compared to the change in prices for all non-merging hospitals for the same DRGs. For the California across-market acquisitions, the changes in prices of high-volume DRGs for acquired hospitals are compared with the changes in prices for hospitals which were not acquired.
The general finding from this study is that hospital mergers and acquisitions result in increased prices at the DRG level. These results were found at all the levels of analyses and indicate that merging and acquired hospitals increased prices for all DRGs to a greater extent than non-merging hospitals. The results also indicate that price increases were greater in DRGs where the hospital gained substantial market share suggesting that DRG-specific market-share has an important role in a hospital’s post-merger pricing strategy.
1The Herfindahl–Hirschman index (HHI) is frequently used to measure market concentration and is defined as
the sum of squares of the market shares (measured as percentages) of all the firms operating in the market (Martin, 1994). Higher HHI implies lower competition.
2Examples of such acquisitions include the 1994 Columbia–HCA acquisition of Memorial Medical Center
of Jacksonville, Tenet acquisition of the 357 bed North Shore Medical Center in Miami (1995), and the 1996 Columbia–HCA acquisition of the Good Samaritan Health system (four hospitals with a total of 815 beds) in San Jose. None of these across-market acquisitions altered local market concentration ratios.
3DRGs are a set of case types established under the Medicare Prospective Payment System (PPS) identifying
patients with similar conditions and processes of care. There are currently 495 DRGs in Medicare’s PPS (Folland et al., 1997).
4California hospitals are not used in the within-market analysis because the consolidation activity was primarily
The remainder of the paper is divided into four sections. Section 2 reviews existing liter-ature on hospital market competition. Section 3 outlines a descriptive model of DRG-level pricing. Section 4 describes the data used in this study. Section 5 discusses the methodology and results. Finally, Section 6 discusses conclusions and implications.
2. Hospital market competition, prices, and cost
Recent empirical studies examining the relationship between hospital market competi-tion, prices, and costs, have found mixed results. Some studies found that the greater the competition, the lower are the prices (Dranove and Ludwick, 1999; Dranove et al., 1993; Keeler et al., 1999; Melnick et al., 1992), whereas others found the opposite result (Connor et al., 1997, 1998; Lynk, 1995).
Dranove et al. (1993) argue that institutional changes since 1983 such as managed care and Medicare PPS, have caused a shift from “patient driven” competition to “payer driven” competition. They hypothesized that this shift reduces hospitals’ price-cost margins and contribute to a positive relationship between concentration and prices. Using data for hos-pitals in California for the period 1983–1988, they find that margins are lower in markets where there is greater competition (lower concentration). They also find that technology intensive hospitals with high market share have greater market power as evidenced by their higher markups. Melnick et al. (1992) examine the final prices negotiated between Blue Cross of California and the hospitals in its PPO network. They find that Blue Cross paid lower prices to hospitals in more competitive markets.
More recently, Keeler et al. (1999) use cross-sectional data for the periods 1986–1994 and examine the relationship between market concentration and prices for hospitals in California. They construct hospital markets based on patient-flows and show that prices are higher in less-competitive hospital markets, even for not-for-profit hospitals. They also simulate the effects of hospital mergers and show that mergers may result in price increases up to 26%. Similarly, Dranove and Ludwick (1999) examine the relationship between prices and concentration, using a sample of nonprofit hospitals in California and use their results to simulate the effects of mergers. Their results indicate that nonprofit mergers are associated with higher prices.
This paper makes the following contributions to the study of price effects of hospital mergers. First, price effects are examined at the level of the individual DRG thus providing a more micro-level analysis. Results from this study have implications for antitrust policy towards hospital mergers. For example, it raises the question whether antitrust examination of hospital mergers should be restricted to hospital-level market share gains, or should DRG-specific market share gains also be scrutinized?
Second, this study performs a longitudinal pre–post event study of the price effects of hospital mergers and acquisitions. Most of the prior studies (with the exception of Connor et al., 1997, 1998) are cross-sectional studies of the relationship between price and a measure of concentration, such as the Herfindahl index (Dranove et al., 1993; Lynk, 1995). By controlling for other factors that may affect prices, longitudinal studies provide a more direct test of the effects of mergers.
Third, earlier studies have mostly focused on the hospitals located in California. While the California hospital market has indeed witnessed significant restructuring over the last few years, many other states have had similar restructuring which warrant empirical ex-amination. In this study, I analyze mergers that occurred in Ohio, in addition to those that occurred in California.
Fourth, within-market hospital mergers are examined separately from across-market ac-quisitions. Across-market acquisitions have a different impact on the local market structure compared to within-market mergers because they do not alter the local market concentration but only change ownership patterns. The across-market acquisitions analyzed in this paper consist primarily of acquisitions of stand-alone hospitals by multi-hospital systems such as Columbia–HCA. Separate analysis of the effects of within and across market restructuring is hence informative in understanding whether acquisitions by systems have any effects on prices.
Finally, this study uses the Makuc et al. (1991) construction of hospital markets which are based on actual patient flows. Several of the prior studies have used geo-political (Farley, 1985; Frank and Salkever, 1991; Lynk, 1995), population based (Dranove et al., 1993), or distance based measures (Patel et al., 1994; Robinson and Luft, 1985, 1988). These geo-political or distance based definitions suffer from several limitations. For example, if a county definition were used, two adjacent hospitals belonging to different counties would be considered to operate in different markets which understates the degree of competition for hospital services. Similarly, a hospital operating close to a county border can derive demand from patients outside the county border. Keeler et al. (1999) discuss several other limitations of county-based markets.
3. DRG-level price setting
In addition to reducing noise, the DRG-level analysis of mergers is useful because hos-pitals are more likely to compete for patients at the diagnosis/clusters of diagnoses level (Brooks et al., 1997). In an empirical study of hospital-insurer bargaining, Brooks et al. (1997) argue that lumping all hospital admissions together in hospital price calculations could be misleading because of the considerable variation in the mix of services that are performed by individual hospitals in any given market area. For example, a hospital cializing in cardiac surgery may not be in competition with a neighboring hospital that spe-cializes in oncology. Brooks et al. present a theoretical model based on bargaining models of Svejnar (1986), Harsanyi (1956), Zeuthen (1930) and Nash (1950, 1953) and empirically examine the factors that determine the prices negotiated between insurers and hospitals for one specific medical procedure (appendectomy). Their empirical results indicate that in-creased hospital concentration leads to greater hospital bargaining power reflected in higher prices.
Prior studies examining hospital pricing behavior use the aggregate hospital (e.g. Connor et al., 1997; Manheim et al., 1994) or a selected small sample of DRGs (e.g. Dranove and Ludwick, 1999; Dranove et al., 1993; Keeler et al., 1999; Lynk, 1995) as the unit of analysis. Examining price effects at the diagnosis level is important because a merger may increase a hospital’s market share and bargaining power for one set of DRGs but not for other DRGs. Hence, hospitals may increase or decrease prices selectively in those DRGs where they gain market share, and aggregate hospital-level prices may underestimate the influence of market share on prices.
This study examines the effects of mergers and acquisitions on prices for all DRGs, and also for a selected sample of 23 high-volume DRGs. The following model is estimated:
Change in priceij=f (Xij, Yj, Di, Hj) (1)
The dependent variable Change in priceij is the change in net inpatient price for DRGi at
hospital j, Xij a set of characteristics specific to DRGi at hospital j such as length of stay
and number of discharges, Yja set of hospital-specific characteristics such as the proportion
of patients from managed care plans, Dia set of DRG dummies, and Hj a set of j hospital
dummies.
4. Data sources
I identified hospitals that were involved in mergers or acquisitions during the year 1994–1995 (1 July 1994 to 30 June 1995) using past issues of the publication Modern
Healthcare. This list was then verified with State Health Department publications from
California and Ohio.
I used market definitions based on the actual flow of patients into hospitals, as constructed by Makuc et al. (1991). The Makuc et al. study uses patient origin data5and employs cluster analysis to group counties into service areas. Their analysis divides the entire country into approximately 800 Health Service Areas (HSA) that are relatively self-contained with respect to the provision of routine hospital care. Some recent hospital studies such as Connor et al. (1998) have used the Makuc et al. markets.
Similar to Snail and Robinson (1998), I defined a within-market hospital merger as a transaction that involves two merging hospitals located in the same local hospital market. Hence, the local market Herfindahl index (HHI) changes after a within-market merger. An across-market acquisition was defined as a transaction in which the acquiring hospital and the target were located in different hospital markets. Typically, the local market concen-tration ratio does not change after an across-market acquisition except in cases where the acquiring hospital acquires more than one hospital from the same market during the same period.
I analyzed data from mergers and acquisitions that occurred in Ohio and California during the period 1994–1995.6 For Ohio, I used DRG-level data from 110 hospitals in 28 hospital markets, including 22 hospitals that were involved in a within-market merger during 1994–1995. For California, I examined DRG-level and hospital-level data from 108 hospitals in 10 hospital markets, including 15 hospitals that were acquired during the period 1994–1995. Because of the large number of hospitals in California, only hospitals located in hospital markets with mergers and acquisitions were used. Only nonprofit hospitals were included in the Ohio analyses because the Ohio market had only few, relatively small for-profit community hospitals during the period of the study and all the hospital mergers that occurred were between nonprofit hospitals. For both states, only general hospitals were included. Specialty hospitals, psychiatric hospitals, children’s hospitals and hospitals belonging to the Veterans Hospital Administration (VHA) system were excluded. Eight hospitals from Ohio and 15 hospitals from California were excluded because they had been involved in mergers, acquisitions, or joint ventures during the period 1991–1993.
For Ohio, I obtained DRG-level data on the number of discharges, charges, and length-of-stay from the Ohio Department of Health. In addition, hospital-level financial data such as, gross in-patient revenue and net patient revenue were obtained from the on-line sub-scription database of the “Center for Health-Care Industry Performance Studies” (www. chipsonline.com). For California, patient-level discharge data and hospital-level financial disclosure data were obtained from the Office of State Health Planning and Development (OSHPD).
5Their study uses Medicare patient flows. The assumption is that this approximates the flow for all patients,
including those covered by other insurance plans.
5. Methodology and empirical results
5.1. Within-market Ohio mergers
Three types of analyses are conducted for the Ohio mergers. The first (within-hospital analysis) compares price changes across DRGs within the same hospital, the second (between-hospital analysis) compares price changes for the same DRGs from merging and non-merging control hospitals located in the same hospital market, and the third compares changes in prices for high volume DRGs of merging and all non-merging hospitals.
5.1.1. Within hospital DRG level analysis
This analysis examines the differences in pricing strategies used by the individual merging hospital for those DRGs that gained substantial market share (treatment group) relative to the DRGs that did not gain significant market share (control group). The advantage of having a control group consisting of DRGs from the same hospital is that the price changes in DRGs not affected by the merger should reflect not only industry-wide factors and market-wide factors that affect prices, but also hospital-specific factors, including those unrelated to the merger. Thus, price changes for DRGs in the treatment group relative to those in the control group can be attributed primarily to the merger.7 In addition, this analysis seeks to determine if hospitals use DRG-specific market share in their pricing decisions.
A total of 22 merging hospitals in Ohio were used in the analyses. The treatment set of DRGs include those for which the merged entity’s combined market shares increased by 20 percentage points or more relative to the larger8 of the merging hospitals excluding DRGs where the merging hospitals became monopolies after the merger. The 20 percentage point cut-off was selected to capture the effects of a major increase in market share.9 The control set of DRGs include those where the merged entity’s combined market shares changed by<5 percentage points after the merger, relative to the larger of the merging hospitals. I used a 5 percentage point cut-off because in most hospital markets it generally represents a small increase in market share. Comparison of the differences in pre-merger and post-merger prices of the treatment and control DRGs should provide information on the effect of change in market share on change in prices. This analysis uses market share instead of the more traditional HHI because market-share is a firm-level variable while HHI is a market-level variable. For example, if an increase in HHI leads to an increase in mean prices in the hospital market then it would be hard to determine whether the merging hospitals alone increased prices or whether all the hospitals in the market increased prices.
7Kim and Singal (1993) use a similar technique in their analysis of airline mergers. They examine the change in
prices on routes which had large increases in concentration with the routes where there were smaller increases in concentration.
8The reason for considering the increase in post-merger market share of the merged entity relative to the
pre-merger market share of the hospital with the larger market share is that this measures the increase in market share relative to the hospital which already had some market power.
The dependent variable, Relative price change, is computed as follows:
Relative price change=log Price
t a
Pricetb
!
−log
Pricec a
Pricecb
(2)
where Pricetais the average price of merged hospital for DRG in treatment group, after the merger; Pricetbthe average price of merging hospitals for DRG in treatment group, before the merger; Pricecathe average price of merged hospital for DRG in control group, after the merger; Pricecbthe average price of merged hospital for DRG in control group, before the merger.
If log(Priceta/Pricetb) > log(Priceca/Pricecb), i.e. Relative price change is >0, then it implies that the hospital uses a market share based pricing strategy for individual DRGs.
Because I used only 1994–1995 mergers, the pre-merger prices are the mean prices for the year 1993–1994, and the post-merger prices are the mean prices for the year 1995–1996. For the merged hospital a weighted-average price for each DRG is constructed for the pre-merger year where the weights are the number of patients discharged at each hospital in the given DRG.10
Much like Dranove and Ludwick (1999), Keeler et al. (1999) and Lynk (1995), I calculated price at the DRG level by multiplying the DRG-level mean charge by the average discount factor for privately insured patients at the hospital. Because DRG-level discounts were not available, the average hospital-level discount factor is used. The overall discount rate may understate the results, because market power can also be exercised in the form of reduced discounts.
Only prices for non-government patients (i.e. commercial insurance and self-pay) were used for the analyses.11 I examined two types of price measures: price per inpatient (dis-charge) and price per patient day. Price per patient reflects the total price for the entire episode. The merit of this measure is that it incorporates any changes in price that may be driven by a shorter or longer length-of-stay (LOS). However, price per patient has a higher variance than price per patient day because of differences in LOS across different DRGs and across different hospitals. The price per patient day measure controls for differences in length of stay between different hospitals and across different DRGs.
Market shares are constructed at the DRG-level, using the total inpatient admissions for the hospital in that DRG as a proportion of total market admissions for the DRG. Patients discharged from specialty hospitals, psychiatric hospitals, children’s hospitals, and hospitals belonging to the Veterans Hospital Administration system were not included in the computation of total market admissions. Only non-governmental patients (i.e. commercial insurance and self-pay) were used in the construction of market shares.
Panel A of Table 1 summarizes the results for the within-hospital analysis. Relative to the control group, the log of change in price per patient for the treatment group is 8.8% higher, which is statistically significant at the 5% level. The log of the ratio of post-merger to pre-merger price per patient day for DRGs in the treatment group is 0.167 while for DRGs
10Several hospitals continue to report DRG-level data separately even after the merger. In such cases, the post
merger price was also constructed using number of discharges as weights.
11Medicare and Medicaid patients are excluded because they are reimbursed based on a fixed formula and their
in the control group it is 0.07. Thus, the relative price increase for the treatment group is 0.097, which is statistically significant at the 1% level.12,13
5.1.2. Between hospital DRG level analysis
This DRG level analysis constructs hospital treatment and control groups using merging hospitals and non-merging hospitals in the same market. For each merger, I compared the changes in prices for DRGs where the merging hospital gained more than 20 percentage points in market share (excluding DRGs where the merging hospital obtained a monopoly status) with the changes in prices of identical DRGs for a similar non-merging hospital in the same market.14 Each merging hospital was matched with one non-merging control
hospital based on the following variables: location (zip code), profit-status (for-profit versus not-for-profit), size (number of staffed beds), proportion of Medicare and Medicaid patients, and Case-Mix index. The purpose of this analysis was to isolate the differences in pricing behavior of merged hospitals for DRGs where they gained market share relative to the same DRGs in other non-merging hospitals that did not gain any market share but were in the same market. Changes in prices for the control DRGs capture DRG-specific factors such as changes in labor cost, seasonal variations in demand and other factors that may affect prices. Thus, differences in pricing behavior between treatment and control DRGs may be attributed primarily to the merger.
Similar to the within-hospital analysis, the treatment group includes those DRGs where the merging hospital’s market share increased by 20 percentage points or more after the merger, excluding DRGs where the merging hospital became a sole provider (monopoly) after the merger. The control group was constructed using identical DRGs from the non-merging control hospital. The dependent variable (Relative price change) is similar to the within-hospital DRG level analysis (see Eq. (2)). If the increase in prices for the treatment DRGs is greater than the increase in prices for the control DRGs, then this implies that market power effects dominate from the merger.
Panel B of Table 1 summarizes the results for the between-hospital analysis. The number of observations used in this analysis is less than the number used in the within-hospital analysis described in Section 5.1.1. Some DRGs could not be matched either because the merging hospital was the major player in the hospital market and the other hospitals had only a small market share, or the only other hospital offering the service was also merging.
The results of this analysis show that the mean change in price per patient for treat-ment DRGs is 7.4% higher than the mean price change for the control DRGs and this difference is significant at the 5% level. Change in price per patient day shows that merg-ing hospitals’ price changes are about 10% higher than the change in price for the
con-12As the treatment and control groups have unequal sample sizes and the control group has larger variances than
the treatment group, Welch’s approximation for the t-statistic was used (Keppel, 1982).
13Skewness and kurtosis measures do not indicate serious departures from normality. Nevertheless, a Wilcoxon
Rank Sum test was conducted to test for the significance of the price changes. The results are similar to the results of the t-test reported in Table 1. For both change in price per patient and change in price per patient day, the relative price change variable is significant atP <0.01.
14Later in the analysis, the change in prices for merging hospitals is compared with the change in prices for
trol hospitals for identical DRGs. Table 1 also reports the change in prices for merg-ing hospitals in DRGs and non-mergmerg-ing control hospitals for DRGs with a medium (i.e. from 5 to 20 percentage point) increase in market share. The change in price per pa-tient and papa-tient day are generally higher in merging hospitals compared to the control hospitals. These results suggest that the increase in prices by merging hospitals were not restricted to DRGs where the merging hospital obtained a large increase in market share.
5.1.3. Analyses based on Herfindahl–Hirschman index
This section examines changes in price as a function of the changes in the HHI. This analysis is useful because HHI is the measure of market structure that is used by the DOJ and the FTC to evaluate the effects of mergers.
Table 2 reports the changes in prices for merging hospitals and non-merging hospi-tals located in merging and non-merging markets for various changes in HHI. For DRGs where there was an increase in HHI of 2000 or more, the increase in prices was 15.6% in the merging hospitals and 5.7% for the non-merging hospitals. These are markets where either there were very large mergers or where there were several mergers (such as the Cincinnati and Cleveland markets). Interestingly, the increase in prices for DRGs where the merging hospitals became monopolies is only 4.8% which is much lower than the increase in prices for DRGs where the HHI increased by greater than 2000 points. This probably happened because the DRGs where the merging hospitals obtained monopoly status were typically very complex (mean price in 1995=US$ 14,001, maximum price=
US$ 149,569) and the markets for these DRGs were already very concentrated before the merger.
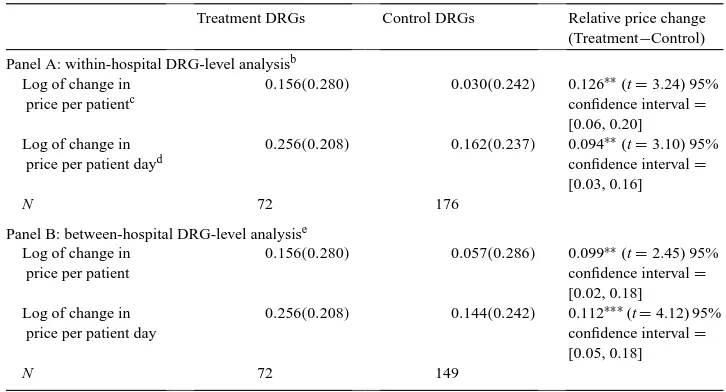
Table 3 repeats the analysis conducted in Table 1 using change in HHI instead of change in market shares. In Panel A, the analysis compares the change in prices of merging hospitals for DRGs where the HHI increased by more than 2000 with DRGs where the HHI increased by less than 250. The increase in price per patient by merging hospitals for DRGs where the HHI increased by 2000 was 15.6% which is 12.6% higher than the increase in prices for DRGs where the HHI changed by only 250. Similar results are observed for the price per patient day.
Panel B contains the change in prices for DRGs where HHI increased by more than 2000 with the same DRGs from all other non-merging hospitals in the same hospital market. The increase in price per patient and price per patient day for merging hospitals is 9.9 and 11.2% higher, respectively, than the increase in prices for non-merging hospitals located in the same market.
5.1.4. Inflation in price as a function of complexity
Table 3
Changes in mean pricesaof merging and non-merging hospital DRGs based on Herfindahl–Hirschman index
change
Treatment DRGs Control DRGs Relative price change (Treatment−Control) Panel A: within-hospital DRG-level analysisb
Log of change in price per patientc
0.156(0.280) 0.030(0.242) 0.126∗∗(t=3.24) 95% confidence interval=
[0.06, 0.20] Log of change in
price per patient dayd
0.256(0.208) 0.162(0.237) 0.094∗∗(t=3.10) 95% confidence interval=
[0.03, 0.16]
N 72 176
Panel B: between-hospital DRG-level analysise
Log of change in price per patient
0.156(0.280) 0.057(0.286) 0.099∗∗(t=2.45) 95% confidence interval=
[0.02, 0.18] Log of change in
price per patient day
0.256(0.208) 0.144(0.242) 0.112∗∗∗(t=4.12) 95% confidence interval=
[0.05, 0.18]
N 72 149
∗∗Statistically significant at the 5% level (two-tailed test). ∗∗∗Statistically significant at the 1% level (two-tailed test).
aPrices for self-pay and privately insured patients only.
bDRGs from the same hospital. Treatment DRGs are those where the HHI increased by >2000 in the
post-merger year and the control DRGs are those where the HHI increased by<250.
cThis is the mean of the log of change in price per patient and is calculated as (6n
i=1(log(post-merger price
per patient/pre-merger price per patient))/n).
dThis is the mean of the log of change in price per patient day and is calculated as (6n
i=1(log(post-merger price
per pat ient day/pre-merger price per patient day))/n).
eTreatment DRGs includes those from the merging hospitals where the HHI increased by >2000 in the
post-merger year and the control DRGs are the same DRGs from non-merging hospitals located in the same market.
be over-represented among the DRGs with low market-share growth. This may lead to a potential bias in the within-hospital analysis. If the more complex cases had higher rates of inflation, then the price effects of the mergers will be over-estimated and vice-versa if the inflationary trends are reversed. Hence, price inflation for high-complex and low-complex DRGs were examined.
For the Ohio market as a whole, the rates of inflation are similar for low-complexity and high-complexity DRGs. High-complexity DRGs, defined as those which have a DRG-level weight of >2.5 had a mean price inflation of 3.9%.15 Other DRGs (i.e. those with DRG weights <2.5 had a mean price inflation of 4.0%. Thus, bias due to differential rates of inflation for high-complex DRGs is not likely.
15Some examples of DRGs which belong to high-complex DRGs are: craniotomy for trauma age >17 (DRG
5.1.5. DRG-level analyses of all hospitals
In this section, the behavior of merged hospitals was examined relative to all other hospi-tals in the market after controlling for other factors that may influence prices. This analysis has the following objectives: (1) to examine whether merging hospitals increased prices for all DRGs including those where they did not gain market power, (2) to examine the pricing behavior of merging hospitals relative to all other hospitals in the market, after controlling for DRG-level, hospital-level, and market-level characteristics that may affect prices, and (3) to isolate the effects of market share on pricing, independent of mergers.
For this statewide DRG-level analyses, I selected 23 of the highest volume DRGs. About 75% of the total non-Medicare/Medicaid inpatient population fall in one of these high volume DRGs.16
The following fixed-effects model is estimated:
log(post/pre-merger year price per patient for DRGiin hospitalj )
=α+β1(merger dummy)+β2(log(post-merger/pre-merger market share in DRG
ifor hospitalj ))+β3(merge∗change in market share)+βi1−23(DRG dummies) +βj1−n(Hospital Dummies)+βk(controls)+ε (3)
As mentioned earlier in Section 3, the correction suggested by Robinson and Phibbs (1989) and Dranove and Cone (1985) was applied. That is, the following cross-sectional model was first estimated:
Pricepre-merger year =α+βi1−23(DRG dummies)+βj1−n(hospital dummies)
+βk(controls)+ε (4)
The residual from Eq. (4) was used as an independent variable in the estimation of Eq. (3). Pre-merger year price is the price for the year 1993–1994 and post-merger year price is the price for the year 1995–1996. Thus, the change in price covers a 2-year period. The MERGE dummy was coded as 1 if the hospital is a merging hospital; otherwise it was coded as 0. The change in market share was measured as log(post-merger market share of the hospital in the DRG/pre-merger market share of the hospital in the DRG). For the merged hospitals, the combined market share after the merger is used as the post-merger share.
The DRG-level control variables include17 the following.
16These high-volume DRGs include: simple pneumonia and pleurisy age >17 without CC, bronchitis/asthma age
0–17, percutaneus cardiovascular procedures, circulatory disorders with AMI w/o C.V. complications discharged alive, heart failure and shock, angina pectoris, chest pain, appendectomy w/o complicated principal diagnosis w/o CC, gastro-intestinal hemorrhage with CC, esophagitis/gastroenteritis/miscellaneous digestive disorders age >17, major joint and limb reattachment procedures of lower extremity, back and neck procedures with CC, back and neck procedures w/o CC, lower extremity and humerus procedures except hip/foot/femur > age 17, knee procedures w/o CC, medical back problems, nutritional and misc metabolic disorders age >17, uterine and adnexa procedures for non-malignancy with CC, uterine and adnexa procedures for non-malignancy w/o CC, cesarean section w/o CC, vaginal delivery w/o complicating diagnosis, vaginal delivery with sterilization, and normal newborn. Both California and Ohio had similar high-volume DRGs.
5.1.5.1. Pre-merger length of stay (LOS). This indicates the total number of days be-tween admission and discharge dates for each patient. This variable was added because prior research indicates that LOS has a large effect on prices and margins (Lynk, 1995). Further, higher LOS may be associated with greater complexity or severity, and hence LOS serves as an additional control variable. If DRGs with longer lengths of stay have greater inflation, then a higher LOS is likely to be associated with a greater increase in price.
5.1.5.2. Change in LOS. This is defined as log(post-merger year LOS/pre-merger year LOS). I included this variable because if a hospital experiences an increase or decrease in LOS in the post-merger year, this change may affect the change in prices. Because the dependent variable is price per discharge, an increase in LOS is likely to be associated with an increase in price.
5.1.5.3. Herfindahl–Hirschman index for the hospital market. I used post-merger HHI to control for the extent of concentration in the hospital market. HHI is defined at the DRG-level as the sum of squared market-shares of all the hospitals operating in the hospital market. Although antitrust authorities such as the FTC and DOJ use HHI as the primary measure of market structure, both market share and HHI have been included in the spec-ification because the HHI is a market-level variable while market-share is a firm-level variable.18 Thus, a hospital with a small market share located in a highly concentrated market may not have much influence on prices. Ravenscraft (1983) discusses a model in which both market share and concentration have independent influences on a firm’s performance.
5.1.5.4. Change in Herfindahl–Hirschman index. This is measured as log(post-merger year HHI/pre-merger year HHI).
5.1.5.5. Merging market. This dummy variable indicates whether or not the hospital was located in a hospital market with mergers. A positive coefficient on this variable would indicate that in response to the increase in market concentration, non-merging hospitals in a hospital market with mergers also increase prices.
In addition, the change in proportion of patients from managed care plans is added as a hospital-level control variable.
5.1.6. Results for Ohio mergers
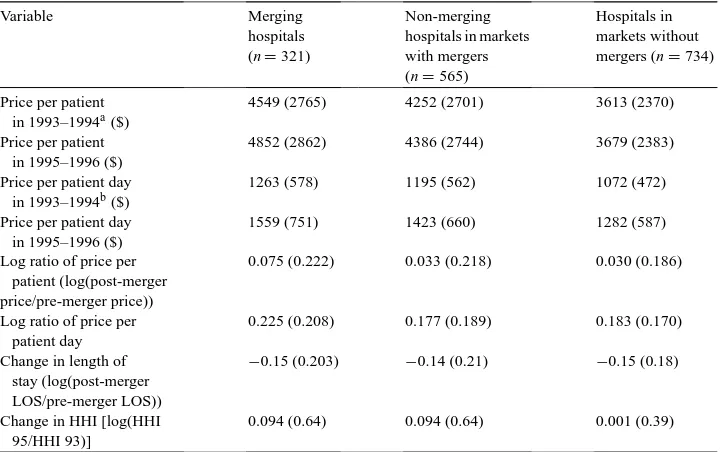
Table 4 provides variable means for hospital characteristics and prices for merging hos-pitals, non-merging hospitals in markets with mergers, and hospitals in markets without mergers. The means reported in Table 4 are measured at the DRG-level.
If we compare the mean prices in markets with mergers to markets without mergers, it appears that mergers occurred in higher priced markets. For example, the price per pa-tient for non-merging hospitals in markets with mergers was US$ 4252 in 1993–1994 and US$ 4386 in 1995–1996. In markets without mergers the price per patient for the
Table 4
DRG-level variable means for Ohio mergers and acquisitions (S.D. in parentheses)
Variable Merging
4549 (2765) 4252 (2701) 3613 (2370) Price per patient
in 1995–1996 ($)
4852 (2862) 4386 (2744) 3679 (2383) Price per patient day
in 1993–1994b($)
1263 (578) 1195 (562) 1072 (472)
Price per patient day in 1995–1996 ($)
1559 (751) 1423 (660) 1282 (587)
Log ratio of price per patient (log(post-merger price/pre-merger price))
0.075 (0.222) 0.033 (0.218) 0.030 (0.186)
Log ratio of price per patient day
0.225 (0.208) 0.177 (0.189) 0.183 (0.170) Change in length of
0.094 (0.64) 0.094 (0.64) 0.001 (0.39)
aThis refers to the mean of the mean price per patient in 1993–1994 for the 23 high volume DRGs in each
group. This is calculated as(623
i=1price per patient for DRGi)/23 for each hospital. This specification controls for changes in product-mix after the merger.
bThis refers to the mean of the mean price per patient day in 1993–1994 for the 23 high volume DRGs in each
group. This is calculated as(6i=231price per patient for DRGi)/23 for each hospital.
corresponding years was US$ 3613 and 3679. HHI for markets with mergers was 1711 in 1993–1994 and 2342 in 1995–1996 while the HHI for markets without mergers was 4839 in 1993–1994 and 4904 in 1995–1996, indicating that the mergers occurred in less concentrated markets.
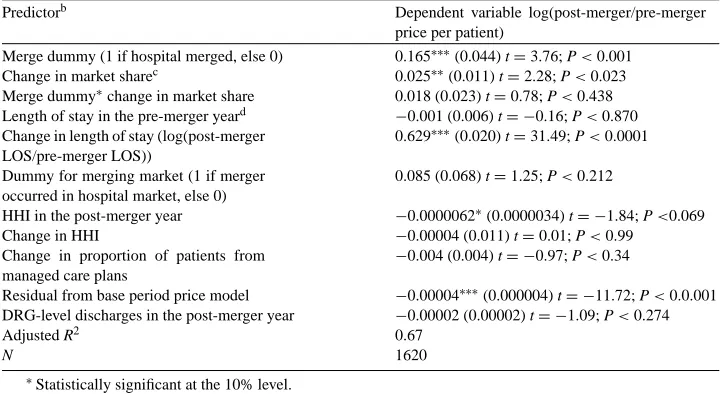
Table 5 contains results for the regression analysis of determinants of change in price per patient. Strong price effects were found for the Ohio mergers. The coefficient on MERGE as a predictor of the change in price per patient is 0.165. Thus, on average, the increase in prices per patient for merged hospitals was about 16.5 percentage points higher than for non-merging hospitals.19
The positive and statistically significant coefficient on log of change in market share20 also indicates that independent of mergers, change in market share has a positive effect on
19In an alternate specification, market dummies were used instead of hospital dummies. It was not possible to use
both hospital and market dummies because inclusion of both results in a singularity problem due to the presence of single-hospital markets. When market dummies were used, the sign and the statistical significance of all the relevant variables including the MERGE dummy were similar to the results obtained using hospital dummies only.
20The correlation between DRG-level market share and DRG-level HHI was 70%. The correlation between
Table 5
DRG-level analyses of Ohio mergers and acquisitions regression results for determinants of post merger change in pricesa(S.E. in parenthesis)
Predictorb Dependent variable log(post-merger/pre-merger
price per patient)
Merge dummy (1 if hospital merged, else 0) 0.165∗∗∗(0.044) t=3.76; P<0.001 Change in market sharec 0.025∗∗(0.011) t=2.28; P<0.023 Merge dummy∗change in market share 0.018 (0.023) t=0.78; P<0.438 Length of stay in the pre-merger yeard −0.001 (0.006) t= −0.16; P<0.870
Change in length of stay (log(post-merger LOS/pre-merger LOS))
0.629∗∗∗(0.020) t=31.49; P<0.0001 Dummy for merging market (1 if merger
occurred in hospital market, else 0)
0.085 (0.068) t=1.25; P<0.212 HHI in the post-merger year −0.0000062∗
(0.0000034) t= −1.84; P<0.069 Change in HHI −0.00004 (0.011) t=0.01; P<0.99
Change in proportion of patients from managed care plans
−0.004 (0.004) t= −0.97; P<0.34 Residual from base period price model −0.00004∗∗∗
(0.000004) t= −11.72; P<0.0.001 DRG-level discharges in the post-merger year −0.00002 (0.00002) t= −1.09; P<0.274
Adjusted R2 0.67
N 1620
∗Statistically significant at the 10% level. ∗∗Statistically significant at the 5% level. ∗∗∗Statistically significant at the 1% level.
aPrivately insured and self-pay patients only.
bIncludes DRG-specific and hospital specific dummies. cMarket share for privately insured and self-pay patients only. dLOS for privately insured and self-pay patients only.
change in price per patient. The results show that a 1% increase in market share increases prices by about 0.02%. Change in LOS has a positive coefficient because, as discussed earlier, an increase in LOS is associated with greater resource consumption.21
The results for the Merging Market dummy suggest that mergers in the hospital market do not affect price per patient significantly for non-merging hospitals. These results are consistent with Connor and Feldman (1998) who compare the performance of non-merging neighbors of merging hospitals to that of hospitals in areas without mergers. They found no significant effects of mergers on either the prices or costs of non-merging hospitals located in markets with mergers.
To summarize, analysis of the Ohio mergers indicates that merging hospitals used their increased market share in individual DRGs to raise prices for those DRGs. Merging hospitals increased their prices per patient and per patient day to a much greater extent after the merger compared to non-merging hospitals in Ohio. The results also indicate that regardless of mergers, an increase in market share in individual DRGs leads to increased prices for Ohio
21When identical control variables are used, results for determinants of change in price per patient day are similar
hospitals, suggesting that hospitals exercise the price-increasing opportunities offered by increased market share.
5.2. Analysis of across-market California acquisitions
The consolidation activity in California consisted primarily of acquisitions of free-standing hospitals by multi-hospital systems. California had only three within-market merg-ers during 1994–1995 of which two involved very small hospitals (<25 beds). However, California had 15 across-market hospital acquisitions by multi-hospital systems. I analyzed the effects of these acquisitions on prices for privately insured patients. The methodology used for the analysis of California acquisitions is similar to the one reported in Section 5.1.3 (DRG-level analysis of all hospitals) of the Ohio mergers. Because more extensive patient-level data were available for California hospitals, the following additional control variables were included in the regression model reported in Eq. (4): mean patient sever-ity index, change in mean seversever-ity index, mean patient age, and change in mean patient age. All these variables were computed for privately insured patients only and defined as follows.
5.2.1. Mean pre-merger patient severity index (reported in the OSHPD database)
This variable evaluates the episode of care on a scale of 4-point scale based on the “extent of physiologic decompensation or organ system loss of function.” The scale is coded as follows: 1=minor, 2=moderate, 3=major, 4=extreme.
5.2.2. Change in mean patient severity index
This is defined as log(post-merger year mean severity index/pre-merger year mean sever-ity index).
5.2.3. Mean pre-merger patient age (reported in the OSHPD database)
This is a 14-point scale where 1=under 1 year and 14=85 years or greater.
5.2.4. Change in mean patient age
This is measured as the log(post-merger year mean patient age/pre-merger year mean patient age).
5.2.5. Results for California acquisitions
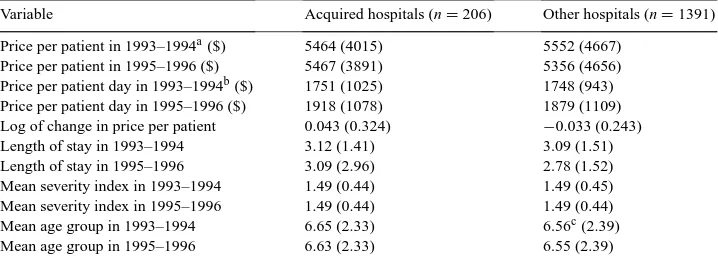
Variable means for the acquired, and control hospitals are given in Table 6. Acquired hospitals have a mean price per patient of US$ 5464 in 1993–1994 and US$ 5467 in 1995–1996. In contrast, control hospitals have a higher pre-merger year mean price per patient of US$ 5552 and a lower post-merger year price per patient of US$ 5356.
Table 6
DRG-level variable means for California mergers and acquisitions (S.D. in parentheses)
Variable Acquired hospitals (n=206) Other hospitals (n=1391) Price per patient in 1993–1994a($) 5464 (4015) 5552 (4667)
Price per patient in 1995–1996 ($) 5467 (3891) 5356 (4656) Price per patient day in 1993–1994b($) 1751 (1025) 1748 (943) Price per patient day in 1995–1996 ($) 1918 (1078) 1879 (1109) Log of change in price per patient 0.043 (0.324) −0.033 (0.243) Length of stay in 1993–1994 3.12 (1.41) 3.09 (1.51) Length of stay in 1995–1996 3.09 (2.96) 2.78 (1.52) Mean severity index in 1993–1994 1.49 (0.44) 1.49 (0.45) Mean severity index in 1995–1996 1.49 (0.44) 1.49 (0.44) Mean age group in 1993–1994 6.65 (2.33) 6.56c(2.39)
Mean age group in 1995–1996 6.63 (2.33) 6.55 (2.39)
aThis refers to the mean of the mean price per patient in 1993–1994 for the 23 high volume DRGs in each
group. This is calculated as (623i=1price per patient for DRGi)/23 for each hospital. This specification controls for changes in product-mix after the merger.
bThis refers to the mean of the mean price per patient day in 1993–1994 for the 23 high volume DRGs in each
group. This is calculated as (623i=1price per patient day for DRGi)/23 for each hospital.
cThis corresponds to approximately 40 years.
acquired hospitals were somewhat larger (average of 253 staffed beds) compared to the control hospitals (203 staffed beds).
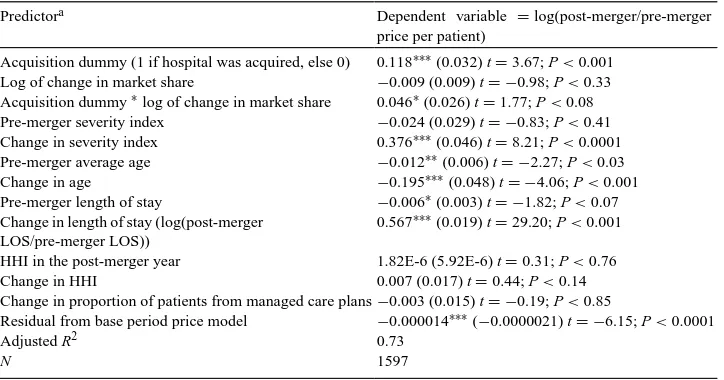
Table 7 presents regression results for the determinants of change in price per patient. The results indicate that hospitals acquired during 1994–1995 show higher increases in price relative to the other hospitals. The coefficient on the acquisition dummy indicates that the increase in prices for hospitals that were acquired was about 11.8 percentage points greater than other hospitals in the market.22
Increase in severity index is positively associated with an increase in prices. These results suggest that more severely ill patients consume resources to a greater extent, which is reflected in prices. Decrease in mean patient age is associated with an increase in prices. This is likely to be driven by two factors. First, the analysis includes only privately insured patients and hence a decrease in age may signify an increase in the number of children who may be more severely affected by some of the DRGs included in the analysis (e.g. bronchitis and asthma). Second, prior research indicates that with some ailments, younger patients are more at risk for complications. For example, heart-attacks (Vaccarini et al., 1999) and breast cancer (Diab, 2000) are more severe among younger women. The control variable for severity level may not adequately reflect these factors. Increase in LOS is associated with an increase in price per patient because as discussed earlier in Section 5.1.5, an increase in length of stay reflects greater resource consumption per patient.
The interaction between the acquisition dummy and the log of change in market share has a positive and significant coefficient. This suggests that acquired hospitals increased prices to a greater extent in DRGs where they gained market share. Taken together, the results for the California acquisitions suggest that acquired hospitals exercised market power. These
22Results were similar for the price per patient day measure. The only difference is that increase in LOS is
Table 7
DRG-level analyses of California acquisitions regression results for determinants of post-merger prices (privately insured patients only)
Predictora Dependent variable =log(post-merger/pre-merger
price per patient)
Acquisition dummy (1 if hospital was acquired, else 0) 0.118∗∗∗(0.032) t=3.67; P<0.001 Log of change in market share −0.009 (0.009) t= −0.98; P<0.33 Acquisition dummy∗log of change in market share 0.046∗(0.026) t=1.77; P<0.08 Pre-merger severity index −0.024 (0.029) t= −0.83; P<0.41 Change in severity index 0.376∗∗∗(0.046) t=8.21; P<0.0001 Pre-merger average age −0.012∗∗(0.006) t= −2.27; P<0.03
Change in age −0.195∗∗∗
(0.048) t= −4.06; P<0.001 Pre-merger length of stay −0.006∗
(0.003) t= −1.82; P<0.07 Change in length of stay (log(post-merger
LOS/pre-merger LOS))
0.567∗∗∗
(0.019) t=29.20; P<0.001 HHI in the post-merger year 1.82E-6 (5.92E-6) t=0.31; P<0.76 Change in HHI 0.007 (0.017) t=0.44; P<0.14 Change in proportion of patients from managed care plans−0.003 (0.015) t= −0.19; P<0.85 Residual from base period price model −0.000014∗∗∗(
−0.0000021) t= −6.15; P<0.0001
Adjusted R2 0.73
N 1597
aIncludes DRG-specific and hospital specific dummies.
results are consistent with Brooks et al. (1997) who found that hospitals belonging to multi-hospital systems had significantly greater bargaining power.
5.3. Welfare effects
The previous analyses reveal that merged and acquired hospitals increased DRG-level prices suggesting that these hospitals exercised market power. However, before concluding that there is a welfare loss from the hospital’s acquisition of market power, the effects of mergers on quantity demanded have to be examined because the presence of health insur-ance makes the link between competition and social welfare less direct in the health-care industry compared to other industries (Gaynor and Hass-Wilson, 1999).
effects of increased premiums on insurance demand. Further, if the higher prices cause consumers to purchase less insurance (i.e. policies with more cost sharing) then consumers will bear extra risk.
Table 8 shows the average number of patients discharged by merging and non-merging hospitals for all DRGs and for the high-volume DRGs. For the Ohio hospitals (Panel A), the mean discharge per DRG increased marginally in the post-merger year for the merged hospitals. For the non-merging hospitals, the mean discharge per DRG decreased in the post-merger year. Hospitals located in markets without mergers also have a small decrease in the number of discharges per DRG. The acquired hospitals in California (Panel B) had an increase in the mean discharges while the mean discharges decreased marginally in the control hospitals. These results suggest that the quantity demanded did not decrease for merging and acquired hospitals. Thus, in the short-run, welfare losses are likely to be low from these mergers and acquisitions and instead, there is just a transfer of resources from the consumer to the producer. However, the long-run effects of higher hospital prices on the demand for health insurance in these markets requires further exploration.
6. Summary and conclusions
This study examines the influence of mergers and acquisitions on hospital prices. Results indicate that even after controlling for length of stay, DRG-specific effects, hospital-specific effects, and market-specific effects, the increase in DRG level prices is higher in the merging and acquired hospitals compared to corresponding changes for the same set of DRGs for non-merging hospitals. The results of this study are consistent with recent empirical studies about the price effects of changes in hospital market concentration (Brooks et al., 1997; Dranove and Ludwick, 1999; Keeler et al., 1999).
Ideally costs should be examined in addition to revenues in order to determine the overall effects of mergers and acquisitions. However, this study primarily focuses on price effects at the DRG level and cost data at the DRG level are not available. Hence, this study only suggests that mergers increase prices without eliminating the possibility that cost reduc-tions through increased economies of scale also occurred after the merger or acquisition. Prior research by Dranove (1998) using semiparametric analysis of economies of scale in non-revenue producing cost centers suggests that small hospitals (<2500 discharges annu-ally) may potentially reap substantial benefits from a merger via scale economies in these cost centers. His study also indicates that in larger hospitals, savings from mergers will be minimal.
Mergers may also cause DRG-level price reductions in the long run via improved effi-ciencies. This may explain why Connor et al. (1998) found that hospitals which merged during the period 1986–1994, on an aggregate had 5.65% lower price inflation than other non-merging hospitals. A longitudinal analysis using a longer panel to track the long-term effects of hospital mergers on DRG-level prices would be useful.
1991–1994 finds that patient quality (measured by patient mortality) changes only in some cases after consolidation (Ho and Hamilton, 2000).
Another consideration is that prices may be equal to marginal cost (MC) in the hospital markets and that the merger or acquisition leads to inefficiencies which increase MC and hence increase prices. However, these inefficiencies are usually unanticipated and hence it is not possible to analyze their probable effects on final product prices, even in theory (Fisher et al., 1989). Further inefficiencies across the board only in DRGs where the hospitals gained market share are unlikely.
Future research should also examine the hospital-level price effects of mergers. The aggregate firm-level price effects of mergers are likely to be smaller because of the inclusion of Medicare and Medicaid patients who are reimbursed on a fixed-fee basis and over whom the merging hospitals are unlikely to have bargaining power.
This study examines “one of the most enduring conflicts of antitrust policy”: price effects of mergers (Martin, 1994). Given the large number of hospital mergers and acquisitions that have occurred recently, the appropriate anti-trust treatment of hospital mergers is a topic of debate (Dranove et al., 1993; Gaynor and Vogt, 1998; Lynk, 1995). This study defines each DRG as a separate product market and thus provides empirical evidence of the DRG-level price effects of hospital mergers and acquisitions. The results of this study have implications for antitrust examination of hospital mergers. For example, the within-market analysis indicates that merging hospitals in Ohio increased their prices to a greater extent in DRGs where they gained greater market share. Thus, antitrust examination of a hospital merger should include the effects of the merger on DRG-level market shares and market structure, in addition to hospital level market shares. Further, because some degree of substitution may be occurring across closely related DRGs, future research exploring clustering of related DRGs into separate markets would be worthwhile.
Acknowledgements
This paper draws on my Ph.D. dissertation completed at the University of Pittsburgh. I thank the members of my dissertation committee, John H. Evans III, Martin Gaynor, Judith Lave, Kenneth Lehn, Nandu Nagarajan, and William Vogt for their help and assistance. I also thank Vivian Ho, Kathy Petroni, Mike Shields, Naomi Soderstrom, workshop participants at the 1999 Management Accounting Conference of the American Accounting Association, Baruch College, University of Cincinnati, Georgia State University, University of Iowa, Michigan State University, University of Pittsburgh, University of Texas at Dallas, and Washington University for their comments. Joseph Newhouse, and two anonymous referees also provided many helpful comments and suggestions. Financial support from the Institute for Industrial Competitiveness and the Center for Research on Contracts and the Structure of Enterprise is gratefully acknowledged.
References
Brooks, J.M., Dor, A., Wong, H., 1997. Hospital-insurer bargaining: an empirical investigation of appendectomy pricing. Journal of Health Economics 6, 417–434.
Connor, R.A., Feldman, R.D., 1998. In: Morrisey, M. (Ed.), Horizontal hospital mergers and their effects on prices and profits of non-merging hospitals in the same market area, in Managed Care and Changing Health Care Markets. American Enterprise Institute for Public Policy Research, Washington, DC.
Connor, R.A., Feldman, R.D., Dowd, B.E., Radcliff, T.A., 1997. Which types of mergers save consumers money? Health Affairs 16, 62–74.
Connor, R.A., Feldman, R.D., Dowd, B., 1998. The Effects of market concentration and hospital mergers on hospital costs and prices. International Journal of Economics of Economics of Business 5, 159–180. Diab, S.G., 2000. Tumor characteristics and clinical outcomes of elderly women with breast cancer. Journal of the
National Cancer Institute 92, 550–556.
Dranove, D., 1998. Economies of scale in non-revenue producing cost centers: implications for hospital mergers. Journal of Health Economics 17, 69–83.
Dranove, D., Cone, K., 1985. Do rate setting regulations really lower hospital expenses? Journal of Health Economics 4, 159–166.
Dranove, D., Ludwick, R., 1999. Competition and pricing by nonprofit hospitals: a reassessment of Lynk’s analysis. Journal of Health Economics 18, 87–98.
Dranove, D., Shanley, M., White, W., 1993. Price and competition in hospital markets: the switch from patient-driven to payer-driven competition. Journal of Law and Economics 36, 179–204.
Farley, D., 1985. Competition among hospitals: market structure and its relation to utilization, costs and financial position. Research Note 7, Hospital Studies Program, DHHS Publication 85–3353.
Folland, S., Goodman, A.C., Stano, M., 1997. The Economics of Health and Health Care, 2nd Edition. Prentice-Hall, Englewood Cliffs, NJ.
Fisher, A.A., Johnson, F.I., Lande, R.H., 1989. Price effects of horizontal mergers. California Law Review 77, 777–827.
Frank, R.G., Salkever, D.S., 1991. The supply of charity services by nonprofit hospitals: motives and market structure. Rand Journal of Economics 22, 430–435.
Gaynor, M., Hass-Wilson, D.H., 1999. Change, consolidation, and competition in health-care markets. Journal of Economic Perspectives 13, 141–164.
Gaynor, M., Vogt, W.B., 1998. Antitrust. In: Culyer, A.J., Newhouse, J.P. (Eds.), Handbook of Health Economics. North-Holland, Amsterdam.
Ho, V., Hamilton, B.H., 2000. Hospital mergers and acquisitions: does market consolidation harm patients? Journal of Health Economics 19, 767–791.
Harsanyi, J.C., 1956. Approaches to the bargaining problem before and after the theory of games: a critical discussion of Zeuthen’s, Hicks’, and Nash’s theories. Econometrica 24, 144–157.
Holmer, M., 1984. Tax policy and the demand for health insurance. Journal of Health Economics 3, 203–222. Jaspen, B., 1998. An off year for consolidations. Modern Healthcare 28, 40–48.
Keppel, G., 1982. Design and Analysis: A Researcher’s Handbook, 2nd Edition. Prentice-Hall, Englewood Cliffs, NJ.
Kim, E.H., Singal, V., 1993. Mergers and market power: evidence from the airline industry. American Economic Review 83, 549–569.
Keeler, E.B., Melnick, G., Zwanziger, J., 1999. The changing effects of competition on non-profit and for-profit hospital pricing behavior. Journal of Health Economics 18, 69–86.
Lynk, W.J., 1995. Nonprofit mergers and the exercise of market power. Journal of Law and Economics 38, 437–461. Makuc, D.M., Haglund, B., Ingram, D.D., Kleinman, J.C., 1991. Vital and health statistics: Health service areas for the United States. DHHS Publication No. (PHS) 92–1386, National Center for Health Statistics Series 2, No. 112, Center for Disease Control.
Manheim, L.M., Bazzoli, G.J., Sohn, M., 1994. Local hospital competition in large market areas. Journal of Economics and Management Strategy 3, 143–167.
Manning, W.G., Marquis, M.S., 1996. Health insurance: the tradeoff between risk pooling and moral hazard. Journal of Health Economics 15, 609–639.
Martin, S., 1994. Industrial Economics: Economic Analysis and Public Policy, 2nd Edition. Macmillan, New York. Melnick, G.A., Zwanziger, J., Bamezai, A., Pattison, R., 1992. The effects of market structure and bargaining
position on hospital prices. Journal of Health Economics 11, 217–233. Nash, J.F., 1950. The bargaining problem. Econometrica 28, 155–162. Nash, J.F., 1953. Two-person cooperative games. Econometrica 31, 129–140.
Patel, J., Needleman, J., Zeckhauser, R., 1994. Changing fortunes, hospital behaviors and ownership forms. Working Paper No. R94–17, Harvard University.
Ravenscraft, D.J., 1983. Structure-profit relationships at the line of business and industry level. Review of Economics and Statistics 65, 22–31.
Robinson, J., Luft, H., 1985. The impact of hospital market structure on patient volume, length of stay, and the cost of care. Journal of Health Economics 4, 333–356.
Robinson, J., Luft, H., 1988. Competition, regulation and hospital costs, 1982–1986. Journal of the American Medical Association 269, 2676–2681.
Robinson, J.C., Phibbs, C., 1989. An evaluation of Medicaid selective contracting in California. Journal of Health Economics 8, 437–455.
Snail, T.S., Robinson, J.C., 1998. Organizational diversification in the American hospital. Annual Review of Public Health 19, 417–453.
Svejnar, J., 1986. Bargaining power, fear of disagreement, and wage settlements: theory and evidence from US industry. Econometrica 54, 1055–1078.
Vaccarini, V., Parsons, L., Every, N.R., Barron, H.V., Krumholz, H.M., 1999. Sex-based differences in early mortality after myocardial infraction. New England Journal of Medicine 341, 217–225.