Omitted variable bias and hospital costs
Pierre-Yves Crémieux
a,b,∗, Pierre Ouellette
aaDépartement des Sciences Économiques, Université du Québec à Montréal, Montreal, Canada bAnalysis Group/Economics, One Brattle Square, 5th floor, Cambridge MA 02138, USA
Received 1 October 2000; received in revised form 1 November 2000; accepted 7 November 2000
Abstract
This research examines the impact of omitted variables on the accuracy of parametric hospital cost function estimations based on Québec hospital level data. We assess the effect of omitted variables resulting from incomplete data on technology and performance measurement and on tests of the cost minimizing behavior of the institution. Our results show that important characteristics of hospital technology, such as returns to scale, are extremely sensitive to omitted variable bias. Similarly, estimates of hospital performance are poor indicators of actual performance when data are incomplete. © 2001 Elsevier Science B.V. All rights reserved.
JEL classification: I11; D24
Keywords: Hospital cost; Omitted variable; Technological progress
1. Introduction
Cost function estimations are commonly used to determine the production characteristics of a particular technology, to compare technologies across firms, industries or countries, and to examine technological progress (Diewert, 1971). In the hospital sector, cost functions have been used to identify the characteristics of the ‘optimal’ hospital (returns to scale, capital level, diversification of services) and the effect of technological change (Eakin and Knieser, 1988, 1992; Cowing and Holtmann, 1983; Cowing et al., 1983; Breyer, 1987; Dor and Farley, 1996; Granneman et al., 1986; Lave and Lave, 1970; Lee and Wallace, 1973; Vita, 1990; Vitaliano, 1987). This approach has also been relied upon to identify performance differences across ownership structures or to suggest optimal budget allocation in public health care systems (Banks, 1993; Bilodeau et al., 2000b; Ministère de la Santé et des
∗Corresponding author. Present address: Analysis Group/Economics, One Brattle Square 5th Floor, Cambridge,
MA 02138, USA. Tel.:+1-617-349-2135; fax:+1-617-864-3742. E-mail address: [email protected] (P.-Y. Cr´emieux).
Services Sociaux, 1992). For such exercises to be valid requires that both the underlying hospital production process and cost function exhibit certain theoretical properties and that the estimation rely on complete data.
From a theoretical point of view, at a minimum, hospitals must be short-run cost mini-mizers. This determination should typically be made prior to examining the characteristics of hospital care. Second, the very accuracy of the testing for cost minimization and of the overall analysis may be highly dependent on the quality of the underlying data.
Some evidence exists of biases associated with incomplete data but, to date, no research has quantified the effect of incomplete data on either the tests of theoretical properties or the characterization of hospital performance and production of health care based on parametric cost function estimation. This is unfortunate since researchers often must rely on incomplete or unreliable data for some of the hospitals examined and/or some of the inputs and outputs of the production process (Vitaliano, 1987; Eakin and Knieser, 1988; Koop and Carey, 1994; Ministère de la Santé et des Services Sociaux, 1992).
This article examines the impact of omitted variables on the accuracy of such analyses. Is it preferable to conduct the analysis with incomplete data or to refrain from cost function estimation altogether? Using Monte Carlo analysis, Gagné and Ouellette (1998) have shown that cost function estimation can be effectively relied upon to characterize the technology and test economic theory if the underlying data are reasonably good. Based on a data set with rather complete data on all inputs and outputs, we examine the effect of data omission on technology and performance measurement as well as tests of the cost minimizing behavior of the firm. This is done by comparing results obtained from a benchmark model including all available variables with those obtained from a model based on a subset of data. Differences between the models will serve as measures of bias associated with incomplete data. Although it relies on unusually complete data, the benchmark model may itself suffer from bias resulting from data limitations. However, the magnitude of differences across models with varying degrees of data completeness, remain indications of the sensitivity of parametric estimation to data limitations.
2. Data1
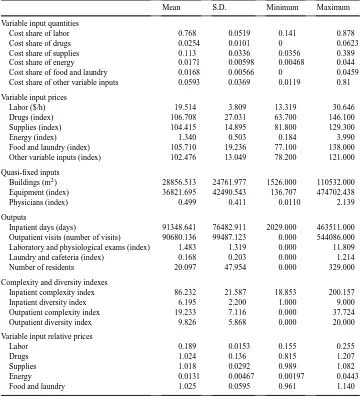
The data relied upon in this analysis are available from the financial and statistical reports provided yearly by each hospital to the Québec Ministry of Health (forms AS-471 and AS-477). Additional data on physician costs were obtained from the Régie de l’Assurance-Maladie du Québec (RAMQ) which is the government unit that provides health care reim-bursement. Table 1 summarizes descriptive statistics. The data cover a diverse set of 120 hospitals from 1980 to 1992 with significant variation in the type and size of the institution. For example, some hospitals provide nine specialties while others provide one. One hospital has 463,511 patient days while another has as few as 2029.
The data include all inputs (variable and quasi-fixed) and all outputs. As is most often the case, however, they do not measure health directly and could suffer from measurement error because of inaccurate reporting or unrecorded accounting changes over the years.
Table 1
Descriptive statistics (N=1383)
Mean S.D. Minimum Maximum
Variable input quantities
Cost share of labor 0.768 0.0519 0.141 0.878
Cost share of drugs 0.0254 0.0101 0 0.0623
Cost share of supplies 0.113 0.0336 0.0356 0.389
Cost share of energy 0.0171 0.00598 0.00468 0.044
Cost share of food and laundry 0.0168 0.00566 0 0.0459
Cost share of other variable inputs 0.0593 0.0369 0.0119 0.81
Variable input prices
Labor ($/h) 19.514 3.809 13.319 30.646
Drugs (index) 106.708 27.031 63.700 146.100
Supplies (index) 104.415 14.895 81.800 129.300
Energy (index) 1.340 0.503 0.184 3.990
Food and laundry (index) 105.710 19.236 77.100 138.000
Other variable inputs (index) 102.476 13.049 78.200 121.000
Quasi-fixed inputs
Buildings (m2) 28856.513 24761.977 1526.000 110532.000
Equipment (index) 36821.695 42490.543 136.707 474702.438
Physicians (index) 0.499 0.411 0.0110 2.139
Outputs
Inpatient days (days) 91348.641 76482.911 2029.000 463511.000 Outpatient visits (number of visits) 90680.136 99487.123 0.000 544086.000 Laboratory and physiological exams (index) 1.483 1.319 0.000 11.809
Laundry and cafeteria (index) 0.168 0.203 0.000 1.214
Number of residents 20.097 47.954 0.000 329.000
Complexity and diversity indexes
Inpatient complexity index 86.232 21.587 18.853 200.157
Inpatient diversity index 6.195 2.200 1.000 9.000
Outpatient complexity index 19.233 7.116 0.000 37.724
Outpatient diversity index 9.826 5.868 0.000 20.000
Variable input relative prices
Labor 0.189 0.0153 0.155 0.255
Drugs 1.024 0.136 0.815 1.207
Supplies 1.018 0.0292 0.989 1.082
Energy 0.0131 0.00467 0.00197 0.0443
Food and laundry 1.025 0.0595 0.961 1.140
Furthermore, the inputs and outputs are aggregated, and patient case mix or quality of care are not directly observed. This suggests that even the complete ‘benchmark’ model could yield biased results. However, if models with increasing numbers of omitted variables yield increasingly different results, that provides evidence of omitted variable bias irrespective of the completeness of the reference model. We rely on these relative magnitudes to assess omitted variable bias.
quasi-fixed inputs: buildings, equipment and physicians. Hospitals provide a large array of services aggregated into five output categories: services to inpatients, services to outpatients, laboratory and physiological services, hotel services, and teaching. Inpatient services are reported as inpatient days and outpatient services as the number of clinic visits. Laboratory services are aggregated across hospital specialties using technical units developed by the Ministry of Health that incorporate weights reflecting the relative complexity of specific tests. The metric for hotel services is the number of meals served to outpatients and the technical units of laundry services reported by the hospital. To reduce the number of outputs, we aggregated food and laundry services. The two outputs are aggregated by calculating Laspeyres and Paasche indexes that are combined into a Fisher index.2 Teaching services are proxied by the number of residents.3 The measurement of inpatient and outpatient care is more complex since the very composition of care within each category might vary significantly from one hospital to the other. For that reason, we constructed a complexity and a diversity index for each category of care to capture case mix. The complexity index of inpatient care is constructed as
9
×number of patient daysiH ×100
total patient daysH
!
where i indexes specialties and h hospitals. The nine specialties are medicine, surgery, in-tensive care, gynecology and obstetrics, pediatrics, medicine and surgery,4 active geriatrics (since 1988–1989), psychiatry, and ‘other’. On average, hospitals have 6.2 specialties. Four hospitals have only one specialty while 26 hospitals have all nine. The first term in the parentheses gives the average unitary cost over all hospitals for a given specialty and the second term determines the relative weight of that specialty for hospital H. The resulting statistic is summed over all specialties for hospital H.
This will serve as a partial proxy for case mix since it will distinguish between hospitals that offer relatively simple medical interventions from those that offer more complicated surgical procedures. Unfortunately, it will not capture differences in case mix across hospi-tals with the same distribution of specialties. This will be captured in part by the diversity index which measures the number of specialties offered. The diversity index should partially capture more complex case mix within a specialty typically observed at hospitals that offer a greater array of services. All hospitals offer the basic specialties of medicine and surgery. However, hospitals that are tertiary institutions with more complex case mix are more likely to also offer specialties such as ICU or gynecology and obstetrics. Of course, this measure will be partially correlated with the size of the hospital since tertiary institutions also tend to be large urban hospitals such as those found in Montréal (Hôpital Notre-Dame, Sacré Coeur, or Saint-Luc). Nevertheless, some larger hospitals such as Hôpital Rosemont offer only three specialties and typically treat less complex cases. Similarly, some small hospitals
2The Fisher index is the square root of the product of a Laspeyre and a Paasche index, see Diewert (1992) for a survey on index numbers, including Fisher index.
3When an output level of zero was observed at one hospital (no teaching program, for example), we used a Box–Cox transformationy→(yλ−1)/λ,with limλ
→0(yλ−1)/λ=ln(y).
often in remote locations, such as the Réseau de Santé Richelieu Yamaska, offer the whole range of services and must treat complex cases that cannot be transferred while others offer only limited types of care.
Outpatient indexes are constructed based on data from the hospital financial (AS-471) and statistical (AS-477) reports that include the number of visits to outpatient clinics. As in other work, the absence of a reliable measure of quality of care requires us to assume that quality is homogeneous among hospitals.
3. Method
Typically, a hospital’s production function can be directly inferred from the estimation of a variable cost function of the following general form.
Cht=Ch(y, w, k,MD, t, θ )+εht
where Ch is the cost function of hospital (in translog form), h indexes hospitals, y the
output vector,w the variable input price vector, k the quasi-fixed input vector, and MD the physician vector. The trend t is introduced to account for technological change,θis a vector of hospital specific parameters, andεhtthe error term.5 The cost function is hospital
specific and the technology could be different across hospitals. Theoretically, the omission of any of the right-hand side variables will bias the regression results and could lead to erroneous conclusions.
To examine the effect of variable omission, we estimated a translog cost function of the form
Ch=C(w, k, y,MD, N, θ, t )×eαh
where C,w, k, y, MD andθare as defined before, N a vector of output characteristics and t (time) an indicator of technological change. Because size and type of hospitals vary widely within the sample, eαhincluded as a fixed effects variable acts as a hospital specific constant term and sets the cost frontier for each hospital. To determine the effect of variable omission on estimated hospital performance and technological characteristics, we omitted subsets of variables from the model. The reference model (model 1) could itself suffer from some form of data omission. In particular, the measure of case mix is, as always, imperfect. Furthermore, we cannot rely on DRG-type measures, because such case mix assessments were only recently adopted in Québec and were not consistently defined over time. Nevertheless, the low correlation coefficient between the performance measures developed here and the limited available DRG measures (r=0.22) suggest that differences in performance do not simply proxy differences in case mix unsuccessfully captured by our correction variables.
Five different models were estimated.6
1. Model 1 includes all inputs and outputs as in Bilodeau et al. (2000a).
5Despite the inclusion of all inputs and all outputs, the error term is necessary to capture possible measurement error resulting from the mis-specification of the functional form or imperfect data.
2. Model 2 omits only case mix variables.
3. Model 3 omits case mix and the two minor output variables: hotel services and labo-ratory services.
4. Model 4 omits case mix, and all outputs except inpatient days. Ignoring outputs other than inpatient days is quite typical of a number of studies in the literature (see for example, Dor and Farley, 1996; Eakin and Knieser, 1988).
5. Model 5 omits case mix, all outputs except inpatients and all quasi-fixed factor inputs except buildings. It approximates specifications also found in the literature and that have been the subject of various bias analyses (Bays, 1980; Jensen and Morrisey, 1986a, b).
4. Testing theoretical properties
For the parametric estimation of cost functions to be valid from a theoretical standpoint requires that firms be cost minimizing at least in the short run. Therefore, the cost function must be positive (C > 0), increasing with variable input prices (Cw > 0) and outputs
(Cy > 0). It must also be decreasing with respect to quasi-fixed input levels (Ck < 0),
homogeneous of degree one with respect to variable input prices(P
iCwiwi =C), concave
with respect towand convex with respect to k.
Since the cost function and the variable input shares are estimated simultaneously while imposing the homogeneity condition, the cost function will be positive and monotonically increasing with respect towexcept for an error term. These conditions are in fact observed for all observations in the sample in all models. Similarly, concavity with respect to variable input prices is never rejected except in some rare instances for models without case mix control variables. Therefore, all models indicate that hospitals are cost minimizers at least in the short run. Monotonicity properties with respect to quasi-fixed factors and output are also model independent. The monotonicity with respect to quasi-fixed factors is always rejected while the monotonicity in output never is. This suggests that despite the existence of local monopolies and the limited competition observed among Québec hospitals, hospitals do behave like short-term cost minimizers.
Other properties are sensitive to model specification. In particular, convexity properties with respect to quasi-fixed factors are rejected in models that include more than one output (models 1–3) but not in models that consider only inpatient days (models 4 and 5). In this case, since the monotonicity property is not respected, it matters little. However, in some cases, this might lead the researcher to believe that another condition for long-term equilibrium is respected when it is not.
5. Technology measures and omitted variables
5.1. Returns to scale
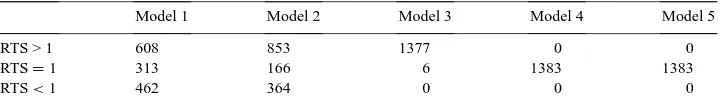
Table 2
Average return to scale
Model 1 Model 2 Model 3 Model 4 Model 5
Average return to scale 0.71 0.96 2.4∗
1.93∗
1.98∗ ∗indicates that the coefficient is statistically significantly different from that of model 1 (P <0.01).
Table 3
Distribution of hospitals by returns to scale
Model 1 Model 2 Model 3 Model 4 Model 5
RTS > 1 608 853 1377 0 0
RTS=1 313 166 6 1383 1383
RTS<1 462 364 0 0 0
size of the hospital can be controlled through policy decisions. In an environment such as Québec characterized by large rural areas, there is no reason to expect constant returns to scale across hospitals. Table 2 shows that results differ widely across specifications and that results based on models 3–5 are statistically significantly different from that of model 1 (P <0.01). Not only does the average level of return to scale vary significantly from one model to the next but the shape of the cost function is also quite sensitive to the omission of variables. Table 3 reports the number of hospital years for which returns to scale are statistically significantly (P <0.05) >1, not different from 1, and<1. The total number of hospital years in the sample is 1383.
The results in Table 3 are striking. They imply that omitting case mix will lead the researcher to mischaracterize a hospital’s returns to scale in at least 35% of cases. Further-more, omitting additional minor outputs (laundry, cafeteria and laboratory services sold to outpatients) will erroneously suggest that all hospitals have increasing returns to scale when, in the preferred model, they are distributed quite symmetrically around constant returns to scale with only 44% of hospitals having increasing returns to scale. Worse yet, models that include inpatients as the hospital’s only output will characterize all hospitals as operating at minimum long-run cost when in fact, only 22% truly are. This could lead to major errors by policy makers and hospital administrators alike if they relied on such analyses.
5.2. Technological change
With or without variable omission, Table 4 indicates a slight negative technological change. However, the model that omits the most variables confirms that the measure of
Table 4
Technological change
Model 1 Model 2 Model 3 Model 4 Model 5
Average technological change −0.004 −0.007∗ −0.007∗ −0.010∗ −0.015∗ ∗
Table 5
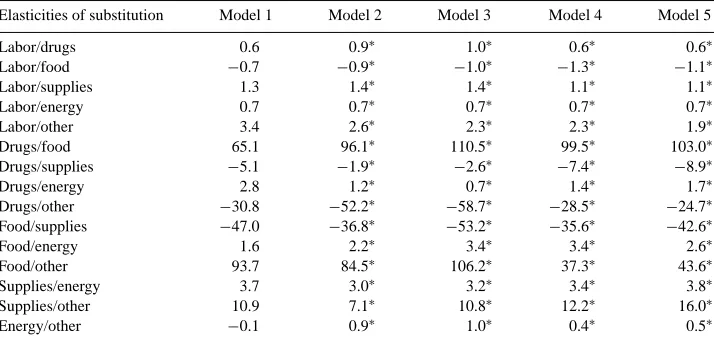
Elasticities of substitution
Elasticities of substitution Model 1 Model 2 Model 3 Model 4 Model 5
Labor/drugs 0.6 0.9∗ 1.0∗ 0.6∗ 0.6∗
Food/supplies −47.0 −36.8∗
−53.2∗ ∗indicates that the coefficient is statistically significantly different from that of model 1 (P <0.01).
technological change is in fact a measure of our ignorance. It captures not only the movement of the cost frontier over time but also the impact of omitted variables. All the models that omit variables (models 2–5) result in estimations of technological change that are statistically significantly greater than the results from model 1. Omitting case mix leads to an overestimate of technological change by a factor of two while omitting case mix and other outputs leads to overestimates by a factor of three to four.
5.3. Elasticities of substitution
We estimated the elasticities of substitution across all variable input pairs (Table 5). This yielded 15 elasticities for the six inputs included in our analysis. In general, elasticities of substitution are quite sensitive to specification error since they involve second-order terms. However, the variations observed here, while statistically significant, are of surprisingly small magnitude. Only one sign changes and, in most cases, the order of magnitude is the same under all models. Even though in some cases, the actual value of the elasticity varies by a factor of two or more when the model is changed, the directional relationship between any two inputs remains the same.
6. Performance measures and omitted variables
6.1. Performance
Table 6
Total excess cost resulting from below average performance (in billion of Canadian dollars)
Model 1 Model 2 Model 3 Model 4 Model 5
Excess cost 1.565 1.579 1.574 1.468 1.511
performance and excess costs incurred by hospitals whose performance was below average, can be evaluated. Table 6 shows aggregate excess costs incurred by the health care system because of hospitals whose efficiency was below average. Clearly, the average would change as hospitals improved but this metric is one way to evaluate the cost of inefficiencies.
For all five models reported in Table 6, the potential savings are stable at around $1.5 billion dollars out of a total budget of roughly $5.5 billion in 1992. This is noteworthy since the estimated aggregated losses from poor performance are robust to mis-specification even in model 5, which omits all outputs except inpatients, all quasi-fixed factors except buildings and includes no case mix. However, information on the aggregate losses associated with below average performance is of little use unless specific hospitals can be identified as above or below average. Using the relative distribution of hospitals in the reference model according to performance, Table 7 indicates that less than 70% of hospitals are correctly identified as best or worst performers based on the mis-specified models. This implies that public policy based on even slightly incomplete models could incorrectly assess the performance of close to one third of hospitals.
6.2. Estimating performance in the presence of omitted variables
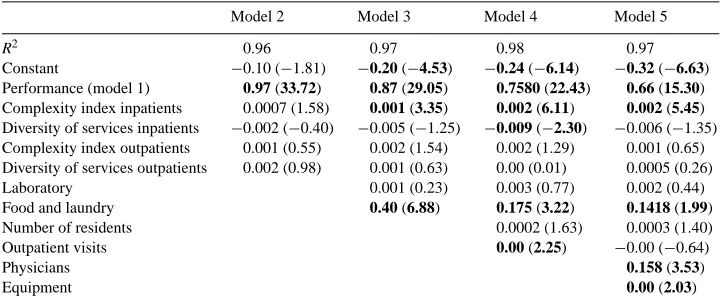
Table 7 suggests that performance is the sum of (1) the gap between the hospital cost frontier and the reference hospital’s cost function and (2) the bias due to omitted variables. To clarify the source of omitted variable bias when assessing performance, we regressed the performance measure from the mis-specified models (models 2–5) on the performance measure from the best model (model 1) as well as on the omitted variables for the last year in our sample (1992). If the omitted variables are statistically significant regressors, it suggests that the measure of performance in a mis-specified model reflects in part the omitted variable bias.
As expected, Table 8 indicates that the most important determinant of performance (excess cost for each hospital) under models 2–5 is the actual performance measure from model 1. However, this relationship becomes significantly less important as more variables are omitted. In fact, the coefficient on the performance variable observed for each model is an indicator of the quality of a performance index obtained using incomplete data. The lower the partial correlation, the less accurate the measure of performance.
Table 7
Percent of hospitals which remain within their quintile for each model
Model 1 Model 2 Model 3 Model 4 Model 5
100% 68.4%∗
67.5%∗
68.4%∗
Table 8
Impact of missing variables on performance measures (1992)a
Model 2 Model 3 Model 4 Model 5
R2 0.96 0.97 0.98 0.97
Constant −0.10 (−1.81) −0.20 (−4.53) −0.24 (−6.14) −0.32 (−6.63)
Performance (model 1) 0.97 (33.72) 0.87 (29.05) 0.7580 (22.43) 0.66 (15.30)
Complexity index inpatients 0.0007 (1.58) 0.001 (3.35) 0.002 (6.11) 0.002 (5.45)
Diversity of services inpatients −0.002 (−0.40) −0.005 (−1.25) −0.009 (−2.30) −0.006 (−1.35) Complexity index outpatients 0.001 (0.55) 0.002 (1.54) 0.002 (1.29) 0.001 (0.65) Diversity of services outpatients 0.002 (0.98) 0.001 (0.63) 0.00 (0.01) 0.0005 (0.26)
Laboratory 0.001 (0.23) 0.003 (0.77) 0.002 (0.44)
Food and laundry 0.40 (6.88) 0.175 (3.22) 0.1418 (1.99)
Number of residents 0.0002 (1.63) 0.0003 (1.40)
Outpatient visits 0.00 (2.25) −0.00 (−0.64)
Physicians 0.158 (3.53)
Equipment 0.00 (2.03)
aT-statistics are in parenthesis and statistically significant coefficients (P <0.05) are in bold.
In most cases, the case mix variables are of limited importance in explaining the perfor-mance measures from the mis-specified models. Coefficients are typically not significant and, in all case, very small. This is also true for measures of laboratory output, teaching output, and outpatient visits. However, the omission of physicians and hotel services does matter. This reinforces previous results (Bays, 1980; Jensen and Morrisey, 1986a,b) sug-gesting that physician input should be included in any cost function estimation, even if the associated expense is not included in operating costs. A relatively new result is that the omission of a seemingly minor output (hotel services) that has always been overlooked in previous work could lead to biased performance measures at least in the Québec setting where such services are often shared, sold or bought.
7. Conclusions
Cost function estimations are commonly relied upon by academics examining the prop-erties of health care delivery and, in at least one instance, by policy makers specifically interested in hospital performance, returns to scale, returns to scope, etc. (Ministère de la Santé et des Services Sociaux, 1992). However, some evidence suggests that results from such estimations might be prone to bias resulting from mis-specified models in general and omitted variables in particular. In a systematic evaluation of the robustness of performance measures and production function characteristics to omitted variables, this research sug-gests that incomplete data can have very serious consequences. The data set relied upon to develop a benchmark is rather complete; however, as in most other studies of this type, data limitations preclude the measurement of quality of care.
along the usual U-shaped cost curve and exhibit decreasing, increasing, or constant returns to scale depending on the institution when all outputs are considered. Similarly, the extent of technological change is overstated by a factor close to four when the model is seriously mis-specified. On the other hand, other characteristics of the production function such as elasticities of substitution are quite robust to omitted variable bias.
Second, we find that characterizing the performance of a specific hospital is quite sen-sitive to model specification. For 32% of hospitals, using a mis-specified model (omitting case mix or omitting outputs other than inpatients, for example) will mischaracterize their performance quintile. On the other hand, results from tests of the theory underlying cost function estimation show robustness to specification error.
These results raise serious doubts about the applicability of parametric cost function estimation to hospital performance in the absence of complete data. Based on our results, we cannot determine the absolute magnitude of the bias resulting from omitted variables since our reference model might itself suffer from some bias. However, in light of this research, one could argue that the relative loss of accuracy resulting from even minor omissions is such that researchers should probably refrain from using such methods when their data is incomplete.
References
Banks, D., 1993. Voluntary and proprietary hospital behavioural response to socio-economic stimuli. Applied Economics 25, 853–868.
Bays, C.W., 1980. Specification error in the estimation of hospital cost function. The Review of Economics and Statistics 62, 302–305.
Bilodeau, D., Crémieux, P.-Y., Ouellette, P., 2000a. Hospital cost function in a non-market health care system. Review of Economics and Statistics 82, 1–11.
Bilodeau, D., Crémieux, P.-Y., Ouellette, P., 2000b. Hospital technology in a non-market health care system. Southern Economic Journal, in press.
Breyer, F., 1987. The specification of a hospital cost function: a comment on the recent literature. Journal of Health Economics 6, 147–157.
Cowing, T.G., Holtmann, A.G., 1983. The multiproduct short-run hospital cost function: empirical evidence and policy implications from cross-section data. Southern Economic Journal 49, 637–653.
Cowing, T.G., Holtmann, A.G., Powers, S., 1983. Hospital cost analysis: a survey and evaluation of recent studies. Advances in Health Economics and Health Services Research 4, 257–303.
Diewert, W.E., 1971. An application of the Shephard duality theorem: a generalized Leontief production function. Journal of Political Economy 79, 481–507.
Diewert, W.E., 1992. Fisher ideal output, input, and productivity indexes revisited. Journal of Productivity Analysis 3, 211–248.
Dor, A., Farley, D.E., 1996. Payment source and the cost of hospital care: evidence from a multiproduct cost function with multiple payers. Journal of Health Economics 15, 1–21.
Eakin, B.K., Knieser, T.J., 1988. Estimating a non-minimum cost function for hospitals. Southern Economic Journal 54, 583–597.
Eakin, B.K., Kniesner, T.J., 1992. Estimating a non-minimum cost function for hospitals: comment. Southern Economic Journal 54, 1114–1121.
Gagné, R., Ouellette, P., 1998. On the choice of functional forms: summary of a Monte Carlo experiment. Journal of Business Economics and Statistics 16, 118–124.
Granneman, T.W., Brown, R.S., Pauly, M.V., 1986. Estimating hospital costs: a multiple-output analysis. Journal of Health Economics 5, 107–127.
Jensen, G.A., Morrisey, M.A., 1986b. Medical staff speciality mix and hospital production. Journal of Health Economics 5, 253–276.
Koop, G., Carey, K., 1994. Using seminonparametric methods to model hospital cost functions. Journal of Productivity Analysis 5, 141–159.
Lave, J.R., Lave, L.B., 1970. Hospital cost function. American Economic Review 60, 379–395.
Lee, M.L., Wallace, R.L., 1973. Problems in estimating multiproduct cost function: an application to hospitals. Western Economic Journal 11, 350–363.
Ministère de la Santé et des Services Sociaux, 1992. Direction des politiques budgétaires et financières, service des politiques de financement. Méthodologie des mesures de la performance économique globale des établissements, Gouvernment du Québec.
Vita, M.G., 1990. Exploring hospital production relationships with flexible functional forms. Journal of Health Economics 9, 1–21.