Health and endogenous growth
Adriaan van Zon
a,b,∗, Joan Muysken
a,b aMERIT, Maastricht Economic Research Institute on Innovation and Technology,P.O. Box 616, 6200 MD Maastricht, The Netherlands
bFaculty of Economics and Business Administration, Maastricht University,
P.O. Box 616, 6200 MD Maastricht, The Netherlands
Received 9 April 1998; received in revised form 19 June 2000; accepted 6 September 2000
Abstract
The focus of endogenous growth theory on human capital formation and the physical embodiment of knowledge in people, suggests the integration of the growth supporting character of health production and the growth generating services of human capital accumulation in an endogenous growth framework. We show that a slow down in growth may be explained by a preference for health that is positively influenced by a growing income per head, or by an ageing population. Growth may virtually disappear for countries with high rates of decay of health, low productivity of the health-sector, or high rates of discount. © 2001 Elsevier Science B.V. All rights reserved.
JEL classification:I1; O3; O4 Keywords:Health; Endogenous growth
1. Introduction
These days total health costs in Western economies are roughly 8–9% of GDP, whereas expenditures on education account for another 6–7%.1 The expenditures on education are generally motivated by the insight that education provides a strong contribution to economic growth. Health expenditures on the other hand, have been a cause of general concern for some time now, especially because of the seemingly autonomous and permanent character of rises in the corresponding costs. This is due to the fact that a significant part of total health costs are associated with care rather than cure. The former costs have shown a tendency
∗Corresponding author. Tel.:+33-43-3883890; fax:+33-43-3884905.
E-mail address:[email protected] (A. van Zon).
1See OECD (1999) and The Economist Yearbook (1998), respectively.
to rise, largely due to the ageing of the population.2 However, one should not forget that health is also a very important factor in economic growth.
The impact of education on economic growth has been recognised for more than a decade now in economic theory. In his pioneering endogenous growth model, Lucas (1988) un-derlines the principal importance of human capital formation for growth and development in a relatively straightforward manner.3 But, paradoxically, in this and subsequent growth models, it is generally overlooked that human capital formation as a source of growth is quite literally embodied in people.4 Nonetheless, people can provide effective human cap-ital services only if they are alive and healthy. Therefore, the general acceptance of human capital formation as a source of growth also warrants a closer look at how changes in the health-state of the population may influence growth and hence total welfare.5
As observed by Grossman (1972, p. xiii), health contributes to well-being and economic performance in several ways. From a growth perspective, the positive contribution of a ‘good health’ to labour productivity is particularly important. However, the provision of health requires resources. As a consequence, there seems to be a direct trade-off between health and human capital accumulation: an expansion of the health sector may promote growth through increased health of the population, while a contraction of the health sector could also free the resources necessary to promote growth by means of an increase in human capital accumulation activities.6 Moreover, this trade-off is complicated because of the asymmetries in the productivity characteristics of health generation and the accumulation of human capital. Baumol (1967), for instance, takes the health sector as an example of a sector which permits “. . . only sporadic increases in productivity” because “. . . there is no substitute for the personal attention of a physician. . .”, as opposed to human capital accu-mulation activities, which give rise to “. . . technologically progressive activities in which innovations, capital accumulation, and economies of large scale make for a cumulative rise in output per man hour”.7
2For instance, according to Polders et al. (1997, p. xii), roughly 50% of the total rise in health costs between
1988 and 1994 in the Netherlands was due to both an ageing population and factors like technical change and demand shifts. And according to Centraal Planbureau (1999, p. 5), more than one-third of total health expenditures in 1997 in the Netherlands was directly associated with care for the elderly and the (mentally) handicapped. This does not include cure expenditures for these groups of patients.
3See also Romer (1990) and Aghion and Howitt (1992) for examples of human capital formation or knowledge
generation as the source of economic growth.
4A notable exception is Ehrlich and Lui (1991), who focus on the way in which subsequent generations and
the trade between them influence human capital formation, longevity and growth in an overlapping generations setting.
5In Muysken et al. (1999) we show how this point has been recognized in many empirical growth studies, in
particular on economic convergence — see for instance Knowles and Owen (1997) — but not in theoretical growth models.
6This provides an interesting contrast to microeconomic analysis that suggests the existence of complementarity
between health and education. Fuchs (1982), for instance, argues that increases in health investment would lengthen one’s life span, ceteris paribus, and hence increase the returns on investment in education. An alternative explanation would be that a higher level of education would go hand in hand with increases in the preference for health (possibly due to the rise in the opportunity costs of not being healthy).
7Baumol (1967, pp. 416, 423, 415, respectively). It is these differences in productivity that are the cause of
In terms of the growth model, this implies that we assume that the generation of health services is characterised by decreasing returns, whereas human capital accumulation is generally modelled using increasing returns.8 Another asymmetry between health and human capital which should be recognised in the analysis is that health directly affects welfare and therefore should be included in the utility function next to consumption — at least in Western economies. As a consequence, there is also a direct trade-off between resources used in the health sector and the final goods sector.9
In order to analyse both trade-offs and their consequences for economic growth, we extend the endogenous growth framework of Lucas (1988).10 We take into account that health influences intertemporal decision-making in three different ways. First, it serves as the ‘conditio sine qua non’ to the provision of human capital services. Second, the provision of health services directly competes with the provision of labour services allocated to the production of output and time spent on human capital accumulation. The third way in which health influences intertemporal decision-making follows from the observation that health can generate positive utility of its own. In addition to this, we take account of the intertem-poral welfare effects of providing health services through the positive impact on longevity. Our model shares some features with Barro (1990), who looks at the contribution of government expenditures to welfare directly and through government expenditures induced productivity growth in anAK-setting.11 However, unlike Barro (1990), we focus on the embodiment of human capital in people, and the role of the provision of health services in enabling society to reap both the productive effects and the direct welfare effects of having a healthy population. The ‘labour augmentation framework’ of the Lucas (1988) model therefore provides a ‘natural’ point of departure for our analysis.
In our model, we distinguish between the active part of the population and the inactive part. The latter may increase with longevity because of increased health — but this also expands the demand for health services. We assume that the provision of labour services by the active part of the population depends both on the average level of health of the work force and on the amount of human capital per (health-) worker. The idea is that a deterioration of health reduces the number of effective working days embodied in a person and hence in the population. From that perspective, health and human capital are complements, in that a low health status will lead to a low supply of human capital services, ceteris paribus. However, from the perspective of the generation of effective human capital services, the
8Decreasing returns in health services are used in Forster (1989), Ehrlich and Chuma (1990) and Johansson and
Lofgren (1995), increasing returns in human capital generation appear in the growth models mentioned above.
9This is reflected for instance in the fact that, in Western economies at least, a significant part of total health costs
are associated with care rather than cure — mainly because of the ageing of the population. See also Footnote 2.
10Grossman (1972), followed up by, for instance, Muurinen (1982), Forster (1989) and Ehrlich and Chuma
(1990) have concentrated on the provision of health services from a micro economic demand perspective. Meltzer (1997), using ‘intertemporal cost effectiveness analysis’ at the micro-level, even goes as far as defining a lifetime utility maximization problem that internalizes all future costs (medical and non-medical) of medical interventions, through changes in survival probabilities. Our analysis integrates both costs (in terms of consumption foregone) and benefits (in terms of productivity and longevity effects) at the macro-level.
11TheAK-model is the simplest endogenous growth model that exhibits the key property underlying endogenous
provision of health services is also a direct substitute for the generation of human capital. We show that our model defines an optimal mix of the provision of health and human capital accumulation that depends on the parameters describing the characteristics of the entire economy, including the health sector.
Our approach has three distinct features. First, following Lucas (1988), we concentrate on the ‘social planner solution’ of the model. In the absence of externalities, this solution coincides with the ‘market solution’ where agents are consuming, producing and accumu-lating in response to market prices. However, in this model several externalities are present which would be ignored in individual decision making.12 We therefore, concentrate on the ‘social planner solution’.
The second feature of our approach is that we only analyse steady-state situations with balanced growth. That is, we show how the trade-offs mentioned above lead to a situation in the long run in which growth and health depend on the fundamental parameters reflecting technology and taste. The emphasis on differences in steady-state situations is in line with a quite impressive history of comparative growth studies that taught us that conditional con-vergence — in which different steady-state situations can occur — is much more plausible than absolute convergence.13 The transition to the steady-state situation is not part of our analysis. This is analytically impossible without resorting to numerical methods, whereas the insights gained from such an exercise will contribute very little to our present analysis of the consequences of the trade-offs.14
Finally, and in line with the second feature, we assume that in the steady-state both the average health and the age of population are constant. However, they are generated by the model and depend on the fundamental parameters that reflect technology and taste. We can then analyse how differences in technology or taste lead to differences not only in growth performance, but also in the health-state and age of population. As a consequence, exogenous productivity increases in the generation of health services, next to the endogenous efficiency increases in human capital accumulation, or an exogenous rise in the preference for health, can be used to explain long-term changes in the health-state and age of population. At this stage, however, we leave the endogenisation of the processes underlying these parameter changes for further research.15
The remainder of the paper is organised as follows. Section 2 introduces our model of population growth and longevity, while Section 3 describes the health generation process that we want to integrate with the Lucas (1988) model. Section 4 provides an overview of the extended Lucas (1988) model and presents the steady-state solution, while Section 5 shows how changes in the fundamental parameters of the model would affect the steady-state
12The generation of health services have an impact on productivity that would tend to be ignored in individual
decision making.
13For an overview, see for instance, Barro and Sala-i-Martin (1995).
14In a much simpler model, Muysken et al. (1999) analyze the impact of health generation in an exogenous
growth model. They use numerical methods to obtain the market solution. With respect to the dynamics of the model, their main finding is that, depending on the initial sizes of the stocks of physical capital and health, during the transition process optimal expenditures on health are lower or higher than in the steady-state.
15An example is the explanation of the observation of Lapre and Rutten (1993, p. 32) that the value share of
solution. In Section 6 some (policy) implications of the model are discussed, while Section 7 provides a summary.
2. Longevity and population size
We introduce longevity in the model since this enables us to mimic the impact of ageing on growth and welfare by increasing the share of old people in the population. The population model we present here is designed in such a way that longevity can be introduced in the basic Lucas (1988) framework as simply as possible.
The population is subdivided into two parts: a part that is actively engaged in producing output, health services and human capital (‘the young’), and a part that only consumes output and health services (‘the old’). People live up to ageT, but are actively involved in productive activities till ageA. In order to simplify things even more, we assume that each yearnpersons are born that live forTyears with healthg(t) and human capitalh(t), wheret is a time index. At ageT, people leave the population through sudden death. Consequently, the population is uniformly distributed overTyear-classes withnpersons in each year-class — and with identical health levelg(t) and human capitalh(t) per person over the whole population.
We now assume that the ageAat which persons will retire from active participation in productive activities is fixed. Moreover, it seems reasonable to assume that longevityTis proportional to the average health levelgof the population.16 We therefore have
T =µg (1)
whereµis a constant factor of proportion.
From the above, it follows that the number of inactive people is equal to(T−A)n. A rise in longevity will therefore increase the number of inactive people in the economy, thus leading to a rise in the consumptive uses of the health sector, ceteris paribus. Consequently, the total population will increase with longevity. However, when the health level of the population stabilises, the number of births per period exactly matches the number of deaths, so that the population remains constant in the steady-state.
A good health may be also be expected to influence utility directly.17 In our case, this happens through the link between health, longevity and the size of the total population, using the following CIES (Constant Intertemporal Elasticity of Substitution) utility function:18
U= Z ∞
0
e−ρτ gγ C
L
1−γ!1−θ L
(1−θ )dτ, 0< θ <1 (2)
16Since we concentrate on problems associated with an ageing population, we abstract from the impact of wealth
or health on the birth rate. Therefore, the number of births per period does not depend on the health-state of the active population, nor on Malthusian economic circumstances.
17This is noted by Grossman (1972, p. xiii), who says “. . .what consumers demand when they purchase medical
services are not these services per se but rather ‘good health”’.
18In the context of the CIES function, we ignore the possibility thatθ =1, in which case we arrive at Eq. (2).
whereρis the rate of discount, and 1/θis the intertemporal elasticity of substitution, 0≤ γ ≤1 measures the relative contribution of health to intertemporal utility, compared to per capita consumption. Timet =0 refers to the present, total private consumption isC, while L=nTis the size of the population.
Since(C/L)(1−γ )(1−θ )L =C(1−γ )(1−θ )L1−(1−γ )(1−θ ), longevityTis an implicit argu-ment (throughL) of the utility function that contributes positively to utility (cf. Eq. (1)), next to the direct contribution of health in caseγ >0.19
3. The generation of health services
Because we want to integrate health and growth in an endogenous growth framework, we use a specification of the production characteristics of the health sector and its impact on health, that is as simple as possible. In order to integrate the notion of productivity increases due to human capital accumulation and decreasing returns, it is instructive to link up with some of the features of the Romer (1990) model. We describe our model of the generation of health services in dynamic terms. Since in the steady-state health will be constant, however, we will just use the implied steady-state relationship between health services inputs and health output as an implicit health production function. This paragraph provides the notions underlying that production function.
As mentioned above, we assume that the labour force consists of active people, and measured in physical units, it is constant. We assume furthermore that the amount of effective labour services that a person can supply is directly proportional to his average health level and human capital. Therefore, the supply of labour measured in efficiency units equals hgnA.
In the medical profession, there are two kinds of productivity gains: those from special-isation and those associated with individual specialspecial-isations becoming more productive due to increased knowledge within the field, or improved medical practices. Let us assume that the number of relevant specialisationsΩ grows with the same rate as the human capital index, i.e.Ω=π h. Knowledge within the field is assumed to grow with the rate of growth of human capital per person. However, the provision of health services takes place under conditions of decreasing returns — see, for instance, Forster (1989), Ehrlich and Chuma (1990), and Johansson and Lofgren (1995). Hence, the average health level of the population rises less than proportionally with the amount of health services rendered per person.
Let a fractionvi of effective labour services be used as the sole input into the health
generation process for specialisation i. Then vihgnA/(nT) will measure the number of
healthy hours spent on providing health services for specialisation i per person. Then, following the specialisation argument put forward in Romer (1990), the gross increase in the average health level of the population is given by20
19Because 0< θ <1 and 0<=γ <=1, it follows that 1−(1−γ )(1−θ ) >=0.
20Note that this specification assumes that the demand for health services is the same for all age-classes, which is
dg whereψ is a productivity parameter andv represents the share of total effective labour supply employed in the health sector. The condition 0< β≤1 reflects the assumption of decreasing returns in health generation.
Technological change does not only have positive effects on health, though. It is quite conceivable that increases in the technological content of an average workers’ job has led to higher incidences of burn-out due to stress, etc. Moreover, demand for medical care, i.e. the perception of health deterioration, will increase with the average level of medical technology in a society.21 We take this into account by assuming that the percentage loss of labour time due to these technology related factors is proportional to the level of technologyπhwith factor of proportionς.The net increase in the average health level is now given by
An interesting feature of the health generation process is that it is inherently stable in the long run. It can easily be observed that for any given positive value of the share of the health sector in total employmentv, the health levelgwill converge tog∗. The latter can be obtained by setting dg/dt =0 in Eq. (3), which yields
wherez0 is implicitly defined by the equivalence of the right most part of Eq. (5) and its middle part. As one might expect, a higher share of employment in the health sector will result in a higher equilibrium health levelg∗, while human capital formation as such increases the speed of adjustment towards that equilibrium level.
4. Health and the Lucas model
As we mentioned earlier, health enters the intertemporal decision framework in three different ways.First, a fall in the average health level of the population may be expected to cause a fall of the amount of effective labour services that the population can supply.22 Second, the generation of health takes scarce resources that have alternative uses (like the production of output or human capital), whilethird, a good health may be expected to influence utility directly. As we have discussed above, the latter includes the link between health, longevity and the size of the total population.
21This argument is also used in Fuchs (1982).
22Grossman (1972, p. xiii) states: “. . .the level of ill-health measured by the rates of mortality and morbidity,
Using the description of the health sector as given in the previous sections, the Lucas (1988) framework can be extended in a straightforward manner. The production structure is represented by
Y =B(1−u−v)hgnAαK1−α (6)
whereYmeasures total output,Kthe capital stock andBis a constant productivity parameter. Note that a fraction (1−u−v) of the supply of labour in terms of efficiency units is used in final output production, and the remaining fractionsuandvare spent on human capital accumulation and health services production, respectively.
The human capital accumulation process has the same properties as in Lucas (1988) — the only difference is that we take health explicitly into account. Hence
dh
dt =δugh (7)
whereδis a productivity parameter. Finally, the accumulation of physical capital is given by
dK
dt =Y −C (8)
As we explained in the introduction, we follow Lucas and concentrate on the so-called ‘social planner solution’. To solve the model, intertemporal utility (2) should be maximised with respect toC, the allocation of consumption over time, anduandv, the allocation of labour over its different uses, subject to the conditions (6), (7), (8) and (4).23 Using the method of optimal control, it turned out to be impossible to find a closed form solution to the optimisation problem. In order to simplify matters therefore, we use the insight presented above that, for a constant steady-state allocation of effective labour services as we find in Lucas (1988), the health generation process is inherently stable in the long run. This implies that the health level will always converge tog∗defined in Eq. (5). We therefore replace the constraint of Eq. (4) by that ofg=g∗defined in Eq. (5). This is consistent with the focus of our analysis on long-term developments and balanced growth situations. Consequently, the out of steady-state behaviour of the health-state of the population will not be analysed, as stated in the introduction. And although the revised system still doesn’t allow us to obtain a closed form solution, we can rearrange it in such a way that we can employ a graphical solution method instead.
The first order conditions that the steady-state growth solution of the revised model has to obey can now be condensed into the following simultaneous equation system:24
f =c2−αc (9.A)
v= f+α(1−α)(1−θ )(1−γ )/(θ+(1−θ )2γ )
f+((1+β)/β)α(1−α)(1−θ )(1−γ )/(θ+(1−θ )2γ ) (9.B)
23We simplify the original Lucas model somewhat by dropping the knowledge spill-over effect, which is not an
essential ingredient of endogenous growth. The original Lucas model (without the knowledge externality) can be obtained by dropping (4) and settingv=0,g=1 andA=Lin (6) and (7).
c=1− (1−α)r
(θ+γ (1−θ ))r+ρ (9.C)
r= δ(1−v)z0v
β−ρ
θ+γ (1−θ ) =
δg∗(1−v)−ρ
θ+γ (1−θ ) (9.D)
u= 1−c
1−α(1−v) (9.E)
wherecis the average propensity to consume andris the balanced growth rate of the system. It should be noted that Eq. (9.D) is completely comparable to Lucas’ growth results, i.e. r=(δ−ρ)/θ, forg=1,v=0 andγ =0. From Eq. (9.D) it follows that the rate of growth rises with the productivity of both health generation and the human capital accumulation process. It also rises with the value of the intertemporal elasticity of substitution, which indicates the willingness of people to wait for their ‘consumption’ returns on investment (i.e. postponing current consumption until later). Likewise, a rise in the rate of discount indicates a decline in the valuation of future consumption possibilities, and hence reduces the rate of growth of the system.
Finally, Eq. (9.E) implies that in order to ensure 1−u−v ≥ 0, we needα ≤ c. The steady-state savings rate therefore needs to be smaller than 1−α. This is similar to the result found by Lucas forv=0.25
4.1. A graphical solution
Eqs. (9.A)–(9.D) need to be solved simultaneously, anduwould then follow immediately from (9.E) and the simultaneous solution to (9.A)–(9.D). Unfortunately, that cannot be done in an analytical way. We use a graphical analysis instead. The analysis is based on the observation that Eqs. (9.A)–(9.C) define a relation betweenrandv, just like Eq. (9.D) does. Combining these two relations in ther,v-plane, and seeing how changes in the system parameters then shift these relations about in that plane, will give us information how the steady-state growth solution depends on those parameters.
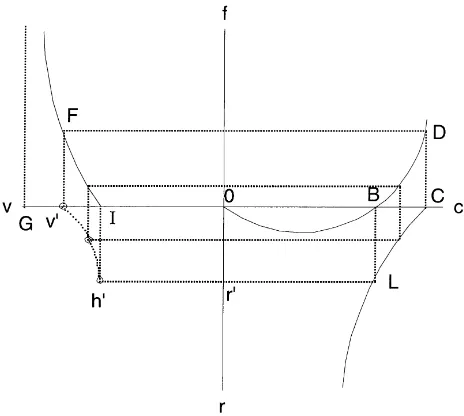
In Fig. 1, we present a four-quadrant diagram to derive the relationship betweenrandv that follows from Eqs. (9.A)–(9.C). Eq. (9.A) is presented in the first quadrant as a relation betweenfandc, where we concentrate on the rangeα≤c≤ 1. It increases fromf =0 atc=αtof =1−αatc=1. Similarly, Eq. (9.C) is represented in the fourth quadrant as a relationship betweenrandc, which decreases fromr =ρ/(1−γ )(1−θ )atc=α tor=0 atc=1. Finally, in the second quadrant Eq. (9.B) is represented as a relationship betweenfandv. It increases fromv =β/(1+β)for f = 0 tov =v′ atf = 1−α, while forfgoes to infinity,vwould asymptotically approach a value of 1.26 The relevant range forv is thereforeβ/(1+β) ≤ v ≤ v′, while the relevant range forris given by 0 ≤r ≤ρ/(1−γ )(1−θ ). Any point within the latter range corresponds with a unique point in the former range by ‘going round’ in Fig. 1 in a counter-clockwise direction — mappingrontoc,contofand thenfontov. The resulting curvev′r′in the third quadrant of
25Cf. Lucas (1988), p. 10.
Fig. 1. A four quadrant diagram.
Fig. 1 summarises Eqs. (9.A)–(9.C). This curve can now be confronted with (9.D) to obtain the simultaneous solution of (9.A)–(9.D).
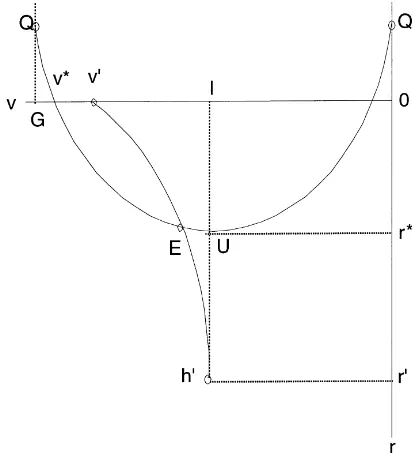
Eq. (9.D) describesras a function ofv. It is represented in Fig. 2, which corresponds to the south-west quadrant of Fig. 1. The curve has the same orientation as in Fig. 1. Eq. (9.D) is concave — it decreases from is maximum atr∗forν=β/(1+β)tor=0 atv∗<1.27 The solution of the model is obtained at the point of intersectionEof Eq. (9.D) and the curvev′h′. A unique solution exists if the curvev′h′is convex and ifr∗< ρ/(1−γ )(1−θ ), v∗> v′.28 We conclude that in the steady-stateY,C,Kandhwill grow at the equilibrium raterE, while health and longevity are constant atg∗EandTE, respectively. The latter are found by substitutingvEinto Eqs. (5) and (1), respectively.
4.2. The trade-offs in the model
The trade-offs mentioned in the introduction that follow from the incorporation of health in the analysis, are now clearly reflected in the results we have obtained so far. The trade-off between health and human capital accumulation can be seen in Eq. (9.D). As we mentioned above, this equation is comparable to Lucas’ growth results, i.e.r=(δ−ρ)/θ, forg=1, v=0 andγ =0. The presence of the term(1−v)in Eq. (9.D) reflects the fact that a fraction
27The way in which r∗ and v∗ depend on the parameters of the model can be summarized by r∗ =
r[δ(+), z0(+), β(+), ρ(−), θ (−), γ (−)] andv∗ = ν[δ(+), z0(+), β(+), ρ(−), γ (+)], where the sign within
brackets denotes the sign of the partial derivative with respect to the parameter in question. These results follow directly from Eq. (9.D) and the requirement thatr(v∗)=0.
28In van Zon and Muysken (1997) we show that for plausible values of the parameters of the model, these
Fig. 2. The south-west quadrant again.
(1−v)of the labour force is not available for the generation of output or human capital, since its task is to maintain the average health level of the population at its steady-state value g∗. This lowers the maximum rate of growth attainable in the extended model as compared to the original Lucas model. The trade-off between consumption and health follows from the observation that, as is shown in the Technical Annex, disregarding the contribution of health to welfare by settingγ =0 and treating the impact on longevity as a pure externality, leads to a growth maximising choice ofv, i.e.v=β/(1+β). But if we do take account of the direct welfare effects of health generation also through its impact on longevity, Fig. 2 shows that the point of intersection between the two curves implies a value ofrthat is lower thanr∗, while in that casev > β/(1+β). Hence, the incorporation of the direct contribution of health to welfare (also through longevity) increases the level of health services at the expense of growth (but not of welfare), ceteris paribus.
5. A comparison of steady-states
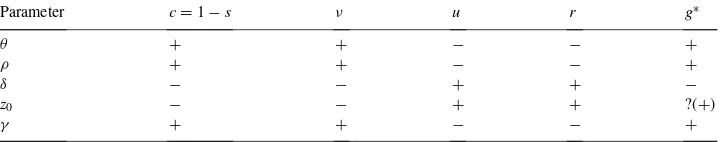
Table 1
Parameter changes and health and growth responses
Parameter c=1−s ν u r g∗
θ + + − − +
ρ + + − − +
δ − − + + −
z0 − − + + ?(+)
γ + + − − +
based on Fig. 2.29 We summarise the results in Table 1, in which positive and negative influences of a positive change in a parameter are indicated by a +sign and a−sign, respectively. Ambiguous reactions are indicated by a question mark followed by a sign within brackets, which indicates the sign we would expect.
The first thing to notice from this table is the negative correlation between the effects of a parameter change on growth and on the propensity to consume. This is due to the fact that there is a positive correlation between the saving ratesand the rate of growth itself. The reason is that for a stable value of the capital output ratio, a rise in the saving rate is required in order to sustain a higher rate of growth. Secondly,v andu are negatively correlated, instead of positively as suggested by micro economic analysis.30 In our model, the negative correlation exists because both health production and human capital accumulation compete for the same scarce labour resources, for a fixed size of the active labour force measured in physical units. Thirdly, there is in most cases a negative correlation between the level of health and the rate of growth. This follows from the positive impact of increased health on longevity, which in its turn increases the demand for health care, at the expense of growth. Let us now turn to the interpretation of the individual results. A rise inθ implies a fall in the value of the intertemporal elasticity of substitution. This means that people become more reluctant to wait for their return on investment, and consequently they are inclined to increase current consumption of goods, but also of health services. This is reflected in a rise in the steady-state values ofc,vandg∗, accompanied by a fall inritself, but also in u. Note that a rise inθalso implies an increase in the relative contribution of longevity to welfare, as we discussed in Section 2.
The results for a rise inθare very similar to those obtained for a rise in the rate of discount ρ.31 This is to be expected since a rise inρreflects the decrease in the subjective valuation of the utility derived from the consumption of a certain package of goods and health-services in the future relative to the valuation of the utility of that same package when it would be consumed today. Hence, one would expect people to spend more resources on fulfilling
29Basically, the analysis consists of calculating the shifts of the two relations betweenvandrin Fig. 2 due to
a change in one of the parameters, in order to see how the new equilibrium would be affected. These shifts can be calculated directly by differentiatingr=r(v)as given by (9.D) with respect to the various parameters, or by differentiating the ’chain’ of relationsc=c(r),f=f (c), andv=v(f )as given by (9.A)–(9.C) with respect to those parameters to obtain the shift inνfor a given value ofr. For the full technical details, see Annex F of van Zon and Muysken (1997).
30Cf. Fuchs (1982), for instance, as is elaborated in Footnote 5.
current needs, by redirecting labour input to activities that increase present consumption possibilities, rather than future ones. Consequently,c,vandg∗rise, whilerandufall.
A rise in the productivity of human capital accumulation, i.e.δ, has quite different effects. Since the latter increases the marginal benefits of investing in human capital accumulation, a reallocation takes place of labour from activities that increase current utility to activities that increase future utility. Consequently, growth is positively affected. In order to make this possible,candvfall, whileuandrincrease. Alsog∗falls because of the reduction inv. The previous results are very similar to those obtained for an increase in the productivity of the health sector, i.e.ψ, which corresponds to an increase inz0(see Eq. (5)). This corrobo-rates the ‘engine-like’ features of the health sector that we pointed out in Section 1. Because an increase inψwould tend to increaseg∗for a givenv, it would also permanently increase the productivity of the human capital accumulation process. The productivity increase in the health sector then enables a contraction of the allocation of labour resources to that sector (vfalls). The net effect ong∗is therefore ambiguous, but one would expectg∗to rise,32 which in turn makes investment in human capital accumulation more profitable because of its intertemporal spill-over effects. Henceurises, and so doesr. Similar results are readily obtained for the other structural parameters that definez0. We do not repeat them here.
A rise in the direct impact of health on utilityγ has all the expected effects. It reduces growth and raises average health by changing the allocation of human capital in the direction of health production. In addition to this, the average propensity to consume can rise, because of the slow down in growth.
Finally, it is worth mentioning that the effective productivity of the health sector may be that low (either due to a high value ofςor low values ofβ,ψorA/µ), that the curve given by Eq. (9.D) describes just a few instances ofvthat generate (moderately) positive growth.33 Such parameter constellations may be relevant for the poorer developing countries, for example. In that case, aid aimed at changing the system parameters mentioned above, may well help growth to take off. Growth may even become self-sustaining if medical aid succeeds in raising life expectancy, and lowering the rate of discount which, by shifting Eq. (9.D), would lead to more promising growth potentials. It should be noted that for the richer countries too, a rise inγwould result in a reduction in growth performance. However, in the latter case that would be choice rather than fate.
6. Model implications
The model has a number of interesting implications. Before pointing these out, how-ever, we would like to stress again that our analysis applies to long-term developments
32In the decreasing returns setting we have defined, one would expect a reaction to an exogenous shock not to
be able to wipe out all the effects of such a shock, because such a reaction would involve the re-allocation of resources which were initially allocated in such a way as to generate maximum overall benefits for a given stock of scarce irreproducible labour resources. In fact that is exactly what we found during exploratory simulations with our model using ‘reasonable’ parameter values, where we observed a fall ing∗despite the rise invwhich is
required to counter the effects of a rise inς. Note that a rise inςwould have the same effect as a fall inψ. See van Zon and Muysken (1997) for more details.
33This might also be caused by a high value of the rate of discountρor a high value of the relative contribution
and balanced growth situations. The phenomena we discuss here — like the productivity slow-down — could be interpreted to occur in the transition to a steady-state growth sit-uation, in which case they would have to be explained from the transitional dynamics of the growth model. However, they could also be explained as the outcome of a process of balanced growth, where different situations correspond to different parameter constellations regarding technologies and tastes. We present the latter explanation in this analysis.
First of all, the fact that we have a decreasing returns health sector which level of activity defines the effective availability of human capital within the economy, makes the efficiency of this sector one of the central determinants of economic performance. Indeed, the no-tion that effective inputs of human capital and labour into the various producno-tion processes depend on one’s health status, makes health a complement to growth from a supply per-spective. Moreover, a change inψorς (and to a lesser extentAandµdepending on the value ofβ(cf. Eq. (5)) is as important for growth as an equal proportional change inδ. This stresses the importance of health as a determinant of both the level and the growth of labour productivity, quite apart from the direct positive welfare effects induced by changes in the productivity of the health sector.
Second, the influence of the decreasing returns nature of the health sector on growth provides an interesting alternative explanation for the productivity slow-down. If, as seems reasonable to assume, the preference of people for a good health rises with the standard of living, i.e.γ rises with output per head, then growth would automatically slow down in the process.
Third, the average age of the population in Western European economies has shown a tendency to rise during the last decades. This introduces a wedge between the two functions of the population in our model. It is the active population that determines labour supply, and hence the scale of all economic activities which rely on the use of labour services, while the total population determines the scale of the demand for health-services. Hence, techno-logical breakthroughs in medicine could be expected not only to boost overall productivity, but also to provide a brake on productivity growth, although not necessarily on the growth of welfare, through rises in longevity.
Fourth, in the case of high values of the rate of decay of health, due to malnutrition for instance, people may have such a high preference for consumption now, reflected by a low value of the intertemporal elasticity of substitution (i.e. a high value ofθ), that they could become stuck in a ‘no growth’, ‘low health’ situation because there are only very few, if any, instances ofvwith positive growth. This suggests that policies aimed at furthering growth by means of reducingζ, or increasingδH, through direct aid in the form of technology or
income transfer, may induce growth which is sufficiently high to lower the rate of discount ρand increase the intertemporal elasticity of substitution 1/θto such an extent, that savings will arise that will allow growth to take-off and become self-sustaining.
7. Summary and conclusion
of decreasing returns, whereas human capital is produced under conditions of increasing returns. If we regard the impact of health on longevity as an externality, we find that the health sector has a size that is consistent with maximum economic growth. In that case, health is a pure complement to growth, and any re-allocation of labour from the health sector towards human capital accumulation activities would cause a decline in growth.
In our model, however, we internalise the impact of health on longevity, because part of total welfare at the population level comes in the form of longevity itself. In order to solve the resulting steady-state values of growth and health, we devised a graphical procedure that enables us to show that increases in the demand for health services caused by an ageing population, will now adversely affect growth; next to being complements, as mentioned above, health and growth have also become substitutes. This provides a dynamic version of Baumol’s disease with respect to the health sector — in particular when the preference of people for a good health rises with the standard of living.
We also concluded that, since the steady-state growth rate rises linearly in the average health-level of the population, the productivity of the health-sector is as important a deter-minant of growth as the productivity of the human capital accumulation process itself.
Finally, we have arrived at the conclusion that there may be circumstances regarding the provision of health-services and life expectancy, in which it may be hard for growth to take place at all. Aid meant to improve the productivity of the health-sector or the net availability of human capital resources for non-health activities in the poorer developing countries, could actually lead to growth taking off on its own. Growth can even become self-sustaining if the rate of discount would fall and the intertemporal elasticity of substitution would rise in the face of structural gains in life expectancy.
Appendix A. Technical annex
The Hamiltonian of the revised system can be written as
H =e−ρtCγ1(nµ)γ2(g∗)γ3/(1−θ )
+λ(B((1−u−v)g∗hnA)αK1−α−C)+ξ δug∗h (A.1) whereC,uandvare the control variables, andKandhare the state variables that grow with the balanced growth rate in equilibrium.g∗ =z0vβ is a ‘quasi’-state variable, since it must be constant in the steady-state. Moreover,γ1=(1−γ )(1−θ ),γ2=1−γ1and γ3=1−(1−2γ )(1−θ ). Note that for a value ofγ ≥1/2 we haveγ3≥1.
The first order conditions with respect to the control variables are
If we would ignore the direct influence of health on welfare as well as the influence through longevity, i.e. treatLas given in the welfare function and not substituting (1) in the welfare function while settingγ =0, Eq. (A.4a) is reduced to
∂H
Substitution of (A.3) in the first order condition∂H /∂h= −dξ /dtleads to the following result
− ˆξ =δg∗(1−v) (A.6)
Assuming the existence of a steady-state, we can use (A.6), (A.2) and the underlying pro-duction function in order to obtain
which is the same as Eq. (9.D). The rate of growth of human capital accumulation is given by
ˆ
h=δug∗ (A.8)
Moreover, from the condition that∂H /∂h= −dλ/dt and (A.2) in combination with the definition,s=(dK/dt )/Y = ˆK(K/Y )andCˆ = ˆK, it follows directly that
s=(1−c)= (1−α)r
(r(θ+γ (1−θ ))+ρ (A.9)
which is equivalent to Eq. (9.C). Substituting (A.8) into the numerator of (A.9) and (A.7) into the denominator of (A.9), we have
(1−c)=(1−α)u
References
Aghion, P., Howitt, P., 1992. A model of growth through creative destruction. Econometrica 60, 323–351. Barro, R.J., 1990. Government spending in a simple model of endogenous growth. Journal of Political Economy
98, S103–S125.
Barro, R.J., Sala-i-Martin, X., 1995. Economic Growth. McGraw-Hill, New York.
Baumol, W.J., 1967. Macroeconomics of unbalanced growth: the anatomy of urban crisis. American Economic Review 57, 415–426.
Centraal Planbureau, 1999. Ramingsmodel Zorgsector. Eindrapport tweede fase, Den Haag.
Ehrlich, I., Chuma, H., 1990. A model of the demand for longevity and the value of life extension. Journal of Political Economy 98, 761–782.
Ehrlich, I., Lui, F.T., 1991. Intergenerational trade, longevity, and economic growth. Journal of Political Economy 99, 1029–1059.
Forster, B.A., 1989. Optimal health investment strategies. Bulletin of Economic Research 41, 45–57.
Fuchs, V.R., 1982. in: Fuchs, V.R. (Ed.), Time Preference and Health: An Exploratory Study, Economic Aspects of Health. Conference Report NBER, University of Chicago Press.
Grossman, M., 1972. The Demand for Health: A Theoretical and Empirical Investigation. NBER, Occasional Paper 119, Columbia University Press.
Johansson, P.O., Lofgren, K.G., 1995. Wealth from optimal health. Journal of Health Economics 14, 65–79. Knowles, S., Owen, D.P., 1997. Education and health in an effective-labour empirical growth model. The Economic
Record 73, 314–328.
Lapre, R.M., Rutten, F.F.H., 1993. Economie van de Gezondheidszorg, Leerboek voor universitair en hoger beroepsonderwijs, tweede herziene druk. Uitgeverij Lemma BV, Utrecht.
Lucas, R.E., 1988. On the mechanics of economic development. Journal of Monetary Economics 22, 3–42. Meltzer, D., 1997. Accounting for future costs in medical cost-effectiveness analysis. Journal of Health Economics
16, 33–64.
Muysken, J., Yetkiner, I.H., Ziesemer, T., 1999. Health, Labour Productivity and Growth. MERIT Research Memorandum, 99-030.
Muurinen, J.M., 1982. Demand for health: a generalised grossman model. Journal of Health Economics 1, 5–28. OECD, 1999. Health data 1999: A Comparative Analysis of 29 Countries. OECD, Paris.
Polders, J.J., Meerding, W.J., Koopmanschap, M.A., Bonneux, L., van der Maas, P.J., 1997. Kosten van Ziekten in Nederland 1994. Instituut Maatschappelijke Gezondheidszorg, Instituut voor Medische Technology Assesment, Erasmus Universiteit, Rotterdam.
Romer, P.M., 1990. Endogenous technological change. Journal of Political Economy 5, 71–102.