Risk sharing as a supplement to imperfect capitation:
a tradeoff between selection and efficiency
Erik M. van Barneveld
∗,1, Leida M. Lamers,
René C.J.A. van Vliet, Wynand P.M.M. van de Ven
Department of Health Policy and Management, Erasmus University Rotterdam, P.O. Box 1738, 3000 DR Rotterdam, The Netherlands
Received 13 May 1999; received in revised form 1 August 2000; accepted 28 September 2000
Abstract
This paper describes forms of risk sharing between insurers and the regulator in a competitive individual health insurance market with imperfectly risk-adjusted capitation payments. Risk sharing implies a reduction of an insurer’s incentives for selection as well as for efficiency. In a theoretical analysis, we show how the optimal extent of risk sharing may depend on the weights the regulator assigns to these effects. Some countries employ outlier or proportional risk sharing as a supplement to demographic capitation payments. Our empirical results strongly suggest that other forms of risk sharing yield better tradeoffs between selection and efficiency. © 2001 Elsevier Science B.V. All rights reserved.
JEL classification:G22; I10; I11; I18
Keywords:Health insurance; Risk-adjusted capitation payments; Risk sharing; Selection; Efficiency
1. Introduction
In the late 1990s, competing health insurers in several countries receive capitation pay-ments based on demographic variables from a regulator.2 Additional premiums that the
∗Corresponding author. Tel.:+31-30-2122304; fax:+31-30-2122315. E-mail address:[email protected] (E.M. van Barneveld).
1Address for correspondence: AGIS Groep, P.O. Box 85040, 3508 Urecht AA, The Netherlands.
2We use the term “insurer” for a risk-bearing entity that performs at least some insurance function, i.e. it bears
some or all of the financial risk associated with the variation in individual health care expenditures. The insurer can be a sickness fund as in several European countries, a managed care organization like health maintenance organizations in the US or a capitated health care provider like general practitioner fundholders in the UK in the 1990s. We use the term “regulator” for the entity that specifies the rules in the market with respect to benefits, enrolment and premiums. Moreover, we assume that the “regulator” is responsible for the financing system, as is commonly the case in Europe. In the US, the latter role may be played by a so-called “sponsor” (e.g. an employer). 0167-6296/01/$ – see front matter © 2001 Elsevier Science B.V. All rights reserved.
insurers may quote their members are either absent or subject to community rating.3 Given
these premium rate restrictions and the poor ability of demographic variables to predict individual health care costs accurately, the insurers have a strong incentive for preferred risk selection. Preferred risk selection is an insurer’s selection of those persons that the insurer expects to be profitable.4 If — for whatever reason — imperfectly risk-adjusted capitation payments can not be improved in practice, another way to reduce the insurers’ incentives for selection is to supplement the capitation payments with a form of risk sharing between the insurers and the regulator (Newhouse, 1986; Gruenberg et al., 1986; Wallack et al., 1988; Van de Ven and Van Vliet, 1992). In the present paper, risk sharing implies that the insurers are retrospectively reimbursed by the regulator for some of the expenditures of some of their members. Although risk sharing reduces the insurers’ incentives for selection, it also reduces their incentives for efficiency. In this paper, efficiency refers to efficiency in production. That is, an insurer is more efficient than a competitor if it is able to serve the same population with the same quality of care for lower costs or with a higher quality of care for the same costs.5 We assume that the regulator’s purpose with risk sharing is
to reduce the insurers’ incentives for selection while preserving their incentives for effi-ciency as much as possible. We abbreviate this tradeoff as the tradeoff between selection and efficiency. Moreover, we assume that the regulator has a practical definition of so-called “acceptable expenditures” within the context of the specified benefits package. The calcu-lation of the capitation payments as well as the risk sharing reimbursements that insurers receive is assumed to be based on this definition.6
The purpose of this paper is threefold. First, we present a systematic description of various forms of risk sharing. Second, we describe how the regulator may optimize the tradeoff be-tween selection and efficiency given imperfectly risk-adjusted capitation payments. As far as we know, a thorough description of forms of risk sharing as well as a method for optimizing the selection–efficiency tradeoff has not yet been presented. Third, we present an empiri-cal analysis of the selection–efficiency tradeoffs that take place if demographic capitation payments are supplemented with various forms of risk sharing. Only a few previous studies have analyzed certain forms of risk sharing empirically (Beebe, 1992; Van Barneveld et al., 1996, 1998; Keeler et al., 1998). In comparison with these studies, we analyze one additional form of risk sharing and apply new indicators of an insurer’s incentives for efficiency.
Although risk sharing may be used as a supplement to any capitation formula, we restrict the empirical analysis to demographic capitation payments because these are applied in several countries and are generally available. Moreover, in many countries it appears to
3That is, each insurer has to quote the same additional premium to each member who chooses the same insurance
modality.
4Preferred risk selection is also called cream skimming (e.g. Pauly, 1984; Matsaganis and Glennester, 1994) or
cherry-picking.
5Note that efficiency in production differs from allocative efficiency.
6If the necessary expenditure data are not available, another possibility could be to base the capitation payments
be very difficult to improve such capitation payments in practice. In the case of additional premiums paid by individuals directly to their insurer, we assume that these have to be community rated (cf. footnote 2).
We assume that each individual has a periodic choice of insurer and insurers may take actions such as designing, pricing and marketing their products to attract or deter enrollees. We further assume that the regulator specifies a certain benefits package covering acute care, like hospital care, physician services and prescribed drugs. The insurers are allowed to offer different modalities of this specified benefits package and to contract selectively with providers of health care.7
The empirical illustrations in this paper are based on data from a mandatory insurance scheme (i.e. each individual was obliged to buy a modality of the specified benefits pack-age). However, capitation payments and risk sharing are also relevant for voluntary health insurance. In the latter case, the capitation payments and the risk sharing apply only to those individuals who buy a modality of the specified benefits package.
The paper is organized as follows. First, Section 2 describes forms of risk sharing and a method for optimizing the tradeoff between selection and efficiency. As an illustration of this method, we derive optimal proportional risk sharing variants. In Section 3, we simulate the consequences of four forms of risk sharing as a supplement to demographic capitation payments. Finally, Section 4 summarizes the conclusions and discusses the findings.
2. Conceptual framework
Section 2.1 describes potential forms of risk sharing and the choices that this study makes with respect to these possibilities. Section 2.2 presents a method for optimizing the tradeoff between selection and efficiency and derives optimal proportional risk sharing variants in a theoretical analysis.
2.1. Forms of risk sharing
Because risk sharing can be seen as a mandatory reinsurance program for the insurers in which the regulator acts as the reinsurer, the essential elements of a form of risk sharing are similar to those of a reinsurance contract. Let us assume that the period to which the risk sharing applies is one year for all members for whom some risk is shared. Besides this period, there are four other essential elements of risk sharing: the list of members for whom some risk is shared, the types of care for which the risk is shared, the extent of the risk that is shared, and the price that insurers have to pay to share some risk.
1. If themembers for whom some risk is sharedare known in advance of the year, the risk sharing can be called prospective. If these members become known during the year, the
7Because insurers are allowed to offer different modalities of the specified benefits package, adverse selection
risk sharing can be called retrospective.8An extreme case is risk sharing for all members.
In the case of prospective risk sharing, the regulator might decide for which members some risk can be shared, for instance, members with certain medical conditions or with high prior costs. This can be called “prospective condition-specific risk sharing”. Another option is that insurers are free to select a certain percentage of their members for whom some risk is shared. The latter option will be referred to as “risk sharing for high risks”. An alternative for prospective risk sharing is retrospective risk sharing. Similar as above, we can speak of “retrospective condition-specific risk sharing” and “risk sharing for high costs”.
Condition-specific risk sharing, whether prospective or retrospective, requires a list of (medical) conditions that make members eligible for risk sharing. It is likely that such forms of risk sharing create discussions over which (medical) conditions should be included (Swartz, 1995). Moreover, condition-specific risk sharing could conflict with the privacy rights of insured and there may be a possibility of manipulation, namely by inflating diagnoses to make members eligible for the risk sharing.9 Risk sharing for
high-risks and risk sharing for high-costs can be seen as alternatives for condition-specific risk sharing. Under risk sharing for high risks or for high costs, it is up to the insurers themselves to decide for which of their members they want to share some risk with the regulator. Therefore, discussions over eligibility for risk sharing can be avoided. The regulator only has to specify the percentage of members that each insurer is allowed to designate for risk sharing. Given a certain average percentage of members that each in-surer designates for risk sharing, it could be that the group of designated members under risk sharing for high risks is similar to the group that is designated under a prospective condition-specific risk sharing arrangement. In that case, the insurer’s incentives for se-lection and efficiency will be similar. The same holds for risk sharing for high costs in comparison with retrospective condition-specific risk sharing.
For the reasons mentioned above, we conclude that risk sharing for high risks and risk sharing for high costs have better administrative feasibility10 and are less vulnerable to manipulation than forms of condition-specific risk sharing, while the consequences for the insurer’s incentives for selection and efficiency might be similar. Therefore, and because the focus of this paper is on payments issues, forms of condition-specific risk sharing will not be analyzed empirically.11
2. Thetypes of carefor which the risk is shared could be the same for all members or it could vary between members. In the latter case, the regulator has to decide which types of care can be distinguished and the insurers have to administer the expenditures per type of care. Furthermore, the regulator will have to determine the price of risk sharing that an insurer has to pay for each of these different types of care.
8Retrospective risk sharing cannot be as sharply targeted at reducing the incentives for selection as prospective
risk sharing. On the other hand, it may have other consequences for the incentives for efficiency as well.
9The extent of this problem could be mitigated by using only (medical) conditions with relatively low discretion
as well as by a good monitoring system.
10Under the assumption that both information on the relevant (medical) conditions and the relevant costs is
routinely available.
11The assessment or monitoring of the quality of care is not the main issue in the present paper. If this would be
If insurers would be allowed to share the risk for all types of care, a prospective risk sharing arrangement allows insurers to avoid the financial risk of high-risk applicants in another way besides refusing to sell them insurance.
A distinction between several types of care within the specified benefits package does not seem to go well with a flexible description of the benefits package. This is a major element of competitive health care reforms and should provide insurers with tools for cost-effective substitution of care. Risk sharing for specific types of care might stimulate undesirable substitution of care.12 This could happen if the risk of relatively expensive types of care is shared and the risk for relatively inexpensive care is not. Furthermore, such a risk sharing arrangement might be ‘gamed’ by insurers if they administer health care expenditures of one type of care (for which expenditures are not shared) under another type of care (for which expenditures are shared). In sum, risk sharing with a dis-tinction between several types of care within the specified benefits package may provide perverse incentives to insurers, and seems rather difficult to administer and monitor. For these reasons, the remainder of this study assumes that risk sharing applies to all types of care within the specified benefits package.
3. Theextent of risk sharingmay be the same for all members that are designated for it or it may vary between these members. In the latter case, it can be the regulator that decides the extent of risk sharing or it can be left to the insurers themselves. Such flexible forms of risk sharing require that the regulator determines a price for every possible extent of risk sharing. This might be a difficult task. For this reason, it is assumed that the extent of risk sharing is the same for all members. We let the risk sharing apply to individual members of an insurer and not to the aggregate level of all members of an insurer.13 The risk sharing may apply to all costs of a member, may be limited to the member’s costs above his normative costs,14 or may be limited to the costs above a certain threshold. In each of these variants, risk sharing may apply to a certain percentage of the costs involved.
If the risk sharing applies to all members and all expenditures above a certain threshold are shared, it will be called “outlier risk sharing”. It resembles excess-of-loss reinsurance (Bovbjerg, 1992). If the risk sharing applies to all members and a certain fraction of all expenditures are shared, it will be called “proportional risk sharing”. It resembles quota share reinsurance (Bovbjerg, 1992).
4. The risk sharing can befinancedin several ways. It can be financed externally, internally or via a combination of both. External financing means that there is some external flow of money toward the whole payment system. With such a flow, the risk sharing is not
12An argument in favor of risk sharing for specific types of care within the specified benefits package is that in
some circumstances, insurers have no tools to improve efficiency for certain types of care. For this reason, the Dutch sickness funds have been given little financial responsibility for production-independent hospital costs since 1996.
13Risk sharing on an aggregate level could resemble stop-loss reinsurance. Such a form of risk sharing would
primarily concern the aggregate financial result of an insurer. Because the present study focuses on tradeoffs between selection and efficiency and not on the consequences of risk sharing on insurer level, such a form of risk sharing will not be analyzed.
14The normative costs of a member are the predicted costs by the regulator on which the capitation payment is
budget-neutral.15 However, here we assume that the regulator requires the risk sharing
to be budget-neutral. This can be achieved by an internal financing mechanism, i.e. the risk sharing is financed via mandatory contributions from all insurers in the market.16 This way, risk sharing only shifts (limited) amounts of money from some insurers to others. The contribution that an insurer has to pay can be calculated at the end of the year, when the proportion shared expenditures is known. Like previous studies, we as-sume in the empirical analyses that the normative costs are reduced proportionally to finance the risk sharing (Van Barneveld et al., 1998; Keeler et al., 1998).17 In practice, the regulator can make an estimate of the reduction of the normative costs that will be necessary to finance the risk sharing and reduce the capitation payments immediately at the start of the year. Any deficits or surpluses created this way can be taken care of in the next year.
Given the choices mentioned above, we can describe forms of risk sharing by four parameters:
p: The fraction of members for whom some risk is shared. 0< p≤1. A special case is
p=1, where risk sharing applies to all members.
Ret: Dummy variable that indicates whether the designation of members for risk sharing is done prospectively (Ret=0) or retrospectively (Ret=1).
T: The threshold above which the costs of members are (partially) shared. T ≥ 0. A special case isT =0, where risk sharing applies to all costs of the members.
a: The fraction of the costs of members — possibly above a threshold — that is shared. 0< a ≤1. A special case isa =1, where all costs — possibly above a threshold — are shared.
The following values of the parameters imply no risk sharing:p =0; and/orT = ∞; and/ora =0. The influence of the parameters is roughly as follows: the higher p or a and the lowerT, the more extensive the risk sharing is. Ifp=1,T =0 anda =1, the most extensive form of risk sharing arises: the situation of full cost reimbursement.
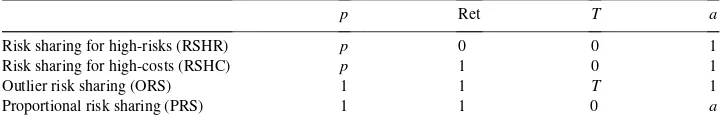
Reducing the possibilities such that each form of risk sharing has essentially one pa-rameter only, gives us four main forms of risk sharing which will be analyzed further (Table 1).
The next subsection describes how the regulator may optimize the tradeoff between selection and efficiency. We restrict ourselves to proportional risk sharing.18 Then, the relevant question is: what is the optimal value of the parametera(i.e. the weight on actual costs)?
15In the study of Beebe (1992), the risk sharing is assumed to be financed externally.
16These contributions are mandatory for each insurer because otherwise some insurers might not want to
partic-ipate in the risk sharing arrangement.
17A more sophisticated financing method would be to quote an amount per risk-group as distinguished in the
capitation formula such that the risk sharing is budget neutral for each of these risk groups. For limited extents of risk sharing, there is no reason to assume that such a refinement of the financing method would alter the conclusions of this paper.
18Ellis and McGuire (1993) call this a family of supply-side payment systems and characterize them by a
Table 1
Description of the four forms of risk sharing we analyzeda
p Ret T a
Risk sharing for high-risks (RSHR) p 0 0 1
Risk sharing for high-costs (RSHC) p 1 0 1
Outlier risk sharing (ORS) 1 1 T 1
Proportional risk sharing (PRS) 1 1 0 a
ap: Fraction of members for whom some risk is shared; Ret: dummy variable that indicates whether the
designation of members for risk sharing can be done at the start of a year (Ret=0) or at the end (Ret=1);T: threshold above which the costs of members are (partially) shared;a: fraction of the costs of members — possibly above a threshold — that is shared.
2.2. Optimal proportional risk sharing variants
We answer the question mentioned above by describing subsequently: feasible payment systems for the regulator, the regulator’s objective function, the regulator’s decision problem and the optimal solution of this problem.
2.2.1. Feasible payment systems
In Fig. 1, any payment system can be represented by a certain point. Thex-coordinate represents the reduction of an insurer’s incentives for selection relative to the situation of flat capitation payments (i.e. the capitation payment is the same for each individual). The y-coordinate represent an insurer’s incentives for efficiency relative to the situation of flat capitation payments. Point A (i.e. (0; 1)) represents “flat capitation payments” and point B (i.e. (1; 0)) represents “full cost reimbursement”. Point C (i.e. (1; 1)) represents the ‘perfect’ capitation formula, because it is assumed that the regulator wants to reduce incentives for
selection as much as possible while retaining incentives for efficiency as much as possible. Thus, the preferences of the regulator satisfy the condition of strong monotonicity.19
2.2.2. Objective function of the regulator
It is further assumed that the preferences of the regulator satisfy the condition of convexity. This assumption implies diminishing marginal rates of substitution given a certain level of the regulator’s utility function. A well-known utility function that satisfies the assumptions of strong monotonicity and convexity is the Cobb–Douglas function which appears to be convenient in our analysis. Therefore, we assume that
U (x;y)=xb×y1−b, where 0≤b≤1 (1)
If the weight on reducing incentives for selection (b) is 0, the optimal payment system is “flat capitation payments”. If this weight is one, the optimal payment system is “full cost reimbursement”.
2.2.3. Model and solution
A demographic capitation formula does not reduce an insurer’s incentives for efficiency relative to “flat capitation payments”. Therefore, such a capitation formula can be repre-sented by a point (x1; 1). In Fig. 1, the point A′ is an example. The line A′B represents
all possible variants of proportional risk sharing that could be used as a supplement to the capitation payments. Therefore, the regulator’s decision problem becomes20
MaximizeU (x;y)=xb×y1−b (2)
Subject to :x =1−(1−x1)y
Simple calculations shows that the optimal solution is
x∗=b; y∗= (1−b) (1−x1)
(3)
Because we are looking on the line A′B, this optimal solution has to satisfy the condition: x∗ > x1. Therefore, this solution is only valid in the case thatb > x1. In the case that b < x1, it is optimal to employ the capitation formula only, because along the line A′B,
U(x;y) then is a decreasing function inx. The optimal weight on actual costs is
a∗=(b−x1) (1−x1)
(4)
Eq. (4) immediately makes clear that the optimal extent of risk sharing depends on the weight (b) that the regulator assigns to reducing incentives for selection versus retaining incentives for efficiency.
19Considerations of validity, reliability, manipulation and feasibility are outside the scope of this analysis. 20This analysis can be generalized to a situation where the capitation formula reduces incentives for efficiency
2.2.4. Graphical illustration
Fig. 1 provides a graphical illustration given demographic capitation payments and given that the weight on reducing incentives for selection (b) is 0.5. It is assumed that demographic capitation payments reduce the incentives for selection to 85% of those under flat capitation payments. Therefore, the point A′ equals (0.15; 1). Given that the weight on reducing
incentives for selection (b) is 0.5, the utility function of the regulator isU (x, y)=√x√y. Eq. (3) gives the optimal point (0.5; 0.588). This point is labeled D in the figure. Eq. (4) gives the optimal weight on actual costs (0.41). The value of the utility function in the optimal point equals 0.54(=√(0.5)√(0.588)).
Unfortunately, the other forms of risk sharing as presented in Table 1 cannot be analyzed analytically. Therefore, in the next section we move to an empirical analysis. Moreover, in an empirical analysis, it is possible to focus on selection of or against certain subgroups and to focus on efficiency for various types of care or various subgroups of members.
3. Empirical analysis
This section presents the empirical analysis of tradeoffs between selection and efficiency if the forms of risk sharing that were presented in Table 1 are used as a supplement to de-mographic risk-adjusted capitation payments. Section 3.1 describes the data set and Section 3.2 the methods. Section 3.3 presents the results.
3.1. Data
The data set contains information for six consecutive years (1988–1993) of 47,210 indi-vidual Dutch sickness fund members of one sickness fund.21 Every member had the same insurance coverage without deductibles or copayments. For the interpretation of the empir-ical results, it is therefore assumed that each individual buys the same insurance modality of the specified benefits package. The data include demographic variables as well as the annual health care expenditures for several types of care and the diagnoses from hospital admissions.
All members in the data set were insured from 1 January 1988 until 1 January 1993. During 1993, 2.7% of the members disenrolled as a result of deaths (1.1%) or switches to other insurers (1.6%). For those that disenrolled, the costs in 1993 are raised to annual rates and at the same time weights are assigned equal to the fraction of the year they were in the data set. This way, the mean costs per person per year remain unchanged.22
With respect to demographic variables, the data set is representative for all Dutch sickness fund members. The mean age is about 40 years and about 55% of the sample is male. About
21All employees (and their family members) earning an annual wage below a certain level are insured compulsorily
in the public health insurance sector by one of the about 25 sickness funds. About two-thirds of the Dutch population is insured this way.
22In practice, dealing with disenrolment might be done differently. However, because in our data set disenrolment
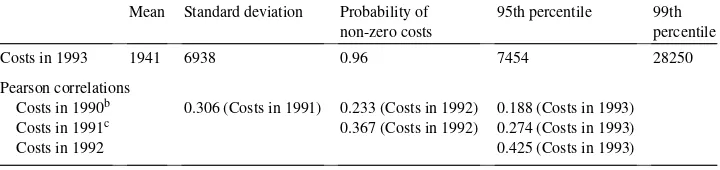
Table 2
Descriptive statistics for costs in 1993 and Pearson correlations between costsa
Mean Standard deviation Probability of non-zero costs
95th percentile 99th percentile
Costs in 1993 1941 6938 0.96 7454 28250
Pearson correlations
Costs in 1990b 0.306 (Costs in 1991) 0.233 (Costs in 1992) 0.188 (Costs in 1993)
Costs in 1991c 0.367 (Costs in 1992) 0.274 (Costs in 1993)
Costs in 1992 0.425 (Costs in 1993)
aN
=47,210.
bThe costs in 1990 do not include the expenditures for prescribed drugs and medical devices because these
are not available in the data set.
cThe costs for prescribed drugs in 1991 are incomplete. Three months are missing. Multiplying these costs
with a factor 12/9 increased the relevant first- and second-order correlations with about 0.01 only.
11% lives in strongly urban areas and about 14% in rural areas. Almost 7% receives a disability allowance.
The annual health care expenditures per person include the costs of inpatient room and board, both inpatient and outpatient specialist care, prescribed drugs, medical devices, paramedical services, dental care, obstetrics and maternity care and sick-transport. The costs of care provided by the general practitioner are excluded because they receive an uniform annual fee for each sickness fund member in their practice regardless of medical consumption. All cost data refer to actual charges. Because the expenditure data for 1988 and 1989 were incomplete, these expenditures are excluded from the present study.
Table 2 shows some descriptive statistics for the costs in 1993 and Pearson correlations for the costs in the four consecutive years. The mean costs in 1993 are Dfl. 1941 and the standard deviation is Dfl. 6938. Therefore, the coefficient of variation is about 3.6 (≈6938/1941). Only 4% of the members did not have any health care expenditures in 1993 at all.
The correlation between the costs in 1992 and 1993 is about 0.4. In comparison with previous research this is rather high (Newhouse et al., 1989; Van Vliet, 1992). A reason is that the present study includes the costs of medical devices and more importantly, prescribed drugs.23
In the analyses we also use the so-called diagnostic cost groups derived from previous hospitalizations as explanatory variables for expenditures.24 Lamers (1998) has developed
such groups specifically for the Dutch situation. The present study uses the latter classifi-cation into five groups.
In 1993, a mailed health survey was conducted under those in the data set (Lamers, 1997). About 15,000 persons received the survey. They formed a random sample of the data set. The net response rate for the total sample was 70.4%. Response was not associated with utilization of care related to severe conditions such as inpatient hospital care.
23Excluding the costs of medical devices and prescribed drugs reduces the relevant first-order correlations by
about 0.05. The relevant second- and third-order correlations reduced by about 0.04 and 0.02, respectively.
24The hospital diagnoses are known in the form of the relevant code from the ICD-9-CM (International
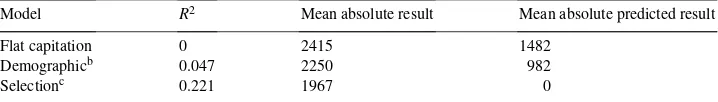
Table 3
Three indicators of incentives for selection for three models to generate cost predictionsa
Model R2 Mean absolute result Mean absolute predicted result
Flat capitation 0 2415 1482
Demographicb 0.047 2250 982
Selectionc 0.221 1967 0
aN = 47,210. These indicators refer to a situation without risk sharing. For the calculation of the mean
absolute predicted results, it is assumed that the insurer uses the selection model to generate cost predictions. Therefore, the mean absolute result for the selection model is 0.
bThe demographic model contains 31 dummies for 5-year age/sex groups, four dummies for degree of
urban-ization and one dummy for disability.
cThe selection model contains demographic risk adjusters plus five dummies for diagnostic cost groups in
1992, 1991 and 1990 plus total costs in 1992, 1991 and 1990 as continuous variable.
3.2. Methods
The methods can be divided into four steps.
1. We first estimate two regression models: a “demographic” model and a “selection” model. Both models are assumed to be linear in the coefficients and include an inter-cept. They are estimated by means of ordinary least squares with the costs in 1993 as dependent variable and the various risk adjusters as independent variables (Table 3). It is assumed that the demographic model is used by the regulator to calculate the normative costs for each member (PCREG). This model contains age, sex, degree of urbanization
and disability as risk adjusters. It resembles the Dutch capitation formula that has been used since 1995. The selection model includes the costs and diagnostic cost groups as additional risk adjusters. It is assumed that the cost predictions based on the selection model are used by the insurer (PCINS) to trace (non)-preferred risks. Given the costs
predictions of the regulator and the insurer, respectively, we calculate the “mean abso-lute result” (MAR) and the “mean absoabso-lute predicted result” (MAPR) as follows (Van Barneveld et al., 2000):
MAR= 1
n
X
|PCREG−AC|; (5)
MAPR= 1
n
X
|PCREG−PCINS|, (6)
wherenis the number of insured, the summation is over all insured and AC the actual costs. To simplify the formulae, a subscriptifor the insured is omitted.25 In another paper, we have suggested to ignore small predictable profits and losses (Van Barneveld et al., 2000). Additional analyses, not presented here, strongly suggested that ignoring small predictable profits and losses does not change the conclusions of the present paper. 2. For each of the four forms of risk sharing, we simulate several variants. Given five parameter values, we calculate the proportion of the expenditures that would be shared between the insurers and the regulator (Table 4). Under risk sharing for high-risks, we
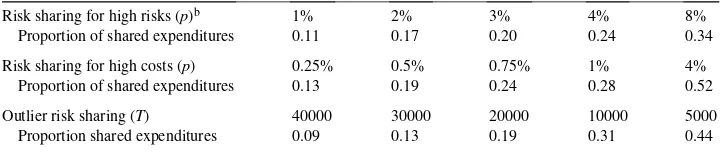
Table 4
Proportion shared expenditures per form and variant of risk sharinga
Risk sharing for high risks (p)b 1% 2% 3% 4% 8%
Proportion of shared expenditures 0.11 0.17 0.20 0.24 0.34
Risk sharing for high costs (p) 0.25% 0.5% 0.75% 1% 4%
Proportion of shared expenditures 0.13 0.19 0.24 0.28 0.52
Outlier risk sharing (T) 40000 30000 20000 10000 5000
Proportion shared expenditures 0.09 0.13 0.19 0.31 0.44
aN
=47,210.
bUnder risk sharing for high-risks, the members for risk sharing are selected on the basis of their costs in the
previous year.
assume that an insurer designates those members with the highest costs in the year immediately preceding (Van Barneveld et al., 1998).
3. After the introduction of risk sharing, the result for a member refers to the financial result after risk sharing. Given the actual costs of each member, its normative costs based on the demographic model, its predicted costs based on the selection model, and the form and variant of risk sharing that is applied, an overall indicator of the reduction of incentives for selection is calculated as
1−(N1,1|MR1,1| +N2,1|MR2,1|) (N1,0|MR1,0| +N2,0|MR2,0|)
(7)
whereN1,1is the number of preferred risks given the normative costs and the predicted
costs based on the selection model andN2,1the number of non-preferred risks.26 MR1,1
is the mean result for the preferred risks given their normative costs, the applied form and variant of risk sharing and their actual costs, MR2,1the mean result for non-preferred
risks.27 N1,0, MR1,0,N2,0and MR2,0are defined similarly for the situation without risk
sharing and with flat capitation payments. In addition to the overall indicator of Eq. (7), we present the mean result for various non-random subgroups.
4. As an indicator of incentives for efficiency we use the insurer’s portion of the efficiency gain given various assumptions on cost reductions that could, ceteris paribus, be achieved by an insurer. This new indicator of an insurer’s incentives for efficiency is explained below.
If the capitation payments are supplemented with a form of risk sharing, the financial result for an insurerj(Rj) equals its normative costs (NCj) minus its actual costs (ACj)
26We define preferred risks as those members for whom the predicted costs based on the selection model are lower
than the normative costs. For non-preferred risks, the opposite holds. Note that the division into (non)-preferred risks is independent of the form and variant of risk sharing. In the case of risk sharing for high risks or outlier risk sharing, an insurer may redefine its (non)-preferred risks. Additional analyses suggested that we slightly overestimated the reduction of incentives for selection in the case of risk sharing for high risks, but not in the case of outlier risk sharing. However, the different results for risk sharing for high risks would not change the conclusions of this paper (see Appendix A).
27Because we assumed that the risk sharing is budget-neutral at the macro-level, in our analyses the two halves of
plus the reimbursement that it receives because of the risk sharing (RSREIMBj) minus the price it has to pay for the risk sharing (RSPRICEj). Thus, in the case of risk sharing
Rj =(NCj−ACj)+(RSREIMBj−RSPRICEj) (8)
Suppose that an insurer can, ceteris paribus, reduce its actual costs. Then, its actual costs and most likely the reimbursement that it receives because of the risk sharing will be lower. Its normative costs and the price of the risk sharing will remain unchanged.28 The total efficiency gain can be split into a portion that is kept by the insurer and a portion that is kept by the regulator. The insurer’s portion of the efficiency gain (IPEGj) equals
IPEGj =1−
1RSREIMB
j
1ACj
(9)
This measure will be used as an indicator of the insurer’s incentives for efficiency. It can vary between 0 and 1. The higher this figure, the higher are the incentives to improve efficiency. Under proportional risk sharing, IPEG equals 1−a. As an overall indicator of incentives for efficiency, we use the insurer’s portion of the efficiency gain under the assumption that the costs for each member are reduced by 10%. Other indicators for incentives for efficiency are calculated under the assumption that the costs for certain types of care or for certain subgroups are reduced by 10 and 20%, respectively. Based on recent literature, such costs reductions seem realistic (e.g. Khandker and Manning, 1992; Miller and Luft, 1994; Enthoven and Singer, 1996; Armstrong, 1997).
3.3. Results
For comparison with other studies, Table 3 shows theR2-values of the regression models as well as the mean absolute result and the mean absolute predicted result (Van Barneveld et al., 2000). For the demographic model theR2-value is about 0.05 and for the selection model it is about 0.22. Based on the correlations and following the method of Van Vliet (1992), it has been estimated that about 25% of the variance among individual annual health care expenditures is predictable in this data set by means of factors reflected in past spending. Hence, we explain about 88% of the estimated maximumR2-value for this data set. This strongly suggests that the selection model can hardly be improved given the available data.29
Based on “flat capitation payments” and the selection model, about 72.9% of the members form the group of preferred risks and about 27.1% form the group of non-preferred risks. Under “flat capitation payments”, the mean profit for preferred risks is Dfl. 1011 and the mean loss for non-preferred risks is Dfl. 2715. If “flat capitation payments” are replaced by
28A small change in the price of risk sharing can be neglected here, provided that the market share of the insurer
is sufficiently small.
29The reason that the selection model here explains such a large part of the maximumR2-value is that it includes the
costs and diagnostic cost groups of three preceding years whereas the maximumR2-value is based on correlations of
costs in 4 years. The true maximumR2-value might be higher. In another data set including costs for six successive
years, Lamers (2000) found a maximumR2-value of 0.33. For some reasons why the maximumR2-value may
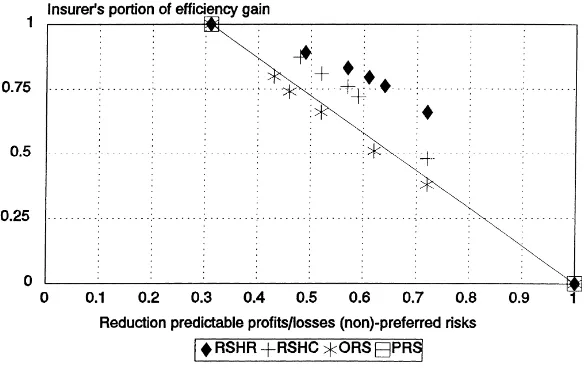
Fig. 2. Results of four forms of risk sharing as a supplement to demographic capitation payments.
the demographic model, about 76.5% of the members are a preferred risk and about 23.5 are a non-preferred risk. Under the demographic model, the mean profit for preferred risks is Dfl. 661 and the mean loss for non-preferred risks is Dfl. 2152. Based on these findings and using Eq. (7) it has been calculated that the demographic model reduces the incentives for selection by 31% in comparison with “flat capitation payments”.30
Table 4 shows the proportion shared expenditures for several variants of the four forms of risk sharing. Under risk sharing for high risks, the proportion shared expenditures is 0.11 if 1% of the members can be designated. If 8% of the members can be designated, the proportion shared expenditures is 0.34. Under risk sharing for high costs, the proportion shared expenditures is 0.13 if 0.25% of the members can be designated. If 4% of the members can be designated, the proportion shared expenditures is 0.52. Under outlier risk sharing with a threshold of Dfl. 40,000, the proportion shared expenditures is 0.09. If the threshold is lowered to Dfl. 5000, the proportion shared expenditures is 0.44.
Fig. 2 presents the results of the four forms of risk sharing as a supplement to demo-graphic capitation payments. The figure shows that risk sharing for high risks as well as risk sharing for high costs yield better tradeoffs between selection and efficiency than outlier risk sharing or proportional risk sharing. Given a certain reduction of the incentives for se-lection, the incentives for efficiency are higher. Similarly, given a certain level of incentives for efficiency, the reduction of the incentives for selection is higher. The performance of outlier risk sharing and proportional risk sharing is almost the same.
Table 5 shows the mean result in 1993 for some subgroups given an overall efficiency level of 80% in comparison with “flat capitation payments”. The regulator may achieve this
30If the mean absolute predicted result would be used as an indicator of an insurer’s incentives for selection,
level by employing risk sharing for high risks for 3% of the members. Other options are risk sharing for high costs for 0.5% of the members, outlier risk sharing with a threshold of Dfl. 40,000 and proportional risk sharing with a weight of 20% on actual costs.31 Fig. 2 suggests that risk sharing for high risks as well as risk sharing for high costs will yield greater reductions of predictable profits and losses than the other forms of risk sharing. However, the results may be different for different subgroups. Table 5 shows that, without any form of risk sharing, there are large predictable profits and losses for various subgroups. For instance, for those without expenditures for prescribed drugs in 1991, the mean profit in 1993 is Dfl. 711. For the 1%-group with the highest expenditures for prescribed drugs in 1991, the mean loss in 1993 is Dfl. 12,118. For those without a chronic medical condition under treatment, the mean profit in 1993 is Dfl. 578. For those that suffer from cancer, the mean loss in 1993 is Dfl. 5570. These findings for the demographic model are comparable with those of previous studies.
For most subgroups, risk sharing for high risks leads to the largest reduction of the predictable profits and losses followed by risk sharing for high costs. For instance, for those without a chronic condition, risk sharing for high risks reduces the mean profit to Dfl. 373 and risk sharing for high costs reduces it to Dfl. 405. Outlier risk sharing and proportional risk sharing reduce the mean profit to Dfl. 491 and 406, respectively. For those suffering from cancer, risk sharing for high risk reduces the mean loss to Dfl. 1171 and risk sharing for high costs reduces it to Dfl. 1940. Outlier risk sharing and proportional risk sharing reduce the mean loss to Dfl. 3449 and 4456, respectively.
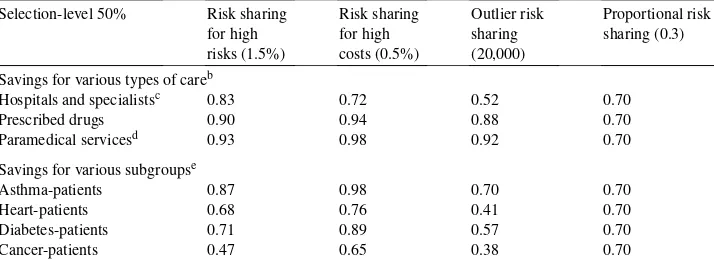
Table 6 shows the insurer’s portion of the efficiency gain given an overall selection level of 50% in comparison with “flat capitation payments” and given various assumptions of efficiency gains that could be achieved. The regulator may achieve this selection level via risk sharing for high risks for 1.5% of the members, risk sharing for high costs for 0.5% of the members, outlier risk sharing with a threshold of Dfl. 20,000 and proportional risk sharing with a weight of 30% on actual costs.32 Fig. 2 suggests that risk sharing for high risks or risk sharing for high costs will retain more incentives for efficiency than the other forms of risk sharing. However, the results may be different for various types of care and for various subgroups of members. If the costs for hospital and specialists care are reduced by 10%, under risk sharing for high risks, the insurer keeps 83% of the efficiency gains and 17% is kept by the regulator. Under risk sharing for high costs, the insurer keeps 72%. Under outlier risk sharing, the insurer keeps 52% only and under proportional risk sharing, it keeps 70%.
If the insurer reduces the costs for prescribed drugs or paramedical services, the insurer’s portion of the efficiency gain is highest in the case of risk sharing for high costs: 94 and 98%, respectively. For risk sharing for high risks and outlier risk sharing, the insurer’s portion of the efficiency is also rather high (about 90%). For proportional risk sharing, it is 70% only.
31In Fig. 2, they-coordinate of risk sharing for high-risks (3%), risk sharing for high costs (0.5%) and outlier risk
sharing (Dfl. 40,000) is about 0.8. In the Appendix A, we present a similar table where the overall efficiency level is 65% in comparison with “flat capitation payments”.
32In Fig. 2, risk sharing for high costs (0.5%) and outlier risk sharing (Dfl. 20,000) have anx-coordinate of about
Table 6
Insurer’s portion of the efficiency gain given an overall selection level of 50% in comparison with flat capitation paymentsa Savings for various types of careb
Hospitals and specialistsc 0.83 0.72 0.52 0.70
Prescribed drugs 0.90 0.94 0.88 0.70
Paramedical servicesd 0.93 0.98 0.92 0.70
Savings for various subgroupse
=47,210. The overall level of incentives for selection is based on the profits for preferred risks and the losses for non-preferred risks.
bThe three types of care form about 90% of the total expenditures.
cAs of 1993, the Dutch government required the sickness funds to administer a large part of the specialists care
under the hospital care. Because the distinction between these two types of care is vague, they are taken together in one type of care. Sick-transport often is transport to a hospital. Therefore these costs are also included in the first type of care.
dParamedical services mainly consists of physical therapy (about 95%). eN=10,553.
The subgroups that are distinguished in Table 6 could be selected by an insurer for the application of disease management. The results indicate that under risk sharing for high costs, the insurer’s portion of the efficiency gain will be higher than under the other forms of risk sharing. Under risk sharing for high costs, the insurer’s portion of the efficiency gain varies from 65% for cancer-patients to 98% for asthma-patients. Under outlier risk sharing, the insurer’s portion of the efficiency gain is lowest. Risk sharing for high risks and proportional risk sharing have an intermediate position.
Summarizing, the empirical results strongly suggest that risk sharing for high risks as well as risk sharing for high costs yield better tradeoffs between selection and efficiency than outlier risk sharing or proportional risk sharing.
4. Conclusion and discussion
In a theoretical analysis, we showed how the optimal extent of risk sharing may depend on the weight that the regulator assigns to reducing selection versus retaining efficiency. As an illustration, we derived optimal proportional risk sharing variants. In an empirical analysis, we simulated the effects of four forms of risk sharing as a supplement to demographic capitation payments. The empirical results strongly suggested that risk sharing for high-risks as well as risk sharing for high-costs yield better tradeoffs between selection and efficiency than either outlier risk sharing or proportional risk sharing.
In this paper, we assumed that thepurpose of risk sharingwas to reduce the incentives for selection while retaining incentives for efficiency as much as possible. We did not analyze risk sharing as a tool to prevent “stinting” (Newhouse et al., 1997) or “quality skimping” (Van de Ven and Schut, 1994).33 Both “stinting” and “quality skimping” may even emerge in the case of ‘perfect’ capitation payments. Van de Ven and Schut (1994) have argued to employ a separate regulatory regime for types of care for which these problems are most relevant (e.g. long-term care for demented elderly) apart from the competitive regulatory regime for acute care. Furthermore, we did not analyze risk sharing as a tool to reduce the insurers’ financial risk related to the unpredictability of health care expenditures (Beebe, 1992). As a result of pure chance, the financial result of an insurer may vary over the years. For relatively large insurers, chance is not a problem and relatively small insurers can deal with this problem via voluntary risk-rated reinsurance techniques (Bovbjerg, 1992).
Finally, the precise form of the premium rate restrictions may influence thefeasibilityof forms of risk sharing. In this paper, we assumed that an insurer has to quote the same addi-tional premium to each member that chooses the same insurance modality (i.e. community rating). If these premium rate restrictions are replaced by requiring a certain minimum and maximum premium per insurer, executing outlier risk sharing and proportional risk sharing is still straightforward. However, executing risk sharing for high-risks or risk sharing for high-costs may pose a difficulty with premium calculations. To calculate the premium for a potential enrollee, an insurer has to know for which part of future expenditures of this applicant it is at risk. With risk sharing for high risks or high costs, this is unclear at the time the insurer has to calculate the premium.
If the premium rate restrictions are abolished, forms of risk sharing may be used as a tool to reduce access problems (Van de Ven et al., 2000). As above, executing risk sharing for high-risks or high-costs may pose difficulties with the premium calculations of an insurer. Taking into account the feasibility considerations, thepolicy relevanceof our findings is that countries that employ demographic capitation payments without risk sharing34may im-prove their payment system by introducing some form of risk sharing. Countries that employ outlier risk sharing or proportional risk sharing as a supplement to demographic capitation payments35 may improve their payment system by changing their form of risk sharing.
33Newhouse et al. (1997) use the term “stinting” for the possibility of underprovision of services. Van de Ven and
Schut (1994) define “quality skimping” as the reduction of the quality of care to a level that is below the minimum level acceptable to society.
34For example, the Czech Republic, Germany, Switzerland (Van de Ven and Ellis, 2000). Given that demographic
capitation payments in combination with community-rated additional premiums provide insurers with strong incentives for selection, it is remarkable that these countries still employ demographic capitation payments without any form of risk sharing.
Acknowledgements
The authors thank the health insurance organization Zorg & Zekerheid for providing the data set and two anonymous referees for helpful comments on an earlier draft. The opinions expressed in this paper are solely those of the authors and do not necessarily reflect those of the forenamed organization.
Appendix A
Table 7 presents the mean result in 1993 for some subgroups given an overall efficiency level of 65% in comparison with “flat capitation payments”. Roughly speaking, the results are similar to those of Table 5 in the main text where the efficiency level is 80%.
Table 8 presents the insurer’s portion of the efficiency gain given an overall selection level of 30% in comparison with “flat capitation payments”. Roughly speaking the results are similar to those of Table 6 of the main text where the selection level is 50%.
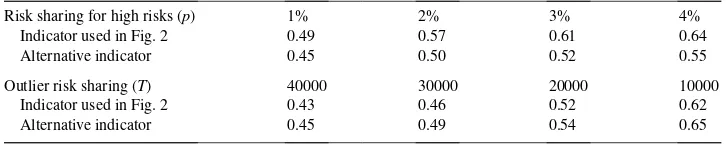
Finally, a comment on the overall indicator of an insurer’s incentives for selection that we applied in this paper. We assumed that an insurer distinguishes (non)-preferred risks by comparing its own cost predictions for its members with the cost predictions that are made by the regulator. Subsequently, we looked at the profits and losses for preferred risks and non-preferred risks, respectively. The division into (non)-preferred risks was independent of the forms and variant of risk sharing. Under proportional risk sharing as well as risk sharing for high-costs this seems reasonable. Under risk sharing for high risks as well as outlier risk sharing, this may lead to an overestimation of the reduction of an insurer’s incentives for selection. Given a certain variant of these forms of risk sharing, an insurer may redefine its (non)-preferred risks. Following this procedure yielded the results of Table 9. It suggests that we may have (slightly) overestimated the reduction of an insurer’s incentives for selection under risk sharing for high risks, but not under outlier risk sharing. Moreover, these (slightly) different results under risk sharing for high risks would not alter the conclusions as presented in this paper.
These additional results were calculated as follows:
• It is assumed that the predicted costs by the regulator for each individual are not changed by the introduction of risk sharing.
• The estimation of the selection model by the insurer is changed such that it takes into account the applied form and variant of risk sharing.
• Under risk sharing for high risks, the members that are designated for risk sharing are not included in the estimation of the model. These members are labeled non-preferred risks because it is assumed that the insurer has to pay a percentage of their normative costs to the regulator. Under outlier risk sharing, the dependent variable is truncated at the threshold value.
• It is assumed that the insurer perfectly predicts the percentage of the normative costs that it has to pay for the risk sharing and that the insurer lowers the predicted costs by the regulator for each individual by this percentage.
Table 8
Insurer’s portion of the efficiency gain given an overall selection level of 30% in comparison with flat capitation paymentsa Savings for various types of careb
Hospitals and specialistsc 0.63 0.30 0.20 0.43
Prescribed drugs 0.66 0.79 0.66 0.43
Paramedical servicesd 0.71 0.85 0.69 0.43
Savings for various subgroupse
=47,210. The overall level of incentives for selection is based on the profits for preferred risks and the losses for non-preferred risks.
bThree types of care form about 90% of the total expenditures.
cAs of 1993, the Dutch government required the sickness funds to administer a large part of the specialists care
under the hospital care. Because the distinction between these two types of care is vague, they are taken together in one type of care. Sick-transport often is transport to a hospital. Therefore, these costs are also included in the first type of care.
dParamedical services mainly consists of physical therapy (about 95%). eN
=10,553. Table 9
Reduction of an insurer’s incentives for selection under an alternative overall indicator for these incentivesa
Risk sharing for high risks (p) 1% 2% 3% 4%
Indicator used in Fig. 2 0.49 0.57 0.61 0.64
Alternative indicator 0.45 0.50 0.52 0.55
Outlier risk sharing (T) 40000 30000 20000 10000
Indicator used in Fig. 2 0.43 0.46 0.52 0.62
Alternative indicator 0.45 0.49 0.54 0.65
aN
=47,210.
the cost prediction based on its selection model is lower than the predicted costs by the regulator. For non-preferred risks, the opposite holds.
• Finally, we calculate the mean result for the (non)-preferred risks and the reduction of the incentives for selection in comparison with “flat capitation payments”.
References
Armstrong, W.L., 1997. The benefits that disease management could bring to UK health care. Journal of Managed Care 1, 4–8.
Beebe, J.C., 1992. An outlier pool for medicare HMO payments. Health Care Financing Review 10, 17–29. Bovbjerg, R.R., 1992. Reform of financing for health coverage: what can reinsurance accomplish? Inquiry 29,
158–175.
Enthoven, A.C., Singer, S.J., 1996. Managed competition and California’s health care economy. Health Affairs 15, 39–57.
Gruenberg, L., Wallack, S.S., Tompkins, C.P., 1986. Pricing strategies for capitated delivery systems. Health Care Financing Review 7 (Annual Suppl.), 35–44.
Khandker, R.K., W.G. Manning, 1992. The impact of utilization review on costs and utilization. In: Zweifel, P., French III, H.E. (Eds.), Health Economics Worldwide. Kluwer Academic Publishers, The Netherlands, pp. 47–62.
Keeler, E.B., Carter, G., Newhouse, J.P., 1998. A model of the impact of reimbursement schemes on health plan choice. Journal of Health Economics 17, 297–320.
Lamers, L.M., 1997. Medical consumption of respondents and non-respondents to a mailed health survey. European Journal of Public Health 7, 267–271.
Lamers, L.M., 1998. Risk-adjusted capitation payments: developing a diagnostic cost group classification for the Dutch situation. Health Policy 45, 15–32.
Lamers, L.M., 2000. Risk adjustment: is inpatient and outpatient diagnostic information sufficient? Submitted for publication.
Matsaganis, M., Glennester, H., 1994. The threat of cream skimming in the post-reform NHS. Journal of Health Economics 13, 31–60.
Miller, R.H., Luft, H.S., 1994. Managed care plan performance since 1980, a literature analysis. Journal of the American Medical Association 271, 1512–1519.
Newhouse, J.P., 1986. Rate adjusters for medicare under capitation. Health Care Financing Review 7 (Annual Suppl.), 45–55.
Newhouse, J.P., Beeuwkes Buntin, M., Chapman, J.D., 1997. Risk adjustment and medicare: taking a closer look. Health Affairs 16, 26–43.
Newhouse, J.P., Manning, W.G., Keeler, E.B., Schloss, E.M., 1989. Adjusting capitation rates using objective health measures and prior utilization. Health Care Financing Review 10, 41–54.
Pauly, M.V., 1984. Is cream-skimming a problem for the competitive medical market? Journal of Health Economics 3, 87–95.
Swartz, K., 1995. Reducing risk selection requires more than risk adjustments. Inquiry 32, 6–10.
Van Barneveld, E.M., van Vliet, R.C.J.A., van de Ven, W.P.M.M., 1996. Mandatory high-risk pooling: a means for reducing incentives for cream skimming. Inquiry 33, 133–143.
Van Barneveld, E.M., Lamers, L.M., van Vliet, R.C.J.A., van de Ven, W.P.M.M., 1998. Mandatory pooling as a supplement to risk-adjusted capitation payments in a competitive health insurance market. Social Science and Medicine 47, 223–232.
Van Barneveld, E.M., Lamers, L.M., van Vliet, R.C.J.A., van de Ven, W.P.M.M., 2000. Ignoring small predictable profits and losses: a new approach for measuring incentives for cream skimming. Health Care Management Science 3, 131–140.
Van de Ven, W.P.M.M., Ellis, R.P., 2000. Risk adjustment in competitive health plan markets. In: Culyer, A.J., Newhouse, J.P. (Eds.), Handbook of Health Economics. Vol. 1, Elsevier Science B.V., Amsterdam, pp. 754–845. Van de Ven, W.P.M.M., Schut, F.T., 1994. Should catastrophic risks be included in a regulated competitive health
insurance market? Social Science and Medicine 39, 1459–1472.
Van de Ven, W.P.M.M., Van Vliet, R.C.J.A., 1992. How can we prevent cream skimming in a competitive health insurance market: the great challenge for the 1990s. In: Zweifel, P., French III, H.E. (Eds.), Health Economics Worldwide. Kluwer Academic Publishers, The Netherlands, pp. 23–46.
Van de Ven, W.P.M.M., van Vliet, R.C.J.A., Schut, F.T., Van Barneveld, E.M., 2000. Access to coverage in a competitive individual health insurance market: via premium rate restrictions or via risk-adjusted subsidies? Journal of Health Economics 19, 311–339.
Van Vliet, R.C.J.A., 1992. Predictability of individual health care expenditures. Journal of Risk and Insurance 59, 443–461.