www.elsevier.nlrlocatereconbase
The willingness to pay for wait reduction: the
disutility of queues for cataract surgery in
Canada, Denmark, and Spain
David M. Bishai
a,), Hui Chu Lang
b,1 aDepartment of Population and Family Health Sciences, Johns Hopkins School of Public Health, Room W 4503, 615 N. Wolfe St., Baltimore, MD 21205, USA
b
Department of Health Policy and Management, Johns Hopkins UniÕersity School of Hygiene and
Public Health, Baltimore, MD 21205 USA
Abstract
We estimate demand curves for a one month reduction in waiting time for cataract surgery based on survey data collected in 1992 in Manitoba, Barcelona, and Denmark.
4
Patients answered, ‘‘Would you be willing to pay Bid, B to reduce your waiting time for cataract surgery to less than one month?’’ Controlling for SES and visual status, Barcelonan patients have greater WTP for shortened waiting time than the Danes and Manitobans. We
Ž .
estimate the value in 1992 $ of lost consumer surplus due to the cataract surgery queue at $128 per patient in Manitoba, $160 in Denmark, and $243 in Barcelona.q2000 Elsevier
Science B.V. All rights reserved.
JEL classification: I11; C42
Keywords: Willingness to pay; Contingent valuation; Queues; Cataracts; Spain; Canada; Denmark
1. Introduction
Intercountry comparisons of health care costs may be distorted by their neglect
Ž .
of non-budgetary ‘‘hidden costs’’ of a health care system Danzon, 1992 . Many
)
Corresponding author. Tel.:q1-410-955-7807; fax:q1-410-955-0792; E-mail: [email protected] 1
Current address: National Yang Ming University, Taipei, Taiwan. E-mail: [email protected]. 0167-6296r00r$ - see front matterq2000 Elsevier Science B.V. All rights reserved.
Ž .
health care systems impose longer waiting times on patients rather than incur budgetary spending to build the required capacity to eliminate queues and other forms of rationing. Thus, a country can successfully appear to have low budgetary health costs by imposing unmeasured waiting time costs on its population. Some commentators have been of the opinion that cultural factors determine the political economy that balances publicly funded costs of health care against privately borne
Ž .
waiting time costs Kissick, 1994 . Thus, when we observe relatively longer waiting times it could be because the patients in such a population are endowed with an enhanced ability to bear such costs patiently. In this paper we use information on patients’ stated willingness to pay to shorten time on the queue for cataract surgery in Spain, Canada and Denmark to explore the hypothesis that health systems can impose longer waiting times on populations where the disutility of waiting is less.
Existing literature on the value of time on the queue has focused on the productivity costs of disabled persons spending time on the queue for medical
Ž .
services. Globerman and Hoye 1990 estimated the ‘‘income loss’’ associated with queues in British Columbia by multiplying the estimated total weeks waiting by the percentage of patients in each specialty who were ‘‘experiencing difficulty in carrying on their work or daily duties as a result of their medical condition’’ ŽGloberman and Hoye, 1990 . This product is then multiplied by the average. weekly industrial earnings for 1989. They estimate the value of time on the queue
Ž .
at $132 million, or 0.2% of provincial gross domestic product GDP for that year. They argue that Canada’s methods of rationing results in hidden costs that could be at least as great as the more visible costs of billing, utilisation review, and other activities of U.S. private insurers.
Most of the waiting time research focuses on exploring the current situation of Ž
queue, or the way to manage waiting problem of elective surgeries Smith, 1994; .
Naylor et al., 1995; Elwyn et al., 1996 . Prior contingent valuation studies of
Ž .
shortened queue time Propper, 1990, 1995; Johannesson et al., 1998 have not attempted intercountry comparisons.
2. Methods
2.1. Theory
Ž .
Following Johannesson et al. 1998 we model the disutility of time on the queue for cataract surgery by considering utility functions such as:
UsU Z, H
Ž
.
Ž .
1surgery this is indeed relatively negligible. Subjects by default would spend a period oft months on the queue suffering from visual impairment measured with functional status index h. The presence of a contingent market for shortened queue time offers to sell these subjects ‘‘t’’ months of shortened queue time.
H or visual health is given as follows:
t
tyt ybt ybt
Hs
H
hLO We d tqH
h eHI d tŽ .
20 tyt
where hLO W is the instantaneous felicity of having impaired visual function, hHI is the instantaneous felicity of having restored visual function, t is the ex ante expectation of months on the queue in the absence of a market for shortened queue time, t is the decrement in the number of months on the queue that a subject
w x
would purchase if given the opportunity t2 0,t , b is the instantaneous discount rate reflecting time preference.
Ž .
A month on the queue is in a sense a quality adjusted life month QALM . One
Ž 2 2 .
could impose diminishing marginal utility of health d Urd H -0 and show diminishing marginal utility of decrements to waiting time. However, a planner maximizing population health is often thought to regard all QALMs equal. Reducing wait from 9 months to 5 months produces the same number of QALMs as does reducing wait from 5 months to 1 month. Adhering to the planner’s perspective, in applying this model we will assume that marginal utility of a unit waiting time reduction is invariant with respect to the total amount of waiting time experienced or anticipated.
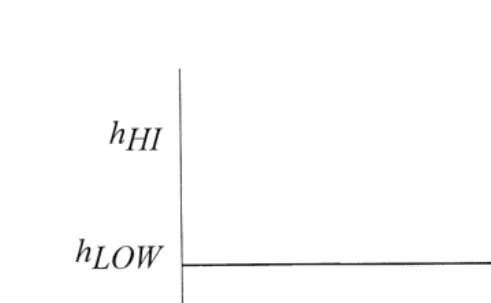
Our model of the visual health state while on the queue is depicted in Fig. 1.
Ž .
The budget constraint setting Z to be the numeraire is given by:
YstPtqZ
Ž .
3where P is the price of reduced queue time per month of reduction.t
The solution to this problem is characterized by the following Euler equation:
dU
Eq. 4 states that the marginal utility per dollar spent on Z equals the marginal utility of gain in visual health per dollar spent on shortened queue time. These health improvements are of greater importance to populations with a heightened
Ž . Ž
appreciation of visual health dUrd H40 , with more severe cataracts, hHIy
. Ž .
hLO W 40, with more immediate time preference b™0 , or who face a queue
time that is not so long that the future benefit of shortening it becomes deeply
Ž .
discounted t small . The multidimensional properties of health as well as other determinants of dUrd H such as income and health status are considered
exten-Ž .
Fig. 1. Visual health state vs. time on the queue for cataract surgery. In the absence of a market for shortened queue time, subjects waitt months for surgery. In a contingent market they are offered an arena in which to purchase t months of shortened queue time for bid B. If they accept bid B their time to surgery will betyt.
possibility that income and current visual status might affect willingness to pay to reduce waiting time through effects on the marginal utility of health. This model suggests that controlling for income and health status, countries with a high willingness to pay for shortened queue time may have a lowerb andror a higher dUrd H.
2.2. Study design
Data were collected in an international multicenter study involving Canada, Denmark and Spain by the Johns Hopkins International Cataract Outcome study
Ž .
Team from 1991 to 1995 Dunn et al., 1997 .
Patients who were enlisted for first-eye cataract surgery were eligible for enrolment if they were older than 50 years, and were recruited consecutively from the practices of participating ophthalmologists in each center. Patients were excluded from the study if they had previously undergone cataract surgery or if the cataract surgery was planned in conjunction with glaucoma, corneal or vitreoreti-nal surgery. Further exclusions were made if patients were not permanent residents in the recruitment area, did not speak the language of the country, were deaf or, confused, or did not have access to a telephone. The interviews were conducted via telephone at the time of entry onto the queue.
The Canadian study was conducted in the Province of Manitoba. Twelve of the Ž .
18 67% ophthalmologists performing surgery in the province of Manitoba agreed to participate this study. A total of 226 eligible patients were referred from the
Ž .
In Denmark, 85% of cataract surgeries are performed in the public hospitals. All 17 ophthalmology departments in Danish public hospitals agreed to participate
Ž .
in this study. A total of 350 Danish patients 72.5% of the eligible patients completed the initial interview.
In the City of Barcelona, approximately 60% of cataract surgeries are per-formed in the public sector and 40% in the private sector. For the public sector, four out of 10 ophthalmology departments were randomly selected based on a stratification on volume of cataract surgery and average case severity. To include private sector patients, 12 ophthalmologists were randomly selected and seven of these agreed to participate. A total of 219 patients were referred for enrollment and
Ž .
200 91% completed the initial patient interview. Further details of data collection
Ž .
are described by Dunn et al., 1997 .
2.3. MonetaryÕalue of willingness to pay
Ž .
We used the ‘‘take-it-or-leave-it’’ approach Bishop and Heberlein, 1979 to assess willingness to pay. The survey asked patients, ‘‘If you had the opportunity to pay out of pocket to reduce waiting time for cataract surgery, would you be
4
willing to pay ‘‘Bid B’’ to reduce your waiting time to less than one month’’.
Ž .
There were only three possible stated bids $500, $1000, $2000 in local currency . Each subject was randomly assigned to encounter only one of the three bids. This limitation is addressed below.
The commodity under consideration is ‘‘number of months of avoided waiting time’’. Because the quantity of months purchased for the ‘‘Bid’’ varied with each subject’s ex ante subjectively perceived waiting time, it is possible to use the wide variation in subjective perception to overcome the limit in the actual number of different stated bids. For example, suppose 50 subjects encountered the stated bid ‘‘$1000’’. If five of the subjects thought they would wait 10 months, they would be expressing their willingness to pay $100 per month of avoided waiting time. If another five subjects thought they would wait 20 months, they would be express-ing their willexpress-ingness to pay $50 per month of avoided waitexpress-ing time. In this fashion subjective perceptions of the amount of commodity being purchased increase the variation in the number of encountered bid prices.
Half of subjects were randomly selected to confront the $1000 stated bid with the remainder split evenly between $500 and $2000. The response could be either yes, or no. There were no follow-up bids tendered. With the appropriate interpreta-tion this approach has been shown to produce an estimate of mean willingness to
Ž .
pay Cameron, 1988; Langford, 1994 .
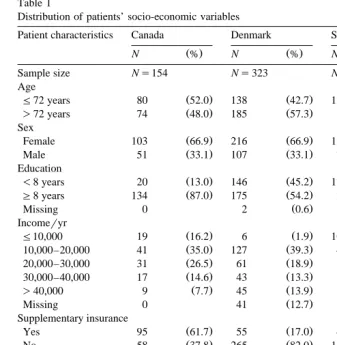
Variation in perceived ex ante waiting time is shown in Table 1. We computed for each subject the subjective unit price of reduced waiting time.
U Ž .
Table 1
Distribution of patients’ socio-economic variables
2
Patient characteristics Canada Denmark Spain x
Ž . Ž . Ž .
N % N % N % P
Sample size Ns154 Ns323 Ns204
Age
Ž . Ž . Ž .
F72 years 80 52.0 138 42.7 120 58.8 0.001
Ž . Ž . Ž .
)72 years 74 48.0 185 57.3 84 41.2
Sex
Ž . Ž . Ž .
Female 103 66.9 216 66.9 125 61.3 0.372
Ž . Ž . Ž .
Male 51 33.1 107 33.1 79 38.7
Education
Ž . Ž . Ž .
-8 years 20 13.0 146 45.2 173 84.8 0.001
Ž . Ž . Ž .
G8 years 134 87.0 175 54.2 28 13.7
Ž . Ž .
Missing 0 2 0.6 3 1.5
Incomeryr
Ž . Ž . Ž .
F10,000 19 16.2 6 1.9 106 52.0 0.001
Ž . Ž . Ž .
10,000–20,000 41 35.0 127 39.3 48 23.5
Ž . Ž . Ž .
20,000–30,000 31 26.5 61 18.9 7 3.4
Ž . Ž . Ž .
30,000–40,000 17 14.6 43 13.3 5 2.5
Ž . Ž . Ž .
)40,000 9 7.7 45 13.9 1 0.5
Ž . Ž .
Missing 0 41 12.7 37 18.1
Supplementary insurance
months on the queue could be avoided for bid B . Although the survey containedj
Ž .
only three possible stated bids, the subjects offered responses to J 43 different unit prices for reduced waiting time.
Our theory suggests that due to discounting, large differences in perceived waiting time ought to affect the WTP to shorten it. Unfortunately, PU
might be the same for subjects with large differences in perceived waiting time. To correct
Ž
for this, we group subjects into three tertiles based on perceived wait long wait,
. U
waiting times vary by as much as 3 months, but small sample size prohibits finer distinctions.
2.4. Data analysis
The following logistic regression was run:
Ajslogit age, income, education, supplemental insurance, VF-14, P
Ž
jU.
Where A is acceptance of bidj s1 if j gave a ‘‘yes’’ answer to the bid, s0 if
U
Ž . Ž .
‘‘no’’. Pj s bid confronted by j % perceived ex ante wait time of j . VF-14 is an index of visual functional status. From the logistic regression, we can calculate every individual’s predicted probability, p of accepting the offer. To calculate the
ˆ
j mean value of willingness to pay we sum the weighted average of tendered bids using as weights each bid’s predicted probability of acceptance, e.g., MeanŽ . Ž . Ž U.
WTPs 1r N Ý p
ˆ
j=Bj . Bootstrapped standard errors were computed for mean WTP based on no less than 175 replications for each sample.We segmented the samples in each country at the 33rd and 67th percentiles by ex ante perceived waiting time to form a total of nine groups. Mean actual waits
Ž . Ž .
for these groups and group size in Canada was 2 months Ns59 , 5 months ŽNs43 and 11 months N. Ž s44 , in Denmark: 3 months N. Ž s168 , 6 months. ŽNs79 and 9 months. ŽNs86 and in Spain 1 month. ŽNs104 , 3 months. ŽNs38 and 6 months N. Ž s40 . Many Spanish patients foresaw very short waits.. Subjects in any country who already thought that they would wait less than one month were not asked what they would pay to shorten their wait. Thus, only 18% of the short wait group in Spain could meaningfully respond to the WTP question, ‘‘How much would you pay to shorten your wait to less than 1 month?’’ Among the other eight groups the response rate averaged 87% with a low of 68%.
3. Results
3.1. Characteristics of study sample
median age of 72 years and 70% for subjects under the median age. Using bivariate logistic regression to assess the appropriateness of the WTP responses,
Ž .
we found significant p-0.05 increases in bid acceptance with poorer visual function, higher education and lower bids. Higher perceived waiting time in-creased the odds of bid acceptance, but not significantly.
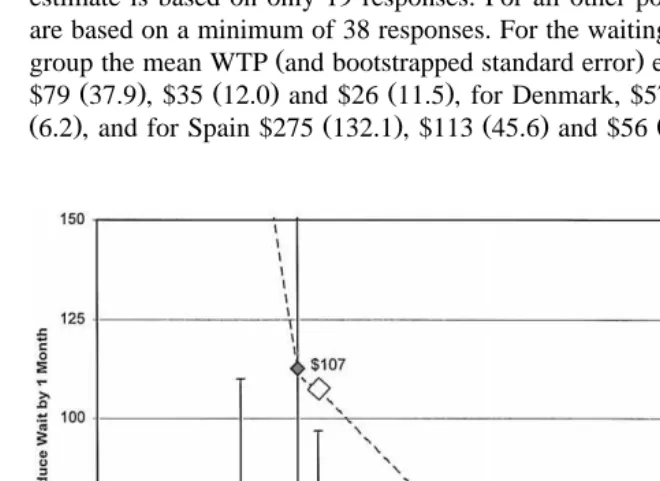
3.2. Demand curÕes
Fig. 2 plots the demand curves for each of the three countries. Spanish patients appear to have a higher demand for shortened waiting time. Filled in markers denote the WTP estimates for each country. The estimate of willingness to pay of $275 for the shortest wait tertile in Spain is somewhat imprecise because this estimate is based on only 19 responses. For all other points shown, the estimates are based on a minimum of 38 responses. For the waiting times of each respective
Ž .
group the mean WTP and bootstrapped standard error estimates for Canada were
Ž . Ž . Ž . Ž . Ž .
$79 37.9 , $35 12.0 and $26 11.5 , for Denmark, $57 32 , $27 9.3 and $15 Ž6.2 , and for Spain $275 132.1 , $113 45.6 and $56 16.0 .. Ž . Ž . Ž .
The open markers in Fig. 2 are labelled with dollar values which denote our imputation of mean willingness to pay at the average actual waiting time for cataract surgery for each country: Canada 5.4 months; Denmark 6.6 months; Spain 3.3 months.
3.3. Lost consumer surplus
With the partial exception of Spain, none of these countries has effective markets in which patients can easily purchase reduced waiting time for surgery. The atrophy of such markets represents a loss that the consumer bears privately. If we assume away the substantial transactions costs that would impede the forma-tion of an internaforma-tional market for reduced waiting time, then in theory this commodity could be produced according to a perfectly elastic supply curve. Under this assumption, we can estimate the magnitude of the loss incurred by being unable to purchase a waiting time of one month as the roughly triangular area similar to the shaded area for Denmark labelled ‘‘consumer surplus’’ in Fig. 2. A fair international comparison of budgetary health care costs could then be modi-fied to include the non-budgetary costs induced by the queue.
For Barcelona, the average lost consumer surplus per patient was $243, for Denmark $160, for Manitoba $128 per cataract patient. Barcelona is hardly representative of all Spain, and Manitoba can hardly represent Canada. However, these estimates could suggest the order of magnitude for the respective popula-tions’ willingness to wait one additional month for cataract surgery. Although there are no published data on the incidence of cataract surgery in these countries, we can apply US-based estimates of the incidence of bilateral cataract surgery in
Ž .
Caucasians West et al., 1998 to the age profiles for Spain, Denmark and Canada ŽUnited Nations, 1997 to suggest an annual caseload of 62,000, 9000 and 39,000. cataract surgeries in these three countries, respectively. If one assumes that the US patients are treated more intensively, these estimates are biased upward. If one assumes that unilateral cataract surgery is more common than bilateral, these estimates are biased downward. Despite their limitations, these caseload estimates suggest that the absence of markets for speedier cataract surgeries imposes a net loss of consumer welfare worth $15 million in Spain, $1.4 million in Denmark, and $4.9 million in Canada. These amounts can also be expressed as a percentage
Ž .
of total health spending World Bank, 1993 to yield 0.05%, 0.0177% and 0.01%, respectively. The costs of cataract surgery and ancillary services can vary across
Ž .
countries from $23 in India Murthy and Sharma, 1994 to $2500 in the US ŽSteinberg et al., 1993 . With a conservative estimate of cataract costs at roughly. $1000 per patient, the hidden cost of waiting could represent between 10–25% of the budgetary cost of cataract care per patient.
expands capacity the deadweight costs of the additional public revenue generation would increase the marginal cost to society. Furthermore, if capacity is expanded by permitting more private provision of services, societal costs would be incurred in the form of negative externalities borne by citizens who value the equity of universal social financing of health care. Another unintended consequence of shortened queue times could be an upward shift in demand. Martin and Smith Ž1999 present evidence from the UK suggesting that reduced waiting times do not. greatly stimulate utilization.
4. Discussion
Our estimate that the hidden costs of cataract surgery waiting time represent 10–25% of cataract surgery costs can be compared to prior estimates of Cullis and
Ž .
Jones 1986 that the aggregate cost of waiting time for therapy in the UK was equivalent to 9.1–16.2% of NHS expenditure. Our estimate that an average
Ž .
cataract patient would be willing to pay between $24 and $107 1992 $ for a reduction in waiting time of one month can be compared to the estimates by
Ž .
Propper 1995 . She found that net of the value of uncertainty the average Ž estimated value of one month of waiting list time was £50.1 in 1991 prices $97 in
.
1991 $ for subjects in the UK awaiting alleviation of a hypothetical condition of
Ž .
reduced functional status and pain. Johannesson et al. 1998 asked Norwegian subjects their WTP for private insurance plans that differed in the waiting time for
Ž .
elective surgery and estimated a WTP of $185–$214 1991 $ to reduce waiting time by one month.
Willingness to pay surveys are subject to a number of limitations such as framing bias, starting point bias, and sample design that have been extensively
Ž
reviewed Brookshire and Crocker, 1981; Mitchell and Carson, 1989; Stalhammar,
˚
.1996 . We have presented evidence that subjects who perceived longer waits also had grounds for more uncertainty in their estimates of queue time. Unfortunately, our survey did not separate WTP for decreased queue time from WTP for decreased uncertainty over queue time. Another specific limitation of this study is that a majority of patients from Denmark and Canada were recruited from the public health care system. Patients in these sites who bypassed the public system in order to have cataract surgery performed with reduced waiting times at private clinics were not available for the study.
Subject to these limitations, our findings support the hypothesis that waiting times would be shortest in the country with the greatest demand for shorter waiting times. The WTP for shorter waiting times based on ex ante perceptions of waiting time was highest in Spain and the actual waiting time for surgery was shortest in Spain. In Barcelona, Spain approximately 30% of citizens have private insurance. It is estimated that 40% of cataract surgeries in Barcelona are
per-Ž .
Ž .
more funding to the public sector. Anderson et al. 1997 showed that Danes were the most willing to pay higher taxes among these three countries to reduce the waiting time and were also the least willing to allow individuals to pay physicians directly in order to jump the queue. It is estimated that only 15% of the cataract
Ž
surgeries in Denmark are performed privately Sigmund and Danneskiold-Samsoe, .
1992 .
Our findings might offer an approach to obtaining a dollar measure of the actual disutility of one month spent in a health state of cataracts. In future research we hope to offer a suitable framework with which to use the WTP data to convert
Ž .
visual functional status measures VF-14 while on the queue into dollars of disutility from cataracts. For now, on aggregate, it would appear that a mean VF-14 score 70.9 for 1 month corresponds to a dollar loss of between $24 and $107.
Our findings also suggest that international comparisons of vital statistics relative to ‘‘on budget’’ health care spending may be misleading because low budgetary figures and vital rates will not necessarily reflect substantial utility losses borne by patients on the queue. If health systems are to be compared in terms of utility per dollar spent, analysts must begin to refine measures of the disutility of time on the queue. We believe that our estimates are a promising step in this direction.
Acknowledgements
Ž .
Financial support from the Hopkins Population Center 5P30 HD06268-25 is gratefully acknowledged. We would like to thank Gerry Anderson for making the data available and to thank Don Steinwachs, Patricia Danzon and Kevin Frick for their helpful comments.
References
Anderson, G., Black, C., Dunn, E., Alonso, J., Christian-Norregard, J., Folmer-Anderson, T., Bernth-Peterson, P., 1997. Willingness to pay to shorten waiting time for cataract surgery. Health Affairs
Ž .
16 5 , 181–190.
Bishop, R., Heberlein, T., 1979. Measuring values of extra market goods: are indirect measures biased? American Journal of Agricultural Economics 61, 926–930.
w Borrell, C., Pasarin, I., Plansencia, A., 1995. Enquesta de salut de Barcelona 1992–1993 Health
x
Interview of Barcelona . Barcelona: Estadisstiques de Salut No. 23, Ajuntament de Barcelona. Brookshire, D.-S., Crocker, T.-D., 1981. The advantages of contingent valuation methods for benefit–
Ž .
cost analysis. Public Choice 36 2 , 235–252.
Cameron, T., 1988. A new paradigm for valuing non-market goods using referendum data: maximum likelihood estimation by censored logistic regression. Journal of Environmental Economics and Management 15, 355–379.
Cullis, J., Jones, P., 1986. Rationing by waiting lists: an implication. American Economic Review 76
Danzon, P., 1992. Hidden overhead costs: is Canada’s system really less expensive? Health Affairs 12
Ž .2 , 21–43.
Dunn, E., Black, C., Alonso, J., 1997. Patients’ acceptance of waiting for cataract surgery: what makes a wait so long? Soc. Sci. Med. 44, 1603–1610.
Elwyn, G., Williams, L., Barry, S., Kinnersley, P., 1996. Waiting list management in general practice: a review of orthopaedic patients. BMJ 312, 887–888.
Globerman, S., Hoye, L., 1990. Waiting Your Turn: Hospital Waiting Lists in Canada. The Fraser Institute, Vancouver.
Grossman, M., 1972. The Demand for Health: a Theoretical and Empirical Investigation. Columbia Univ. Press, New York.
Johannesson, M., Johansson, P.-O., Soderqvist, T., 1998. Time spent on waiting lists for medical care:¨
an insurance approach. Journal of Health Economics 17, 627–644.
Kissick, W., 1994. Medicine’s Dilemmas: Infinite Needs Versus Finite Resources. Yale Univ. Press, New Haven, CT.
Langford, I., 1994. Using a generalized linear mixed model to analyse dichotomous choice contingent valuation data. Land Economics 70, 507–514.
Martin, S., Smith, P.C., 1999. Rationing by waiting lists: an empirical investigation. Journal of Public Economics 71, 141–164.
Mitchell, R., Carson, R., 1989. Using Surveys to Value Public Goods: the Contingent Valuation Method. Resources for the Future, Washington, DC.
Murthy, G.V., Sharma, P., 1994. Cost analysis of eye camps and camp-based cataract surgery. National
Ž .
Medical Journal of India 7 3 , 111–114.
Naylor, C., Sykora, K., Jaglal, S., Jefferson, S., 1995. Waiting for coronary artery bypass surgery: population-based study of 8517 consecutive patients in Ontario, Canada. Lancet 346, 1605–1609. Propper, C., 1990. Contingent valuation of time spent on NHS waiting lists. Economic Journal 100,
193.
Propper, C., 1995. The disutility of time spent on the United Kingdom’s National Health Service
Ž .
waiting lists. Journal of Human Resources 30 4 , 677–700.
Sigmund, H., Danneskiold-Samsoe, B., 1992. Operation af gra staer sygtome pa sygehus og c praksis. DSL Report 92.01, Copenhagen, Denmark.
Smith, T., 1994. Waiting times: monitoring the total post referral wait. BMJ 309, 593–596.
Stalhammar, N.-O., 1996. An empirical note on willingness to pay and starting-point bias. Medical˚ Ž .
Decision Making 16 3 , 242–247.
Steinberg, E.P., Javitt, J.C., Sharkey, P.D., Zuckerman, A., Legro, M.W., Anderson, G.F., Bass, E.B.,
Ž .
O’Day, D., 1993. The content and cost of cataract surgery. Archives of Ophthalmology 111 8 , 1041–1049.
United Nations, 1997. Demographic Yearbook 1995. United Nations, New York.
West, S.K., Munoz, B., Schein, O.D., Duncan, D., Rubin, G.S., 1998. Racial differences in lens˜
opacities: the SEE Project. American Journal of Epidemiology 148, 1033–1039.