An Active Learning-Based Integrated Project between
High Schools and the University: Analysis of Bioethanol
Fuel and Its Blends with Synthetic Gasoline
Luzia P. Novaki, Ana M. Chinelatto, Omar A. El Seoud*
Institute of Chemistry, the University of São Paulo, São Paulo, Brazil
Abstract
In order to increase the interest of high-school students in chemistry, and initiate their contact with the Institute of Chemistry of the University of São Paulo (Chem-USP), we introduced a project of socio-economic relevance, analysis of bioethanol fuel (hereafter called “ethanol”) and its blends with synthetic gasoline. We used concepts that these students are familiar with, and techniques that can be employed in high schools. Due to historical reasons, Brazilian students are familiar with the use of ethanol as fuel, either hydrous, or as a blend with gasoline in “flex-fuel” cars and motorcycles. They may lack, however, knowledge about industrial production of ethanol and possible adulteration of fuels. We carried out this project in three stages; I and III at the schools and II at Chem-USP. In stage I, the students conducted a literature survey, answered a quiz that their teachers corrected and discussed in class, and then prepared ethanol-water mixtures. In stage II, they came to Chem-USP to determine the densities and refractive indices of their aqueous ethanol mixtures, and the refractive indices of ethanol-synthetic gasoline mixtures using digital density meter and refractometer. They recorded the Uv-Vis spectra of the natural dye β-carotene dissolved in ethanol-water mixtures. All students constructed calibration curves (physical property versus mixture composition) and determined the composition of commercial unknowns (household cleaning ethanol and hydrous ethanol fuel). In stage III, the students discussed with their teachers the results of their experiments, and the concepts involved (e.g., hydrogen-bonding) and then answered an evaluation sheet of the project. They liked the active learning approach; their working in groups with modern equipment. The experimental part of this project can be carried out using less sophisticated infrastructure, namely, volumetric glassware, analytical balance, Abbe refractometer, and a low-cost spectrophotometer.Keywords
Active learning, Constructivist teaching, Bioethanol analysis, Gasoline, Density, Refractive index, Uv-Vis spectroscopy, β-carotene1. Introduction
The use of “gasohol” as fuel for cars is probably the best-known example of the large-scale use of renewable fuels. This product is sold in sixteen countries and ten states in the USA [1]. It is a blend of gasoline and bioethanol (hereafter designated as “ethanol”); the latter component is obtained by fermentation, e.g., of sugar-cane juice [2]. In addition to being from renewable sources, ethanol is an oxygenated fuel and has a higher octane number than those of hydrocarbons. For example, the RONs (Research Octane Numbers) are 108.6 and 88 to 100, for ethanol and commercial grades of gasoline, respectively [3].
Brazil has a long history of using ethanol as fuel for internal combustion engines. Since 1931 the gasohol sold
* Corresponding author:
[email protected] (Omar A. El Seoud) Published online at http://journal.sapub.org/jlce
Copyright © 2015 Scientific & Academic Publishing. All Rights Reserved
locally contains 25±1 v% of anhydrous ethanol. Mass-produced passenger cars that run on hydrous ethanol (92.5 to 93.8 wt%, or 95.1 to 96.0 v% ethanol) have been on the market for the last 36 years [4-6]. Since 2003, the cars sold in Brazil run on “flex-fuel”, i.e., gasohol, hydrous ethanol, or any mixture of both fuels. Motorcycles running on the same flex-fuel were introduced commercially in 2009 [7].
Fuel analysis is important for economic reasons because the price/liter of hydrous ethanol (charged in Brazil) is maintained at ca. 70% of the price of gasohol, due to the lower calorific value of the former fuel [6, 8]. Due to the miscibility of gasoline and hydrous ethanol, one principle gasohol adulteration practice is to add more ethanol (beyond the 25 v% legal limit). Additionally, hydrous ethanol can be easily falsified by adding water (see, however, Figure 2 and the corresponding discussion).
(Chem-USP), all of them based on absorption of synthetic [9] or natural dyes, namely β-carotene or chlorophyll [10]. We present here a project for analysis of ethanol-water mixtures (hereafter called “E-W”), and ethanol-synthetic gasoline mixtures (hereafter called “E-G”). Our aim is to increase the interest of high school students in chemistry and initiate their contact with Chem-USP. Using the active-learning approach, we carried out this project in collaboration with high school teachers in three stages. First, the teachers asked the students to do literature survey on the subject; they answered a quiz, and then they prepared E-W. In the second stage, they visited our laboratory at Chem-USP, where they determined the densities and refractive indices of E-W, the refractive indices of E-G (that we prepared); and recorded the absorbance of
β-carotene solubilized in E-W. They constructed the appropriate calibration curves from which they determined the compositions of commercial household cleaning ethanol; hydrous ethanol fuel samples, and E-G unknowns that we provided. In the third stage, they discussed their results in class, and evaluated the project. Their positive answers indicated that they liked the active-learning approach; working in groups, and appreciated learning new techniques and concepts. The experiment is safe, generates little, easily disposable residue, and can be done in a typical high-school laboratory.
2. Experimental Part
2.1. Solvents, Reagents, and Commercial Ethanol Samples
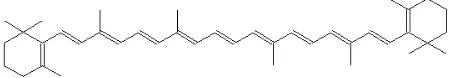
We purchased the solvents and reagents from Fluka and Synth (São Paulo). We treated commercial anhydrous ethanol (ca. 99.6%) with sodium (6 g/L ethanol), distilled and then stored the alcohol over activated 3Å molecular sieves. Xylenes (isomer mixture, 98.5%), 1-heptane (99%), decalines (cis and trans isomers, 99%), and β-carotene were used as received. Figure 1 shows the molecular structure of
β-carotene.
Figure 1. The molecular structure of the green dye β-carotene
We purchased commercial samples of household cleaning ethanol and hydrous ethanol fuel (three of each) in local supermarkets, and gas stations, respectively. We purified water with reverse osmosis (OS10LXE, Gehaka).
Note: All binary mixtures were prepared, and all measurements were carried out at 25°C, after thermal equilibration of the sample.
2.2. Preparation of Synthetic Gasoline; Ethanol-Gasoline, and Ethanol-Water Mixtures
Precision burettes with PTFE stopcocks, and 25 mL
volumetric flasks with polypropylene stoppers (e.g., Schott Duran GLS114.202.05A, and GLS130.202.03, respectively) were used throughout. We prepared synthetic gasoline by volume, by mixing the following hydrocarbons: xylenes (50 v%), n-heptane (45 v%) and decalines (5 v%). In principle, the ethanol-containing mixtures employed in the present project are not ideal, vide infra; mixing of components is not thermo-neutral [11]. Therefore, we (at Chem-USP) and the students in their schools proceeded as follows:
(i) E-G: We carried out this preparation by pipetting the required volumes of anhydrous ethanol in 25 mL volumetric flasks. Next, we added enough gasoline so that the total volume is ca. 0.5 mL below the mark of the flask. The latter was thermostated in a water-bath at 25°C for 10 min before completing the volume with gasoline. The mixtures employed for construction of the calibration curves contained 10 to 90 v% ethanol. (ii) E-W: Under supervision in their respective schools,
the students prepared ethanol-water mixtures by using the anhydrous ethanol that we supplied. The procedure is similar to that employed in (i), except that they first pipetted ethanol, and then diluted with water. The mixtures employed for construction of the calibration curves contained 10 to 98 v% ethanol.
2.3. Equipment
The students used the following equipment at Chem-USP: DMA 4500M digital, resonating density meter (Anton-Paar; d ± 0.00001 g. cm-3), equipped with a closed reservoir for collecting the spent sample after measurement, and a diaphragm pump for drying the measuring U-shaped quartz tube. The students determined the refractive index (n) with J357 digital refractometer, operating at 488 nm (Rudolph Research; n ± 0.00001). Both equipment are provided with Peltier thermoelectric heat pumps for temperature control, within 0.01°C. The students recorded the Uv-Vis spectra with UV-2500 double-beam spectrophotometer (Shimadzu) equipped with a cuvette holder whose temperature is controlled within 0.05°C by water circulation.
Additionally, we used the following equipment: manual, precision Abbe 60 refractometer (Bellingham & Stanley;
λ = 589nm; n ± 0.0005) whose temperature is maintained with water circulation; Laborette 17 ultrasonic bath (Fritsch; 140 W, 35 KHz), and MicroMax MP4R centrifuge (IEC).
2.4. Methods
Note: We explained the equipment and carried out demonstration measurements before allowing the students to measure their samples, under our supervision.
2.4.1. Density
0.00001 g. cm-3).
2.4.2. Refractive Index
The students cleaned the small, circular measuring surface (1 cm diameter) with a soft tissue paper. They added two drops of the solution (E-W or E-G), closed the measuring cell cover, and then recorded the digital display (refractive index) when the average of three consecutive readings was within ± 0.00001 unit.
2.4.3. Uv-Vis Spectra of β-Carotene Solubilized in Ethanol-Water Mixtures
This experiment is time consuming because it involves weighing of β-carotene; its dissolution (by sonication) in the different aqueous ethanol mixtures, and separation of the undissolved natural dye (by centrifugation). Therefore, we used the E-W mixtures prepared by the students (and sent to us in advance) to prepare the β-carotene solutions, whose spectra were recorded in the Uv-Vis region. The procedure was as follows: In 2 mL volumetric tubes with polypropylene stoppers (e.g., Pyrex 5642) we weighted ca. 3 mg β-carotene/tube, and then added 2 mL of the E-W (40 to 98 v% ethanol). We sonicated the dye suspension for 30 minutes, and then centrifuged the tubes at 400 G for 30 minutes.
The students received the tubes after centrifugation and then carefully transferred the supernatants into 0.2 cm path-length glass cuvettes with PTFE covers (e.g., G102; Azzota), placed the cuvettes into the thermostated cell compartment of the spectrophotometer, and then recorded the spectra from 350 to 550 nm. The students used the dye absorbance at 450 nm for constructing the calibration curve, vide infra.
3. Results and Discussion
3.1. Scheme of Activities
Seventy-five students in their last year of high school, from three schools, participated in this project; its stages included:
(a) Literature survey about the production and commercial uses of ethanol, and the physical properties of E-W;
(b) Preparation (in high schools) of E-W with 10 to 98 v% ethanol;
(c) Measuring (at Chem-USP) of the following properties as a function of mixture composition: densities and refractive indices of E-W; refractive indices of E-G; absorbance of β-carotene solubilized in E-W.
The students worked in groups of eight or nine each; there were three groups from each high school.
3.1.1. Literature Survey and Answering the Quiz about Ethanol
Before visiting Chem-USP, the participating students
searched the internet for the industrial production of ethanol; formation of ethanol-water azeotrope; commercial methods to remove water from hydrous ethanol, and methods to determine the water content in hydrous ethanol. The teachers assessed the results of their search by distributing a quiz that we supplied. The students answered the latter in class; later their teachers commented on their answers.
We asked them about the advantages, if any, of using gasohol as fuel instead of gasoline. Most students (68%) cited the concomitant increases of the mixture octane number; 31% and 33% cited reduction of air pollution, and the fact that ethanol is a renewable fuel, respectively. Their answers point into the right direction as discussed in Introduction about the octane number. Additionally, sugar cane is a fast-growing crop; it is harvested every 12 or 18 months [12].
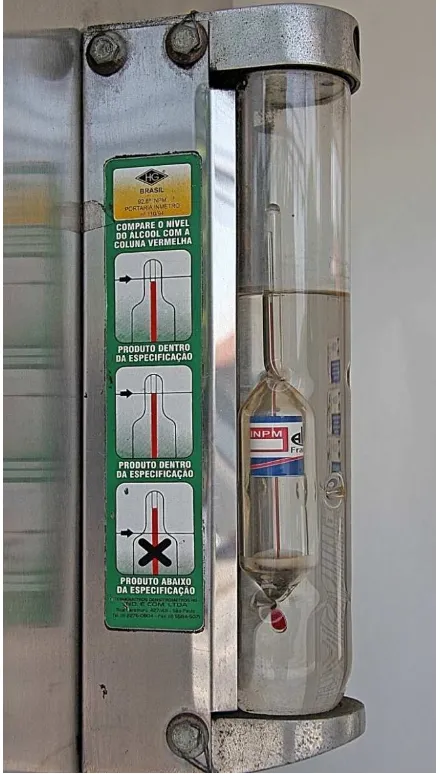
Figure 2. View of a typical alcoholmeter attached to an ethanol pump. The Sticker that calls the consumer´s attention to the purity of the fuel is visible. Adulteration by adding water increases the density pushing the alcoholmeter “up” as shown with the lower alternative of the sticker, marked with (X)
(47%), or activated molecular sieves (37%), or add a third component and remove the water present as a 3-component azeotrope (16%). Although the use of CaO seems advantageous because of its low cost (ca. 4 cents to dehydrate one liter of ethanol), one should consider the additional energy cost of regenerating CaO from the corresponding Ca(OH)2 by calcination, and the safety aspect of heating large amounts of an ethanol-containing Ca(OH)2
“cake”. Hydrous ethanol forms ternary isotropic mixtures with relatively benign hydrocarbons, e.g., n-hexane and n-heptane [13], this is the basis of the so called “extractive distillation” method [14]. Therefore, the latter, along with treatment with activated molecular sieves, e.g., 3Å, are appropriate for industrial removal of water from hydrous ethanol. Finally, density was the method of choice for the determination of the water content of W-E (53%). The recognition of density as an appropriate property is certainly linked to the fact that (in Brazil) each pump that sells hydrous alcohol is provided with an alcoholmeter and a visible sticker, as shown in Figure 2. Therefore, the consumer is assured of the quality while the fuel flows into the car/motorcycle tank. The Gay-Lussac alcoholmeter is provided with an inner tube containing a bright-red liquid. The sticker fixed on its side shows three possibilities, based on ethanol content, i.e., on E-W density. The ethanol fuel is appropriate if the level of the red liquid is below, or at the surface of flow of hydrous ethanol, but not above it. The reason is that ethanol adulteration by adding water increases the density of the E-W, pushing the alcoholmeter “up”. The activities of this stage, namely, answering the quiz and the teacher’s comments (after correcting the answers) took one hour.
3.1.2. Preparation of Ethanol-Water Mixtures
The students went to the school´s laboratory to prepare their E-W for analysis by the different experimental techniques. Under supervision, they prepared in one hour nine E-W, 25 mL each.
3.1.3. Activities in the Laboratory of Chem-USP
The objective of the visit to Chem-USP was to determine
the v% of ethanol in: (i) commercial household cleaning aqueous ethanol, (ii) commercial samples of hydrous ethanol fuel, (iii) samples of E-G. They determined the compositions of these samples by measuring their densities and refractive indices, as well as the Uv-Vis absorption of β-carotene solubilized by E-W. We chose these techniques because they are simple, and connected with concepts that the students at this level are familiar with, namely, solutions, mixtures, density, and refractive index.
A comment on the safety aspect of the experiment is in order. Ethanol is commonly employed as solvent in any laboratory [15]. Rather than working with commercial local gasoline whose b.p. range is >35 to 220°C [16], we employed a synthetic mixture whose lowest b.p. component is 98.4°C (n-heptane). The composition of the synthetic gasoline that we employed (v%) is in the range of typical commercial gasolines, namely: 4-8% alkanes; 2-5%, alkenes; 25-40% isoalkanes; 3-7% cycloalkanes; 1-4% cycloalkenes; and 20-50% aromatics [17, 18].
The student groups rotated between the following three experiments: Determination of the densities of E-W; determination of the refractive indices either of E-W or E-G; determination of the absorbance (A) of β-carotene dissolved in E-W. Because determination of the composition of unknown samples is based on calibration curves, e.g., between (n) and v% of ethanol, each group measured the properties of three reference solutions, and two unknowns (furnished by us), see Figure 3. While doing the experiment, each group registered their experimental data in a table, using the Excel software. This table was completed when the last group finished its measurement at the equipment (d, n, or A).
After finishing the measurements, we gathered all groups (working in that day) around one PC, showed them the four calibration curves that they produced, three for E-W and one for E-G, as shown in parts A to C of Figure 4. We pointed out that the correlations between solution composition and physical properties are linear or not, and asked them to calculate the composition of the commercial samples and discuss the curves obtained with their teachers. This laboratory activity took four hours.
0 20 40 60 80 100 0.75
0.80 0.85 0.90 0.95 1.00
d
en
si
ty
(
g/
c
m
3 )
Ethanol (volume %)
(A)
0 20 40 60 80 100
1.34 1.36 1.38 1.40 1.42 1.44 1.46
R
ef
ract
ive I
n
d
ex
Ethanol (Volume %)
(B)
30 40 50 60 70 80 90 100
0.0 0.2 0.4 0.6 0.8 1.0
A
bs
or
ba
nc
e
Ethanol (Volume %)
β
-carotene
(C)
Figure 5. Demonstration of the non-ideality of mixtures of equal volumes (5 mL each) of water plus acetone (flask A) and ethanol (flask B). The final volumes are less than the 10 mL mark. For better visualization of the (transparent) mixtures, we dissolved a few mg of methyl orange
3.1.4. Discussion of the Results and Students´ Evaluation of the Project
The last stage of the project included discussion of the results in class, followed by evaluation of the project. Based on their previous literature survey, the students attributed the non-linear dependence of the density and refractive index of E-W (parts A and B of Figure 4) to the formation of hydrogen bonds between both components of the mixture, as discussed elsewhere [19]. In order to stress this non-ideality and to show that it is a general phenomenon when the components of a mixture interact strongly, their teachers showed them Figure 5, for 50 v% mixtures of organic solvents (acetone and ethanol) with water. We prepared these mixtures at 25°C and added a few mg of methyl orange for a better visualization of the (transparent) solvent level. As shown in Figure 5, the final volumes are less than the sum of the volumes of (water + organic solvent; 5 mL each) that we added to each flask.
Part C of Figure 4 shows that the dependence of absorbance of dissolved β-carotene on mixture composition (Beer´s law plot) is composed of two straight lines with different slopes. Their teachers explained this result by the fact that β-carotene is slightly soluble in ethanol (30 mg/L) and insoluble in water [20]. Consequently, the dye exists in monomeric and aggregated forms, with λmax (in E-W) of 450
(monomer) and 380 nm (aggregate). As a function of increasing the v% of ethanol, more β-carotene is solubilized and the equilibrium (dye aggregate ⇄ dye monomer) is shifted to the right, with pronounced absorbance increase at ca. 85% v% ethanol. Presumably, the reason for this increase is that all water is already hydrogen-bonded to ethanol, i.e., there is enough free alcohol to dissolve the dye in its monomeric form [21]. The correlation between the refractive index of E-G and mixture composition is linear because there is no specific interactions (e.g., hydrogen bonding) between ethanol and the hydrocarbons of the synthetic gasoline. This linear correlation was reported for mixtures of ethanol with gasoline [22], and with a typical hydrocarbon, toluene [23].
As Parts A to C of Figure 4 show, the experiment served to verify the concentration of ethanol in commercial products. The Brazilian legislation (INPM, Weights and Measurements National Institute) for household cleaning ethanol is 46 wt%, or 54 v% [24]. The average obtained by the students is 55.2%, i.e., the products conform to the legislation. Likewise, alcohol car fuel should be 92.5 -93.8 wt% or 95.1 – 96.0 v% in ethanol [25] (ANP, Petroleum National Agency). The average of their results is 95.4 v%. Their results for the unknown E-G (that we provided) were within 2% of the correct values. This activity required one hour; the students were required to turn in their evaluation sheets a week later.
Figure 6 summarizes the students´ answers regarding the level of their participation in the different stages of the project. As the blue-colored columns show, the majority participated in each stage.
Figure 6. Level of participation of the students in the different stages of the project, as evaluated on a 0 to 5 scale, namely, 5 and 4 (blue; active participation), 3 (green; moderate participation), 2 and 1 (little participation)
0
20
40
60
80
Literature survey Preparation of E-W Data acquisition /
plotting
Results and discussion
S
tu
d
en
ts (
%
)
Figure 7. Summary of the students´ answers to a question about the positive aspects of the project
Most students (72.1%) participated in the preparation of the E-W, and between 81.4 and 86.0% participated either actively or moderately in the other three activities. Their participation in data acquisition/plotting was limited by the availability of equipment (one of each), and PCs in the Chem-USP laboratory. The (low) heights of the green columns of Figure 6 (average 13.9%) shows that they enjoyed participating in all stages of this project.
Figure 7 summarizes their answers to our questions in the evaluation sheet about the positive aspects of this project. The students considered the following important: Using new techniques; the analysis of data obtained, and working in teams. We asked a question about their previous contact with several subjects/techniques. They answered that this is their first contact with the industrial processes for obtaining anhydrous ethanol (72.2%); the octane number (75.9%); digital refractometer and density meter (87%), and Uv-Vis spectrophotometer (84.6%).
Some of the equipment employed in this project is admittedly sophisticated for high school students. To show that this is no barrier for carrying out this project in high schools, we verified the following: We obtained satisfactory results when the density of the mixtures was determined by mass, using good quality volumetric glassware and an analytical balance. Likewise, we repeated the refractive index experiment satisfactorily using the above-mentioned Abbe refractometer. Because β-carotene absorbs intensely in the visible region (ε at 445 nm = 145100 Lmol-1 cm-1 [20]), any low-cost spectrophotometer can be employed.
4. Conclusions
We employed the active learning approach to introduce a project of socio-economic importance to high school students and promote their contact with Chem-USP. The students analyzed aqueous ethanol employed for household cleaning; hydrous alcohol fuel; E-W that they prepared in their schools, and E-G that we provided. The experiment is
safe, can be done with simple equipment, generates little residue that is easy to dispose (e.g., by incineration), and serves to highlight important concepts (density, refractive index, light absorption) and link them to an everyday situation, buying a fuel at the gas station.
ACKNOWLEDGEMENTS
We are grateful to the students of the following high schools for their participation in this project and their enthusiasm: Colégio Waldorf-Micael de São Paulo; Escola de Química., and Colégio Bandeirantes. We are indebted to their teachers that conducted the parts of the project in the schools: Paula Brotero (Colégio Waldorf-Micael), Gabriel B. Polho and André Franco (Escola de Química and School of Medicine-USP), Lilian Siqueira and Fábio Siqueira (Colégio Bandeirantes). O. A. El Seoud thanks FAPESP and CNPq research foundations for financial support and for research productivity fellowship, respectively.
REFERENCES
[1] http://www.carsdirect.com/green-cars/gasohol-facts-figures-and-common-blends; accessed October 28th, 2015.
[2] Basso, L.C.; Basso, T.O.; Rocha, N.S., “Ethanol production in Brazil: The industrial process and its impact on yeast fermentation”. www.intechopen.com/download/pdf/20058; accessed October 28th, 2015.
[3] http://www.eesi.org/files/Robert_McCormick_061215.pdf, accessed October 21st, 2015; Celik, M. B.; “Experimental determination of suitable ethanol-gasoline blend rate at high compression ratio for gasoline engine”; Applied Thermal Engineering, 2008, 28 396 – 404.
[4] http://nxt.anp.gov.br/nxt/gateway.dll/leg/resolucoes_anp/201 3/fevereiro/ranp%207%20-%202013.xml; accessed October 28th, 2015.
0
20
40
60
80
100
Using new
techniques
Analysis of data
obtained
Team work
St
uden
ts
(%
[5] http://www.mundoeducacao.com/geografia/alcool-combusti vel.htm; accessed October 28th, 2015.
[6] http://en.wikipedia.org/wiki/Ethanol_fuel_in_Brazil; accessed October 26th, 2015.
[7] http://www.unica.com.br/download.php?idSecao=17&id=17 629673; accessed October 28th, 2015.
[8] http://www.afdc.energy.gov/fuels/fuel_comparison_chart.pd f, accessed October 26th, 2015; http://prh.mecanica.ufrj.br/in dex_arquivos/palestras/20121207-1.pdf, accessed October 28th, 2015.
[9] Galgano, P. D.; Loffredo, C.; Sato, B. M.; Reichardt, C.; El Seoud, O. A.; “Introducing education for sustainable development in the undergraduate laboratory: quantitative analysis of bioethanol fuel and its blends with gasoline by using solvatochromic dyes”; Chem. Educ. Res. Pract., 2012, 13, 147.
[10] Novaki, L. P.; Costa, R. T.; El Seoud, O. A., “Green chemistry in action: An undergraduate experimental project on the quantitative analysis of bioethanol blends with synthetic gasoline using natural dyes”, J. Lab. Chem. Educ., 2015, 3, 22-28.
[11] Hsu, K.-Y.; Clever, H. L., “Enthalpy of mixing of some hydrocarbon-alcohol and hydrocarbon-nitroalkane mixtures at 25deg”, J. Chem. Eng. Data, 1975, 20, 268-271; Boyne, J. A.; Williamson, A.G., “Enthalpies of mixture of ethanol and water at 25 degree C”, J. Chem. Eng. Data, 1967, 12, 318–318.
[12] http://www.agencia.cnptia.embrapa.br/gestor/cana-de-acucar /arvore/CONTAG01_33_711200516717.html; accessed October 28th, 2015.
[13] Skrzecza, A.; Shaw, D.; Maczynski, A., “IUPAC-NIST Solubility Data Series 69. Ternary Alcohol– Hydrocarbon–Water Systems”, J. Phys. Chem. Ref. Data, 1999, 28(4), 983.
[14] Lei, Z.; Li, C.; Chen, B., “Extractive Destillation: A Review”, Separation & Purification Reviews, 2003, 32(2), 121-213. [15] Vogel, A.I.; Tatchell, A. R.; Furnis, B. S.; Hannaford, A. J.;
Smith, P. W. G.; in Vogel’s Textbook of Practical Organic Chemistry, 5th Edition, 1996.
[16] http://www.br.com.br/wps/wcm/connect/52cb170043a79d87 baa2bfecc2d0136c/fispq-auto-gasolina-comum.pdf?MOD=A
JPERES; accessed October 28th, 2015.
[17] International agency for research on cancer- summaries & evaluations. Gasoline, 45, 1989, 159
[18] http://www.atsdr.cdc.gov/toxprofiles/tp72-c3.pdf; accessed October 28th, 2015
[19] Kuchuk, V.I.; Shirokova, I. Y.; Golikova, E.V.; “Physicochemical properties of water-alcohol mixture of a homological series of lower aliphatic alcohols”; Glass Physics and Chemistry, 2012, 38 (5), 460-465.; Abdulagatov, I.M.; Akmedova-Azizova, L. A.; Azizov, N.D.; “Experimental study of the density and derived (excess, apparent, and partial molar volumes) properties of binary water + ethanol and ternary water + ethanol + lithium nitrate mixtures at temperatures from 298 K to 448 K up to 40 MPa”; Fluid Phase Equilibria, 2014, 376, 1-21.
[20] Craft, N. E., Soares Jr, J.H., “Relative Solubility, Stability, and Absorptivity of Lutein and β-Carotene in Organic Solvents”, J. Agric. Food Chem., 1992, 40, 431-434.
[21] Sujak, A.; Okulski, W.; Gruszecki, W.I.; “Organisation of xanthophyll pigments lutein and zeaxanthin in lipid membranes formed with dipalmitoylphosphatidylcholine”, Biochimica et Biophysica Acta, 2000, 1509, 255-263; Ruban, A.V.; Horton, P.; Young, A.J.; “Aggregation of higher plant xanthophylls: differences in absorption spectra and in the dependency on solvent polarity”, J. Photochem. Photobiol. B: Biol., 1993, 21, 229-234.
[22] http://www.eventoscientificos.com/imoc2009/papers/pdf/59 090.pdf; accessed October 28th, 2015; Possetti, G.R.C.; Muller, M.; Fabris, J.L.; “Refractometric optical fiber sensor for measurement of ethanol concentration in ethanol-gasoline blend”, 2009 SBMO/IEEE MTT-S International Microwave & Optoelectronics Conference, IMOC 2009, 616-620. [23] Kwak, H.-Y.; Oh, J.-H.; Park, S.-J.; Paek, K.-Y.; “Isothermal
vapor–liquid equilibrium at 333.15K and excess volumes and molar refractivity deviation at 298.15K for the ternary system di-butylether (1) + ethanol (2) + toluene (3) and its binary subsystems”, Fluid Phase Equilibria, 2007, 262, 161. [24] http://www.prefeitura.sp.gov.br/cidade/secretarias/upload/ch
amadas/alcool_etilico_hidratado_46_inpm_54gl_3jul15_143 5929002.pdf; accessed October 28th, 2015.