www.elsevier.nlrlocatereconbase
The demand for private health care in the UK
Carol Propper
)Department of Economics, CASE and CEPR, UniÕersity of Bristol, Bristol BS8 1TN, UK
Received 9 November 1998; received in revised form 2 March 2000; accepted 3 March 2000
Abstract
Policy change has eroded the entitlement of UK residents to free state-provided health care, with a resulting rise in the use of the private sector. This paper examines the choice between public and private health care. It models the use of private health care as a function of its costs and benefits relative to state care and no care. The results indicate a difference between users of private care and other care, and the importance of past use as a predictor of current use. But they also show considerable movement between the public and private
sectors, indicating a complex relationship in public and private sector use.q2000 Elsevier
Science B.V. All rights reserved.
JEL classification: I1; H4
Keywords: Private health care; Public health care
1. Introduction
Health care in the UK is predominately state-financed. However, while approx-imately 85% of funding comes from the public purse, the use of private health care services is rising. While politicians have stressed their commitment to tax-financed free hospital care, policy change has reduced eligibility for publicly provided treatment, increased copayments for dental, ophthalmic services and pharmaceuti-cals, and reduced the payments made to independent contractors who provide state
)Tel.:q44-117-928-8427; fax:q44-117-954-6997.
Ž .
E-mail address: [email protected] C. Propper .
0167-6296r00r$ - see front matterq2000 Elsevier Science B.V. All rights reserved.
Ž .
financed dental care. These changes have been accompanied by a growth in the importance of the private sector in the provision of health care in the UK.
Ž .
This growth could affect public provision the NHS in a number of ways. First, reductions in the availability of free care, particularly reductions which may not have been the intended consequence of policy, may affect whether NHS equity goals are being met. Second, the demand for private sector services affects the public sector. As in many health care systems in which the private sector operates alongside a larger public sector, labour in the NHS is also employed in the private sector, often simultaneously. In the short run, a significant expansion in private demand would reduce the availability of staff to the public sector and so reduce the quality of public sector services. More subtly, an increase in the use of private services may be accompanied by a decrease in the support for, and willingness to pay, taxes for the public sector. High private usage leading to lack of ‘ voice’ and taxpayer discontent could lead to the evolution of the NHS into a ‘poor service for the poor’.
This last effect is likely to be less important if individuals who use private services continue to use the NHS at the same time and if the use of the private sector for one type of service is not linked to use of another. Given the piecemeal nature of policy change on the use of private finance in UK health care, this is perfectly possible: individuals may use both public and private services and may retain an overall strong commitment to the state financing of health care even though they are private service users. On the other hand, the changes in policy may have led to the development of a group of users who demand almost all their health care from the private sector and who have little commitment to public funding of health care.
A small body of research has identified the importance of income and political Ž
attitudes in the use of private health care services Papadakis and Taylor Gooby,
. Ž .
1987; Taylor-Gooby, 1989; Calnan et al., 1993 . Propper 1989, 1993 found income and political beliefs affected the decision to buy private medical insurance.
Ž .
Besley et al. 1999 show a link between medical insurance purchase and quality of NHS services. This research has not been able to establish whether the distinct economic and social profile of private sector users is simply due to individual fixed effects or whether changes in income or attitudes would increase private sector use. Nor has any research examined the dynamics of private sector use: whether use is related to past demand, or whether current demand for one private service is accompanied by private demand for another.
This paper focuses on these issues. It estimates a model of the use of health care services which takes into account the choice a potential user of care in the UK has among the private sector, the NHS, and no care. It examines not only hospital and physician use but also the use of dental and other services based in the community. The estimated model allows past use to affect the costs and benefits of these alternatives. The data are from the British Household Panel
Ž .
interviewed each year since 1991. In terms of health care, and particularly private health care use, it is a rich data set. It contains information on medical need, on measures of political beliefs about the role of the public sector in the provision of health care, and on a large set of individual and household characteristics. In addition, it has data on health care utilisation that distinguishes between use of NHS and private services and, within private services, between those that are publicly funded and those that are paid out of pocket or by insurance.1
The results indicate that use of private care is strongly related to income, a set of identifiable individual demographic characteristics and political attitudes. Pri-vate users are healthier than their NHS counterparts. PriPri-vate use in the past is significantly associated with current use. Further, all these factors continue to be significantly associated with private use after controlling for unobserved individual effects. So, in this sense there is perhaps a definable ‘private welfare class’. On the other hand, private sector users do not live by private use alone. The results indicate considerable movement of individuals over time between the public and private sector. Current use of the private sector is positively associated with both past and future use of the NHS. Current use of the NHS increases the chances of future use of the NHS, and for some services, also increases the probability of use of private services in the future.
So, in addition to an understanding of who buys private health care, the paper also contributes to an understanding of the links between the private and public sectors in the UK. While there is considerable research on the link between public
Ž
and private health care sectors in the American context for example, Cutler and .
Gruber, 1996a,b , the amount of UK research is small. MacAvinchey and Ž .
Yannopolous 1993 estimate a cost shares model using aggregate data in which they find significant cross-price elasticities between public and private care,
Ž .
Martin and Smith 1998 use ward level data and find an effect of waiting lists on Ž .
demand for NHS elective surgery, and Besley et al. 1999 use microdata and find a positive relationship between waiting lists and private insurance. The results presented here show the patterns of association between public and private sector use to be quite complex. Private use in the past is more likely to lead to current private use than NHS use is in the past, but private service use in the past is also associated with NHS current use.
The paper is organised as follows. Section 2 presents an overview of private financed health care in the UK, and a description of the users of this care from the BHPS. Section 3 presents a model of the choice among use of private care, public care and no care, which motivates the demand for private care where a free public alternative exists. The econometric model derived from this model is then
pre-1
sented. Section 4 presents estimates of the choice between the three alternatives. Section 5 focuses on the effect of past use and controls for individual effects. The final section discusses the results.
2. Private health care in the UK
Private expenditure on health care in the UK has grown from 9% of total health care expenditure in 1979 to 15% in 1995. This figure is made up of private
Ž .
medical insurance premiums paid for by employers or individuals and out of pocket expenditure on private medical services and goods. Out of pocket expendi-ture includes payment for inpatient private care, other hospital services, outpatient services, dental care, eye care, copayments for prescribed medicines and over the counter medicines.
Private provision of hospital services has always existed alongside the NHS. The 1991 NHS reforms attempted to give an incentive for the expansion of such care through tax relief on private medical insurance for the over-60s, but despite this, growth in private medical insurance has remained slow during the 1990s. On the other hand, policy change in dental and eye care appears to have had a bigger impact on private use. In 1985, NHS provision of glasses was restricted to certain
Ž
groups children, students under 19, individuals on low income, and users of .
certain complex lenses , and public provision was replaced the following year by vouchers. In dentistry, free dental check ups were restricted to the same groups in 1989. Although NHS treatment is supposed to be available to all, copayments Žuser fees have risen. Changes to the level of fees paid to dentists who provide. NHS care has led to widespread dissatisfaction amongst dental care providers, and to anecdotal evidence of a reduction in the dental services available under the NHS.
This paper examines the use of private services where an NHS alternative exists. In some cases this NHS alternative is free at point of demand. In other cases, eligibility rules mean certain groups are not entitled to free NHS care but NHS provision, with copayments for those not entitled to free care, is supposed to be available to all. The paper examines any use of private care and then focuses on two specific types of private health care service: inpatient hospital care and dental care. Private inpatient use is of interest because NHS quality measures, particu-larly waiting lists, are thought to be important in determining use, and if there is a link between these measures and private health care insurance it is through the Žexpected. use of private inpatient services.2 Dental services are of interest
because, although all individuals are entitled to NHS dental care, it is argued the
2
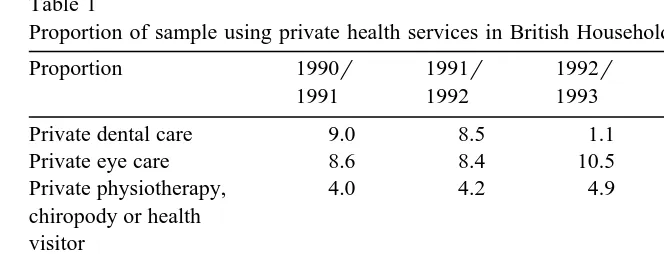
Table 1
Proportion of sample using private health services in British Household Panel 1990–1995
Proportion 1990r 1991r 1992r 1993r 1994r
1991 1992 1993 1994 1995
Private dental care 9.0 8.5 1.1 11.6 12.7
Private eye care 8.6 8.4 10.5 10.0 10.7
Private physiotherapy, 4.0 4.2 4.9 5.2 5.0
chiropody or health visitor
Private inpatient stay 1.0 0.9 0.8 0.9 0.9
Any private health 18.4 17.5 20.9 21.3 22.4
service use
Ž .
Base weighted 9911 9458 9021 9054 8816
availability of such care is being reduced by suppliers without any explicit change in government policy.
Table 1 shows the patterns in private demand for the different services for each of the first 5 years of the survey. Approximately 16% of individuals in the BHPS sample use either private dental, eye, hospital or outpatient services. The table indicates a general rise in private service usage across the 5 years of the survey, with only private inpatient use showing no growth.
3. The demand for private health care
3.1. The economic model
Ž .
Goddard and Smith 1998 outline a simple model of demand for medical care where public and private care exists. This can be used to explore the impact of income, price and quality of the public alternative, attitudes to the role of state in the provision of health care, and past use on the current demand for private care.
Ž .
The model follows Goddard et al. 1994 in recognising that an individual has three discrete choices: to seek no medical care, to use private care, and to use public care. These choices will be affected by the severity of illness, the costs and the quality of NHS care, and the costs and quality of private care.
For any individual, indexed by i, let V be the benefit of private health care andi
Ž .
p be the cost relative to income . The existence of the public sector constrainsi
parametert. At its simplest, this can be waiting time but can be thought of more Ž
generally as encompassing other quality dimensions such as the provision of . information, or the ability to choose the exact date and location of treatment . Individuals vary in their valuation of this quality by the parameter g . Ifi t is thought of as waiting time, g can be thought of as the rate at which the value ofi
Ž
treatment decays because it is received later rather than sooner Lindsay and
. Ž .
Feigenbaum, 1984 . The value of NHS treatment for individual i is V expi ygit . NHS care has no direct user price but the individual has to access NHS facilities. Let this cost be c .i
Faced with these costs and benefits, the potential user is indifferent between private and NHS care when
ViyV expi
Ž
ygit.
spiyciŽ .
1is indifferent between private care and no care when
Vispi
Ž .
2and is indifferent between NHS care and no care when
V expi
Ž
ygit.
sc .iŽ .
3Ž . Ž .
Eqs. 1 – 3 can be used to examine the impact of changing parameters on the choice of the three alternatives. Decreasing p will increase the use of the privatei
alternative and decrease the use of the NHS and no care alternatives. Decreasing
c will increase the use of NHS treatment and reduce the use of private and noi
care. An increase in g will increase the use of private care, reduce the use ofi NHS care and increase the use of no care. The effect of an increase int is the same. An increase in V will increase the use of private care and NHS care.i
These parameters will vary across individuals. The value of the benefits of medical treatment V will obviously be related to the severity of illness. Ini
addition, as V is the perceived benefit to the user of care, it may also be ai
function of the importance of good health to the individual. This is often argued to be positively associated with education. Wheret is taken to be the waiting time for NHS treatment, g is the individual’s valuation of time. This can be expectedi
to be a positive function of income and of type of employment. For example, those who are self-employed are less likely to get paid whilst waiting for medical treatment.3 Wheret is the quality of the NHS, g is the valuation of NHS quality.i
This might be expected to be a function of the individual’s general attitudes to the
3 Ž .
NHS. For example, those who strongly value state provision of health care may be more tolerant of poorer quality. Then those who hold such attitudes will use more NHS services for a given value of V andi t.
The value of p will be lower for those individuals who have medical insurancei
which covers the cost of private care and lower for those with higher income Žsince p is defined relative to all other goods . Since c is the access cost to NHSi . i facilities, it will be lower, leading to greater availability of NHS facilities.
The nature of medical care means these prices will also be a function of past use of services. First, the price of care in each sector includes the costs of search. In health care, consumers cannot always tell good from poor quality. As a result, regulation limits advertising and consumers are reliant on their own knowledge and that of friends, relatives etc. As a consequence, search costs for a supplier of care may be high. Second, information asymmetries mean trust is an important component of the relationship between suppliers and demander of care. Third, an individual invests effort in communicating their medical history to a supplier of health care. So once an individual has found one supplier, they may be less likely to change to another. A consumer who has used the private sector in the past will have lower search costs for private sector use and will have made an investment with a private supplier. Similarly, a consumer who has recently used the NHS will have lower NHS care search costs and will have made an investment with an NHS supplier. So the costs of care in each sector are likely to be a function of past use, and current use is likely to depend upon past use.
3.2. The econometric model
At any time t, the individual chooses between private care, public care and no care. She thus has J alternatives. Let js1 denote no care, js2 denote NHS
Ž . Ž .
care, and js3 private care. From the economic model of Eqs. 1 – 3 , the latent net valuations associated with each alternative will depend on the characteristics of
Ž .
the individual her valuation of health states, of time, of price etc. . The weight attached to each characteristic will vary by alternative. Allowing for random error, the latent net valuations of the jth choice can be written as:
m)sbXzqe
Ž .
4ji j i ji
Ž
where z is a vector of attributes of the individual which may be allowed to varyi
. 4
by alternative as well and eji is a random error term.
4 Ž .
If the individual is observed making choice j, it is assumed that m) has the ji
highest net valuation. The statistical model is driven by the probability that choice
j is made, which is
Pr m
Ž
))m).
for all k/j.ji k i
If the eji are assumed to be i.i.d. with Weibull distribution, then the statistical model that results for the choice of alternative is the multinomial logit model:
J
X X
bjzi bkzi
Pr m
Ž
isj.
se rÝ
eŽ .
5ks1
where m is the observed choice of individual i. To estimate the parameters of thisi
model it is necessary to normalise and impose the restriction that one of the
bjs0. In estimation of this model, I impose the restriction that b1s0.
From the discussion above, the specific characteristics that will influence the
Ž .
choice the individual makes i.e. the variables in zi include income and health Ž
status, the costs of accessing each service which will be a function of the costs of .
private care, past use, and the availability of services and the perceived quality of Ž
the public service which will be a function of waiting lists and possibly attitudes .
to the public sector role in financing health care . In addition, there may be regional effects. So the latent net valuation of alternative j will depend on:
m)sf X ,Q , m
Ž
, R;e.
, js1,2,3Ž .
6ji i r ji ty1 ji
where Xi is a set of personal and household demographics, socio-economic variables including income, and measures of the beliefs individuals hold about the appropriate role for the private sector in the provision of health care, Q a set ofr indicators of the quality of NHS provision in the region in which the individual lives, R a vector of regional dummies, mji ty1 is use of alternative j last period, and eji is white noise error.
The data set records use at five time points and of several health services,
Ž .
denoted s defined below . So the data permit examination of the impact of past use of one service on another and of past use of one alternative on another. To estimate these effects I pool the panel data and expand the set of variables in Eq. Ž .6 to include these ‘cross-service’ and ‘cross-alternative’ effects and also to allow for time effects. The latent utility for alternative j of service s at time t is thus:
ms)sb X qb Q qb m qb mX qb Rqb Tqe ,
ji t 0 i t 1 r t 2 ji ty1 3 j i ty1 4 5 ji t
js1,2,3
Ž .
7where m and mX are now vectors of past service use, j X
indexes the other
ji ty1 j ity1
Ž .5 the parameter estimates will differ across the two alternatives but for simplicity of notation we have dropped the subscripts on these. As the restriction that the
Ž .
parameter estimates are 0 for alternative 1 no care is imposed, parameters are estimated only for alternatives 2 and 3. In pooling the data and conditioning on information at time t, the assumption made is that the errors are not correlated over time for an individual. In addition, the MNL model imposes the assumption of independence of the errors across options.5
3.3. The data
From the BHPS data I define the use of three services or sets of services. The Ž first set of services is defined as use of any of the services given in Table 1 dental
6.
care, eye care, inpatient stays, certain community services . If the respondent used any of these services in year t and any of her use was private, she is recorded as having positive private use in year t. If she used any of these services and none of her use was private, she is recorded as having positive NHS use in year t. The second service is an inpatient hospital stay. If this stay is privately paid for, the respondent is recorded as having a private stay. If the stay is not privately paid for, then she is recorded as an NHS user. The third service is dental care, where if the respondent has dental care and any of that care is private, she is recorded as having private dental care. If she has some dental care and none of it is private, she is recorded as having NHS dental care.7
In addition to measures of health service use and standard socio-economic and demographic data for each individual in the household, the BHPS includes measures of current self-assessed health status, and detailed measures of longer term health status. Individuals are asked whether they are limited in their daily
Ž .
activities including work and leisure ADLs . If they have any limitations they are asked whether these limit their ability to work. They are also asked what specific limitationsrconditions they have. The data also record whether the individual is a smoker, and if the answer is positive the number of cigarettes consumed per day. Earlier research on the demand for private health care in the UK has either used no
Ž .
measures of health status Besley et al., 1999 , or rather more limited measures ŽPropper, 1993 . Here the BHPS data are used to control for a large number of. measures of health status. In addition, conditioning on health status enables a
5
While this is an unattractive feature of the MNL model, the rich set of regressor variables should reduce correlation between the errors.
6
These community services are all services for which NHS provision exists. The BHPS records use of other private services for which there is no NHS alternative. As we are interested in the choice between no use, NHS use and private use, we do not examine these services.
7
reduction in the potential contamination of the income coefficient, which arises from the correlation between health and income. To these data are matched regional indicators of the quality of the NHS. These are the length of NHS waiting
Ž
lists over- and under-12 months deflated by the regional population relevant for
. Ž
inpatient care and an index of dental service availability relevant for dental .8
care . The prices paid by individuals are not observed so the impact of price is not examined.9As price at point of use for hospital inpatient services will depend
on insurance coverage but the BHPS does not record private insurance cover, occupational dummies are included as instruments for corporate cover.10
4. The determinants of private, NHS and no demand
Ž .
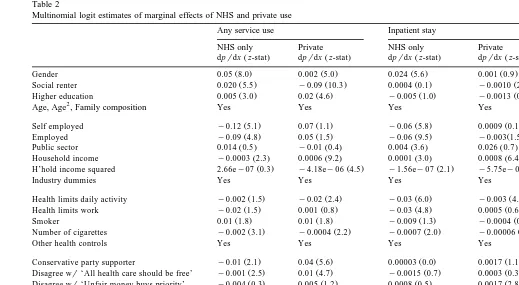
A multinomial logit MNL model of the use of public and private care is estimated. Table 2 presents the estimates of the model where the omitted alterna-tive is no care. The table presents separate results for the three sets of services defined above. Interpretation of the parameters in an MNL model is not straight-forward, so instead of coefficient estimates, the table gives the estimated marginal effect of variable xi on choice of alternative j.11 The interpretation of the marginal effect is the impact of a unit change of the variable x on the choice ofi alternative j. Table 2 presents the marginal effects for the choice of the private and the NHS alternatives. To show which variables have coefficients that are signifi-cantly different from 0, the z-statistics for the coefficient estimates are presented as well.
In general, the coefficients are well defined and indicate significant differences between users of the different alternatives. The results for the use of any care show that users of private care and users of NHS care share some demographic characteristics. Women are more likely to demand care in either sector than men, though the log-odds of private use compared to NHS use is lower for women. There is some indication that users of health care services in either sector rate their health as better health than the non-users of services. Individuals who smoke more, conditional on being smokers, are less likely to use either NHS or private services. These health status results perhaps reflect the fact that the any service set includes preventive services. Educational attainment is positively associated with use of both sectors, though the magnitude of the estimated marginal effects is
8 Ž .
These measures and the issues of possible endogeneity are presented more fully in Propper 1998 .
9
A measure of the price of inpatient medical care is the average annual private insurance price. This varies by year but not by region. This measure was used in initial estimates, but had a small and insignificant coefficient estimate and therefore was dropped from subsequent analysis.
10 Ž .
Besley et al. 1999 found that corporate health insurance cover varies by occupation.
11
The estimated marginal effects aredpjrdx . The relationship to the estimatedi bj isdpjrdxs
Ž .
()
Any service use Inpatient stay Dental visit
NHS only Private NHS only Private NHS only Private
Ž . Ž . Ž . Ž . Ž . Ž .
dprdx z-stat dprdx z-stat dprdx z-stat dprdx z-stat dprdx z-stat dprdx z-stat
Ž . Ž . Ž . Ž . Ž . Ž .
Gender 0.05 8.0 0.002 5.0 0.024 5.6 0.001 0.9 0.03 4.9 y0.005 0.9
Ž . Ž . Ž . Ž . Ž . Ž .
Social renter 0.020 5.5 y0.09 10.3 0.0004 0.1 y0.0010 2.8 y0.021 7.2 y0.060 8.7
Ž . Ž . Ž . Ž . Ž . Ž .
Higher education 0.005 3.0 0.02 4.6 y0.005 1.0 y0.0013 0.9 0.012 2.6 0.0084 2.8
2
Age, Age , Family composition Yes Yes Yes Yes Yes Yes
Ž . Ž . Ž . Ž . Ž . Ž .
Self employed y0.12 5.1 0.07 1.1 y0.06 5.8 0.0009 0.1 y0.063 3.5 0.031 1.6
Ž . Ž . Ž . Ž . Ž . Ž .
Employed y0.09 4.8 0.05 1.5 y0.06 9.5 y0.003 1.5 y0.05 3.9 0.025 1.7
Ž . Ž . Ž . Ž . Ž . Ž .
Public sector 0.014 0.5 y0.01 0.4 0.004 3.6 0.026 0.7 0.0078 0.4 y0.0069 0.7
Ž . Ž . Ž . Ž . Ž . Ž .
Household income y0.0003 2.3 0.0006 9.2 0.0001 3.0 0.0008 6.4 y0.0001 2.9 0.00028 7.4
Ž . Ž . Ž . Ž . Ž . Ž .
H’hold income squared 2.66ey07 0.3 y4.18ey06 4.5 y1.56ey07 2.1 y5.75ey08 3.8 6.1ey08 0.7 y1.85ey07 3.6
Industry dummies Yes Yes Yes Yes Yes Yes
Ž . Ž . Ž . Ž . Ž . Ž .
Health limits daily activity y0.002 1.5 y0.02 2.4 y0.03 6.0 y0.003 4.0 0.012 0.2 y0.023 2.3
Ž . Ž . Ž . Ž . Ž . Ž .
Health limits work y0.02 1.5 0.001 0.8 y0.03 4.8 0.0005 0.6 0.026 2.0 0.012 2.0
Ž . Ž . Ž . Ž . Ž . Ž .
Smoker 0.01 1.8 0.01 1.8 y0.009 1.3 y0.0004 0.4 0.03 1.8 0.002 0.8
Ž . Ž . Ž . Ž . Ž . Ž .
Number of cigarettes y0.002 3.1 y0.0004 2.2 y0.0007 2.0 y0.00006 1.0 y0.003 3.1 y0.0003 1.6
Other health controls Yes Yes Yes Yes Yes Yes
Ž . Ž . Ž . Ž . Ž . Ž .
Conservative party supporter y0.01 2.1 0.04 5.6 0.00003 0.0 0.0017 1.1 y0.0004 1.8 0.020 4.8
Ž . Ž . Ž . Ž . Ž . Ž .
Disagree wr‘All health care should be free’ y0.001 2.5 0.01 4.7 y0.0015 0.7 0.0003 0.3 0.00033 2.2 0.010 5.2
Ž . Ž . Ž . Ž . Ž . Ž .
Disagree wr‘Unfair money buys priority’ y0.004 0.3 0.005 1.2 0.0008 0.5 0.0017 2.8 y0.002 0.5 0.0013 0.4
Ž . Ž . Ž . Ž . Ž . Ž .
Public use ty1 0.30 43.3 y0.015 21.8 0.09 20.1 y0.002 0.3 0.36 65.0 0.012 25.3
Ž . Ž . Ž . Ž . Ž . Ž .
Private use ty1 0.02 20.3 0.24 36.4 0.004 0.3 0.026 13.6 0.105 21.1 0.19 42.1
Ž . Ž . Ž . Ž .
Regional dummies Yes Yes Yes Yes Yes Yes
Log likelihood y17,960 y6630 y14,844
Sample size 21,002 20,962 20,598
Ž .1 z-Stats are for coefficient estimates and are calculated using robust standard errors. 2 Health controls are dummy variables for whether individualhas health problems with or suffers from theŽ .
following conditions: limbs, sight, hearing, skin, chest, heartrblood pressure, stomachrdigestion, diabetes, anxietyrdepression, alcoholrdrugs, epilepsy, and other conditions not specified in this
Ž . Ž .
larger for the private alternative. Previous analyses of NHS use have also found a Ž
positive association between NHS use and education sometimes argued to be .
evidence of middle class capture of the welfare state .
On the other hand, there are clear differences, in the expected direction, in the socio-economic characteristics of the users of the two sectors. Private users are less likely to live in social rented housing, and NHS health care users are more likely to do so. Being employed is negatively associated with use of public care, but positively associated with use of private care. Income is more heavily associated with use of the private sector than use of the NHS. Individuals who report that they are limited in their daily activities are less likely to use any private health services than to use the NHS.
There also appears to be a clear association between private use and political attitudes. Being a Conservative supporter is associated positively with private sector use and negatively with NHS use. Users of NHS services are slightly more pro-free care than non-users, but private users are significantly less supportive of the principles of the NHS. It is possible that these attitude measures are endoge-nous: individuals who use private services justify their use by holding relatively ‘anti’ NHS views. The endogeneity of these variables is investigated elsewhere ŽBurchardt and Propper, 1999 where it was found that, while private users hold. less positive attitudes to the NHS, there is no clear evidence that private sector use leads to less support for the NHS than does NHS use.
It is possible also that these attitudinal variables are correlated with the regressors and with the error terms but play no casual role in health care decisions. To investigate this, the model was re-estimated constraining the coefficients on the party support and attitudinal variables to be 0. The coefficient estimates on the other variables changed very little and none of the changes were statistically significant.12 I therefore conclude that the results are robust to inclusion of the
attitudinal variables, and that these variables play an independent role in the choice of alternative.
There appears to be no clear association between the length of either waiting lists under a year or over a year and use of either alternative. The coefficient estimates of these variables were not significantly different from zero at conven-tional levels. Therefore, the marginal effects of these variables are not presented. The estimates for inpatient and dental service use indicate demographic differ-ences between users and non-users of these services. These, in part, reflect the type of service. For example, the demanders of dental care in either sector are younger, which may reflect the fact that dental care is in part preventative and those who are younger perceive more benefit from such care. There are also clear socio-economic differences between the users of private and NHS care for these two services. NHS inpatient users are less likely to be employed and are more
12
likely to live in social rented housing than either non-users or private users. NHS dental service users are poorer and less likely to be employed, reflecting the eligibility requirements for free dental check-ups. In terms of political attitudes, private inpatient users are less supportive of the equity principles of the NHS than either NHS users or non-users. For dental services, Conservative party support is positively associated with private use and negatively associated with NHS use. However, both NHS and private users of dental services are less supportive of the equity principles of the NHS than are non-users. This perhaps reflects the fact that users of dental services, whether public or private, make some payment and so are more used to paying for care than non-users of dental services.
The results also indicate a strong association between lagged and current use. Health status is controlled for, so this is not due to observed differences in health status. For any service use, NHS-only use is associated positively with use last year of either sector. Private use is negatively associated with use last year of NHS services but positively associated with lagged use of private services. Further, the
Ž
estimated effect of past use of services in the same sector the ‘same-sector’ .
effect is substantial larger than the estimated effect of past use of services in the
Ž .
other sector the ‘cross-sector’ effect . For example, the marginal effect of lagged use of NHS-only services on current use of NHS services is 0.3 while the effect of lagged use of NHS-only services on current use of the private sector isy0.015. The ‘same-’ and ‘cross-sector’ effects for lagged private care are 0.24 and 0.02, respectively.
The inpatient and dental estimates show rather different ‘same-’ and ‘cross-sec-tor’ effects. For inpatient services, only lagged ‘same-sec‘cross-sec-tor’ use is associated with current use. The small size of the estimated marginal effect reflects the infre-quency of use of inpatient services. In contrast, for dental services, the marginal effects of lagged use of both NHS and private care are positively associated with current NHS and current private sector use. This perhaps indicates that individuals move between public and private care when the cost difference between public and private treatment is not large and when dental insurance is not widely
Ž .
available as during the period covered by these data .
But even for dental care the impact of lagged ‘own-sector’ use is considerably higher than that of lagged ‘cross-sector’ use. The estimated marginal impact of past NHS dental use on current NHS dental use is 0.36, while the marginal effect of past private dental use on current NHS use is only 0.105. Similar differences in the estimated marginal effects of lagged use can be seen for current private sector use. These results indicate that there is a tendency for individuals to re-use the sector they used last time.13
13
These MNL estimates provide broad support for the model of Section 3. Those who value their health care more highly, as measured by education, use more
Ž .
services. Those with higher costs of waiting time i.e. a higher gi — the employed and those with higher incomes — use more private services. If the parametert is interpreted more broadly as NHS quality, individuals with a higher
g — as measured by political attitudes — tend to be higher users of privatei
services. There appears to be no direct impact of the measures of NHS quality Ž .
used here. If past use is taken as a measure of lower search costs, those for whom the relative price of private services is lower tend to use more private services and those for whom the price of NHS services is lower tend to use more NHS services.
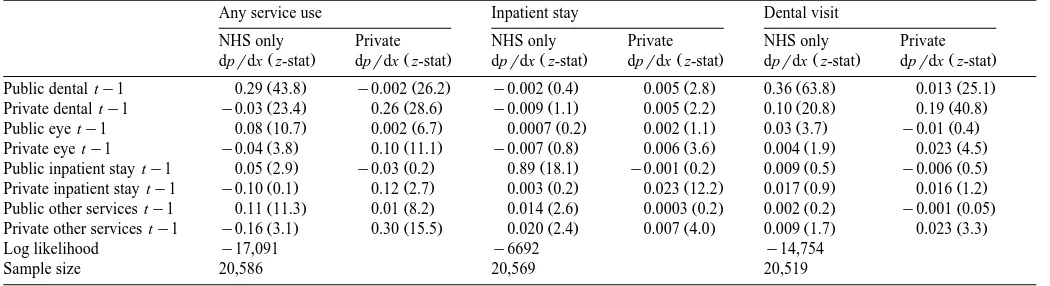
The importance of the lagged effects merits further exploration. The data permit the estimation of not only the effect of use of service s at ty1 on service s at t but also of other services, denoted sX, at ty1 on use of service s at t. Table 3 presents estimates of these marginal effects. The estimated model is the MNL model of Table 2 where lagged past service use is disaggregated into use of four specific services. These are dental care, eye care, inpatient stays, and a group of community-based services. Only the estimates of these lagged use variables are presented. The other coefficient estimates and marginal effects are very similar to those in Table 2.
The results show that use of a service in one sector is in almost all cases significantly associated with use of the same service a year later in the same sector. It is also often associated with use of the same service a year later in the other sector. But these latter ‘cross-sector’ effects are always smaller than the ‘own-sector’ effects. In other words, while individuals do change sector between years, they are more likely to use the same sector again next year rather than switch between sectors.
For inpatient services, there is a positive impact of lagged use in one sector on current use in the same sector. These ‘own-sector’ effects are generally significant but are small. There is little association between an inpatient stay and other service use which, given the low probability of an inpatient event, is not surprising. The ‘cross-sector’ effects are much smaller than for the other services and in most cases the coefficients from which the marginal effects are derived are not well defined. There is an interesting exception to this: the positive association between lagged private use of community services and current NHS inpatient use. This perhaps indicates a lack of availability of NHS community based services.
()
Propper
r
Journal
of
Health
Economics
19
2000
855
–
876
869
Table 3
The impact of past service use: multinomial logit estimates
Any service use Inpatient stay Dental visit
NHS only Private NHS only Private NHS only Private
Ž . Ž . Ž . Ž . Ž . Ž .
dprdx z-stat dprdx z-stat dprdx z-stat dprdx z-stat dprdx z-stat dprdx z-stat
Ž . Ž . Ž . Ž . Ž . Ž .
Public dental ty1 0.29 43.8 y0.002 26.2 y0.002 0.4 0.005 2.8 0.36 63.8 0.013 25.1
Ž . Ž . Ž . Ž . Ž . Ž .
Private dental ty1 y0.03 23.4 0.26 28.6 y0.009 1.1 0.005 2.2 0.10 20.8 0.19 40.8
Ž . Ž . Ž . Ž . Ž . Ž .
Public eye ty1 0.08 10.7 0.002 6.7 0.0007 0.2 0.002 1.1 0.03 3.7 y0.01 0.4
Ž . Ž . Ž . Ž . Ž . Ž .
Private eye ty1 y0.04 3.8 0.10 11.1 y0.007 0.8 0.006 3.6 0.004 1.9 0.023 4.5
Ž . Ž . Ž . Ž . Ž . Ž .
Public inpatient stay ty1 0.05 2.9 y0.03 0.2 0.89 18.1 y0.001 0.2 0.009 0.5 y0.006 0.5
Ž . Ž . Ž . Ž . Ž . Ž .
Private inpatient stay ty1 y0.10 0.1 0.12 2.7 0.003 0.2 0.023 12.2 0.017 0.9 0.016 1.2
Ž . Ž . Ž . Ž . Ž . Ž .
Public other services ty1 0.11 11.3 0.01 8.2 0.014 2.6 0.0003 0.2 0.002 0.2 y0.001 0.05
Ž . Ž . Ž . Ž . Ž . Ž .
Private other services ty1 y0.16 3.1 0.30 15.5 0.020 2.4 0.007 4.0 0.009 1.7 0.023 3.3
Log likelihood y17,091 y6692 y14,754
Sample size 20,586 20,569 20,519
5. Further investigation of dynamics
The results indicate a strong association between past and current use. If past use does determine present use, conditional on income and health status, this has important implications for the evolution of use of the private sector over time. So as the data is a panel, it is used to examine whether the impact of past use is robust to inclusion of individual effects.
To do this I focus on private use only. NHS and no use are combined into one category. For each of the 5 years of data and for each service, a binary indicator of whether the individual has used private health care is observed:
nssI n
Ž
s))0.
i t i t
Ž .
where I . is the indicator function taking a value 1 if the expression in parentheses is true and 0 otherwise, ns) is the latent demand for private health
i t
care, i indexes the individual, t time, and s the service defined as above. This is a model with one error, where that error can be interpreted as the propensity to choose private care. The separate parameter estimates of the three alternative model cannot be recovered14 but, while the parameter estimates will not be the
same as those of the multinomial logit model, the latent utility of private care will again be a function of all the parameters of the economic model. Using the data as a panel means individual effects can be allowed for, so the latent utility of private care is modelled as:
ns)sg X qg Q qg ns
qg Rqg Tqyq´
Ž .
8i t 0 i t 1 r t 2 i ty1 3 4 i i t
where ns is past private use of service s, y is an individual effect, ´ is white
i ty1 i i t
noise, and all other variables are defined as above. Ž .
Eq. 8 is estimated as a random effects probit model. This allows for an individual specific effect, so is a richer error structure than the MNL model
Ž .
estimated above. Eq. 8 also includes the lagged dependent variable as a regressor. In a dynamic panel model where the number of time periods is short, correlation between the random effects term and the initial observation of the
Ž .
dependent variable the so-called initial conditions problem renders random effects ML estimation of the parameters of interest inconsistent if the initial
Ž .
conditions problem is ignored Hsiao, 1986 . To overcome this problem, a method
14
Ž .
suggested by Orme 1997 is used, an outline of which is given in the Appendix. The approach is to augment the model of interest with an estimated term that corrects for the correlation between the initial observation of the dependent
Ž . Ž .
variable ni0 and the random error yi. Orme suggests that this will allow estimation of this correlation and, where this is not too high, the technique will yield adequate inferences for the parameters of interest.
To estimate the correction term requires that the variables that determine the initial observation of private demand are exogenous. To estimate the initial observation, I use parental socio-economic status, age and gender, using the argument that parental socio-economic status affects the initial level of private demand, but not subsequent changes. The estimates indicate that initial demand Žthe 1990r1 BHPS observation is significantly associated with these variables..
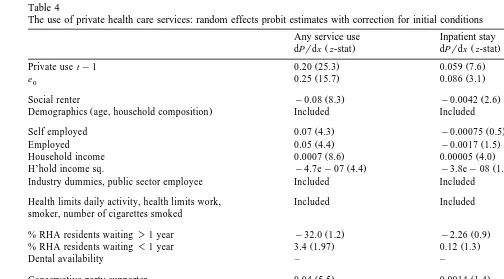
Table 4 presents the random effects probit estimates with the correction term included. Estimates of the marginal effects are presented together with the
z-statistics for the underlying coefficients from which the marginal effects are
derived. The table indicates that the estimates of lagged use remain significant after correction for the initial condition problem. The coefficient on the correction
Ž . ) Ž
term e0 indicates a positive correlation between ni0 andyi the estimate varying .
from 0.25 for all private use to only 0.08 for inpatient use . The results without the Orme correction are not presented here but indicate a larger coefficient on the lagged term, so ignoring the initial conditions problem results in overestimation of the lagged effects. However, even with the correction term included, the estimated effects of lagged past private demand remain large in magnitude and highly significant for all three services.15
The results in Table 4 show that the patterns of association identified in the MNL estimates are not simply due to individual heterogeneity. Conditional on random individual effects, private sector use remains significantly associated with employment status, education, income, health status, political attitudes and past use of the private sector. The lack of importance of waiting list and NHS availability measures remains. Private use at time ty1 is a significant determinant of private use at t. Although from a different stochastic structure, the results can be compared to the private use columns of the MNL model in Table 2. This comparison indicates close similarity of most of the estimates, though the random
15
Two assessment of the goodness of fit of this model were made. The first was a comparison of the
Ž .
assumed parametric estimator the random effects probit estimator against a semi-parametric estimator
Žthe lowess estimator . This showed a close association between the two, suggesting robustness to the.
Ž .
()
The use of private health care services: random effects probit estimates with correction for initial conditions
Any service use Inpatient stay Dental visit
Ž . Ž . Ž .
dPrdx z-stat dPrdx z-stat dPrdx z-stat
Ž . Ž . Ž .
Private use ty1 0.20 25.3 0.059 7.6 0.37 32.0
Ž . Ž . Ž .
e0 0.25 15.7 0.086 3.1 0.18 11.5
Ž . Ž . Ž .
Social renter y0.08 8.3 y0.0042 2.6 y0.048 7.0
Ž .
Demographics age, household composition Included Included Included
Ž . Ž . Ž .
Self employed 0.07 4.3 y0.00075 0.5 0.040 4.5
Ž . Ž . Ž .
Employed 0.05 4.4 y0.0017 1.5 0.024 4.5
Ž . Ž . Ž .
Household income 0.0007 8.6 0.00005 4.0 0.0003 6.6
Ž . Ž . Ž .
H’hold income sq. y4.7ey07 4.4 y3.8ey08 1.9 y3.0ey07 3.3 Industry dummies, public sector employee Included Included Included
Health limits daily activity, health limits work, Included Included Included smoker, number of cigarettes smoked
Ž . Ž .
% RHA residents waiting)1 year y32.0 1.2 y2.26 0.9 –
Ž . Ž .
% RHA residents waiting-1 year 3.4 1.97 0.12 1.3 –
Ž .
Dental availability – – y0.00001 0.3
Ž . Ž . Ž .
Conservative party supporter 0.04 5.5 0.0014 1.4 0.020 5.0
Ž . Ž . Ž .
Disagree wr‘All health care should be free’ 0.013 4.1 0.0003 0.7 0.0087 4.1
Ž . Ž . Ž .
Disagree wr‘Unfair money buys priority’ 0.005 1.8 0.0011 2.9 0.0019 1.0
Regional effects Included Included Included
Ž . Ž . Ž .
Time effects Included ns Included ns Included ns Individual effects Included Included Included
Sample size 7004 7002 6947
Mean probability of private use 0.23 0.009 0.12
Ž .
Predicted probability at means 0.20 0.005 0.08
Ž .1 dPrdx is the probability of using private care. Derived for continuous variable by estimation of the partial derivative at means of all variables. For dummy variables
Ž .
effects probit model gives higher estimates of the marginal effect of past private use on current private use for both dental and inpatient services.16
6. Discussion and conclusions
Lack of available data has limited the statistical analysis of the determinants of the choice between public and private health care in the UK. Previous studies have looked only at private health insurance or used aggregate data. This study estimates a competing risks model of the health care alternatives open to a user of care in the UK using individual data. It is also the first study to examine the impact of past use using microdata. Use of private health care is found to be strongly determined by income, demographics, attitudes to the equity goals of the NHS, political allegiance, and past use. Users of private services are richer, more likely to support the political right, less supportive of the equity goals of the NHS and more likely to have used private care in the past than the rest of the population. A separate and significant contribution of each of these factors is identified.
There is strong evidence of association between past and present use of private health care, and between past and present use of NHS care. The past private use of one health service is positively associated with current private demand for another and the past use of an NHS service is positively associated with current use of another NHS service. There is also a cross-sectoral flow. Past use of the NHS is positively associated with present use of private services. The flow is not just one way out of the NHS. The past use of services in the private sector is positively associated with current public sector use. The estimated positive impact of past private use on current NHS use of dental services is larger than the estimated impact of past NHS use on current private use.
While these findings support the idea that the users of private services are an
Ž .
identifiable social group and so if examined cross-sectionally could be argued to constitute a ‘private welfare class’, when a longitudinal analysis is undertaken, the support for a private welfare class is less strong. The analysis does not support the idea that there is a group of users in the UK who move into the private sector and stay there. Instead, there is considerable movement between the public and the private sectors. Taking all the private services for which there is an NHS alternative together, public and private use appear complementary. For dental care, private and public care also appear to be complements. Only for inpatient stays, which individuals require infrequently and for which they may buy insurance, does there appear to be a group that predominantly uses the private sector. Even this
16
Ž group is unlikely to use only private care, as several inpatient services e.g.
.
accident and emergency services are not provided privately. Nor does support for the equity goal of the NHS appear to be linked most strongly to sector in which health care has been taken. Support for the equity goals of the NHS is strongest amongst non-users, and public and private users are closer to each other than to non-users.17
The results suggest that despite the recent growth in the use of private financed health care, there is perhaps not a distinct group of private service users who have completely opted out of the NHS. Instead, the use of private services appears to be complementary to the use of the public sector. Those who use one sector use the other, and those who use the private sector retain considerable support for the NHS. Such patterns have implications for the growth of private and public care in the UK.
Acknowledgements
I am grateful to the Data Archive for access to the British Household Panel Survey and to the Joseph Rowntree Foundation for funding. Tania Burchardt provided excellent data assistance and comments. Two anonymous referees helped to produce a much improved paper. My thanks are also due to Simon Burgess and seminar participants at the Universities of Bristol, Manchester, Essex and the LSE. All remaining errors are mine.
Appendix A
The model of interest takes the following form:
n)sgn qbX
x qyq´ , is1, . . . , N,ts1, . . . ,T
Ž
A.1.
i t i ty1 i t i i t
where n) is the latent use of private health care, x is a vector of individual
i t i t
characteristics, and yi an unobserved individual effect. The ‘initial conditions’ problem occurs where the initial observation, n , is correlated with the randomi0
Ž
error term yi because the start of the observation period does not coincide with
).
the start of the stochastic process generating ni t . To allow for this problem, Ž .
Heckman 1981 can be followed and a reduced form equation is specified for the initial observation:
n)slXz qh
Ž
A.2.
i0 i i
Ž . 2 Ž
where z is a vector of strictly exogenous instruments, vari hi ssh and corr yi,
17 Ž .
.
hisr . The next step involves a linear specification, in terms of orthogonal error components, to account for the possibility of non-zero r:
hisuyiq´i0
It is assumed the initial observation ni0 is uncorrelated with ´i t and also that
´i0 is uncorrelated with the xi t for all i and t. This model can be estimated but Ž .
requires that special software is written. Orme 1997 suggests a two-step method of estimation, in the spirit of Heckman’s standard sample selection correction method, which is an approximation in the case of small values of r. To account for the correlation between the initial condition and the unobserved heterogeneity
yi, a correction term is added to the model of interest. This can then be estimated using standard software for estimation of random effects probit models.
The first step of Orme’s two-step procedure involves probit estimation of Eq. ŽA.2 to generate this correction term, e , where. i0
ˆ
Xˆ
X ei0sŽ
2 ni0y1.
f lŽ
zi.
rFŽ
Ž
2 ni0y1.
lzi.
ˆ
andl is the MLE from the probit reduced form model. The second step involves Ž .
random effects probit estimation of Eq. A.1 augmented with the correction term
n)san qbX
x qde qyq´ , is1, . . . , N,ts1, . . . ,T .
i t i , ty1 i t i0 i i t
The new error term that enters the random effects probit estimation is het-Ž .
eroskedastic. But Orme 1997 shows that, from Monte-Carlo results, it is not necessary to worry about this heteroskedasticity, producing inconsistent parameter estimates in the case of small values of r.
References
Besley, T., Hall, J., Preston, I., 1999. The demand for private health insurance: do waiting lists matter?
Ž .
Journal of Public Economics 72 2 , 155–181.
Burchardt, T., Hills, J., Propper, C., 1999. Private Welfare and Public Policy. York Publishing Services for Joseph Rowntree Foundation, York.
Burchardt, T., Propper, C., 1999. Does the UK have a private welfare class? Journal of Social Policy
Ž .
28 4 , 643–665.
Calnan, M., Cant, S., Gabe, J., 1993. Going Private: Why People Pay for their Health Care. Oxford University Press, Oxford.
Cutler, D., Gruber, J., 1996a. Does public insurance crowd out private insurance? Quarterly Journal of Economics 111, 391–430.
Cutler, D., Gruber, J., 1996b. The effect of medicaid expansions on public insurance, private insurance and redistributions. American Economic Review 86, 378–383.
Goddard, J.A., Malek, M., Tavakoli, M., 1994. An economic model of the market for hospital
Ž .
treatment of non-urgent conditions. Health Economics 4 1 , 41–56.
Heckman, J.J., 1981. The incidental parameters problem and the problem of initial conditions in
Ž .
estimating a discrete time-discrete data stochastic process. In: Manski, C.F., McFadden, D. Eds. , Structural Analysis of Discrete Data with Econometric Applications. MIT Press, Cambridge, pp. 114–178.
Hsiao, C., 1986. Analysis of Panel Data. CUP, Cambridge.
Klein, R.W., 1993. Specification tests for binary choice models based on index quantiles. Journal of
Ž .
Econometrics 59 3 , 343–375.
Lindsay, C., Feigenbaum, B., 1984. Rationing by waiting list. American Economic Review 74, 404–417.
MacAvinchey, I., Yannopolous, A., 1993. Elasticity estimates from a dynamic model of interrelated demands for public and private health care. Journal of Health Economics 12, 171–186.
Martin, S., Smith, P., 1998. Modelling waiting times for elective surgery. Journal of Public Economics 71, 141–164.
Orme, C., 1997. The Initial Conditions Problem and Two-Step estimation in Discrete Panel Data Models. Department of Economic Studies, University of Manchester, UK.
Papadakis, E., Taylor-Gooby, P., 1987. The Private Provision of Public Welfare: State, Market and Community. Wheatsheaf, Brighton.
Propper, C., 1989. An econometric analysis of the demand for private health insurance in England and
Ž .
Wales. Applied Economics 21 6 , 777–792.
Propper, C., 1993. Constrained choice sets in the UK demand for private medical insurance. Journal of
Ž .
Public Economics 51 3 , 287–307.
Propper, C., 1995. The disutility of time spent on NHS waiting lists. Journal of Human Resources 30
Ž .4 , 677–701.
Propper, C., 1998. Private Demand and Public Provision: The Case of Health Care in the UK. Department of Economics, University of Bristol, mimeo.
Schmidt, R., Strauss, W., 1975. The predictions of occupations using multiple logit models.
Interna-Ž .
tional Economic Review 16 2 , 471–486.
Taylor-Gooby, P., 1989. The politics of welfare privatisation: the British experience. International
Ž .