www.elsevier.nlrlocatereconbase
Mental health: market power and governance
Julien Forder
)Personal Social SerÕices Research Unit, London School of Economics and Political Science, Houghton Street, London WC2A 2AE, UK
Received 2 December 1998; received in revised form 5 November 1999; accepted 1 February 2000
Abstract
This paper is concerned with the pricing behaviour of providers of residential care for people with mental health problems. Two aspects of pricing were considered. First, are
Ž
there differences between providers’ market power and their actual mark-up rates e.g. due
.
to differences in motivation ? Second, do the different governance arrangements used in sectors of the industry, such as unified public and non-profit organisation and private bilateral contracting, affect pricing behaviour? A theoretical model was developed to underpin the empirical analysis of 496 residents in 112 mental health care facilities. Private, bilateral organisation was found to be associated with comparatively lower potential price-cost mark-up but a greater propensity to use this power to make profitsrsurpluses.
q2000 Elsevier Science B.V. All rights reserved.
JEL classification: L11; I11; L22
Keywords: Mental health care; Motivation; Pricing behaviour; Market power; Governance
1. Introduction
Residential care services for people with mental health problems are provided by a mix of public, voluntary and private organisations. The first two types have been traditionally dominant providers. However, since the beginning of the 1980s, Government policy regarding residential care has created renewed incentives for
)Tel.:q44-171-955-6173; fax:q44-171-955-6131.
Ž .
E-mail address: [email protected] J. Forder .
0167-6296r00r$ - see front matterq2000 Elsevier Science B.V. All rights reserved.
Ž .
Ž .
the use of the private for-profit sector and, to some extent, the voluntary sector. This policy reform enabled a substantial proportion of public money to go to the independent sector. It encouraged the use of market forces, moving social care away from public bureaucratic arrangements. The growth of state-funded private sector provision was dramatic. The implementation of quasi-markets is the central feature of social care policy changes in the last decade. Much of its impetus is attributed to the New Right policy rhetoric concerning the efficiency raising
Ž
virtues of markets Le Grand and Bartlett, 1993; Wistow et al., 1996; Bartlett et
.
al., 1998 . This paper seeks to address these claims of the virtues of markets as they have been applied, in practice, to social care.
The paper focuses on the pricing behaviour of providers of residential care for people with mental health problems. The analysis looks first at provider market
Ž .
power potential price-cost mark-up and actual mark-up rates and whether they
differ. Second, the non-profit and for-profit sectors of the industry are compared according to these performance indicators. The first part of the analysis concerns provider motivation and questions whether all organisations in the industry are profit maximisers in the sense of using all their market power to secure the highest level of profit. The second allows us to comment on comparative efficiency of non-profitrpublic forms of organisation compared to the private ‘for-profit’ form of the conventional market.
The paper has the following structure. In the remainder of the introduction a brief description of the prevailing demand, supply and governance of mental health care market is provided. In Section 2 the theoretical framework is devel-oped to underpin the empirical investigation of market power. Section 3 has the empirical estimations; Section 4 is the discussion and Section 5 has conclusions.
1.1. The mental health care market
During the late 1980s, the private sector became the largest single supplier in the mental health care industry. Fig. 1 shows the number of places in the
Ž
residential care market between 1983 and 1996 Department of Health statistics,
.
1997, RAC5rSR1; Laing and Buisson, 1998 . Fig. 2 shows this information as market shares by sector. The rapid absolute and relative growth of the private sector is clearly demonstrated.
Ž .
Regarding market contestability Baumol et al., 1982 , various legal constraints exist to regulate entry, such as, the requirements laid out in the Registered Care
Ž .
Homes Act 1984 . Attainment of registration to provide mental health care
services involves meeting minimum standards relating primarily to: the architec-ture of the care home, the ‘fitness’ of the manager and owner to run the facility; and to the qualifications and numbers of staff. The registration process is relatively
Ž .
Fig. 1. Residential care for people with mental health problems — numbers of places.
address accommodation needs and therefore resource input costs are relatively low and constitute a modest barrier to market entry. Patient’s needs are often complex, uncertain and variable, and these people can be very vulnerable. The ‘technology’ of care therefore needs labour inputs that are reliable, consistent and have considerable acquired expertise, especially with respect to the more specialised and challenging care needs. Costly investment in labour training may then lift entry barriers. A provider’s reputation for quality and competence can be a powerful remedy for the informational problems but may also act as a significant
Ž
entry barrier that gives established providers market power see Milgrom and
.
Roberts, 1982; Kreps and Wilson, 1982; Forder et al., 1996 .
On the demand side of the market around 40% of placements utilise public money in the form of income support payments. Public funding also operates via
Ž
local authorities and health authorities who purchase care on behalf of
individu-.
als . Another 40% of placements are of this type. Most of the remaining 20% are
Ž .
individuals funding and buying care using their own resources. Knapp et al. 1997 report a recent north London study indicating that 49% of the funding of voluntary sector residential accommodation came from the NHS and 38% from social security payment. The equivalent proportions for private sector facilities were 12% and 84% respectively.
1.2. GoÕernance arrangements
Drawing on the economics of organisation literature, two broad methods of
Ž
()
J.
Forder
r
Journal
of
Health
Economics
19
2000
877
–
[image:4.842.161.530.125.292.2]905
1975, 1985, 1996; Milgrom and Roberts, 1990, 1992; Kreps, 1996; North, 1990;
.
Swedberg, 1994 . The first is characterised by an environment of dispersed property and control rights between purchaser and provider and where high power incentives apply — broadly a market-like governance structure. Williamson defines high-powered incentives with reference to a stakeholder who has residual claimant status, that is, a stakeholder whoAappropriates a net revenue stream, the gross receipts andror costs of which stream are influenced by the efforts expended
Ž .
by the economic agentB Williamson, 1985, p. 132 .
Private sector placements in the study are arranged almost exclusively within this market governance structure. Individuals either purchase care themselves from
Ž .
providers bilateral arms-length relationships or have a purchasing agent act on
Ž .
their behalf trilateral arms-length relationships . Currently, prices are agreed before placement and rather immutable thereafter; incentives are invariably high powered therefore in the above sense. Placement decisions are made by purchasers and care decisions by providers. Indeed, effective integrated decision-making,
Ž
although often welcomed by stakeholders, is not characteristic see Wistow et al.,
.
1996; Lewis and Glennerster, 1996 .
The second broad governance arrangement has providers operating in a much more highly Õertically integrated environment, with purchasing and providing
functions unified under central control and with hierarchical decision-making. Providers in this second group are generally not residual claimants — as argued below — and so incentives tend to be low powered. The public social care bureaucracy clearly falls into this category. Also, much of the voluntary sector is organised such that purchaser and provider collaborate closely, with placement
Ždemand and service decisions being largely integrated. It is assumed that in the.
main the voluntary sector approximates closely to hierarchical arrangements. Despite dispersed ownership, decision-making is effectively integrated and incen-tives are low powered; in practice, much of provider reimbursement is by open-ended, non-specific grant arrangements and close partnership is the norm
ŽKendall and Knapp, 1996 ..
Employing this two-way categorisation means that all placements with volun-tary and local authority providers are considered hierarchical — the non-profit group. All placements with private providers are treated as secured under market arrangements — the priÕate group. Economic organisation theory would suggest
quite different implications for pricing and price-cost mark-up by these two groups.
The first implication is that the non-profits group in our sample will have a low propensity to use its market power to make profit. Unified governance structures
Ž .
generally have low powered incentives for institutional reasons see Miller, 1992 and also legal reasons, such as non-distribution of profits and fair compensation rules in the voluntary sector, and also in the public sector. Furthermore, people
Ž .
Ž
these organisations for example, see the entrepreneurial sorting theories of Eckel
.
and Steinberg, 1994; Bilodeau and Slivinski, 1996 .
The second implication is that providers operating with unified governance will have relatively high ‘market power’ or influence following Milgrom and Roberts
Ž1990 . The supporting arguments from the economics of organisation literature.
refine standard market failure theories; in particular those concerning barriers created by asset specificity and sunk costs, and the opportunities to exploit information imperfections. Indeed, this second implication is complementary to the first. Arrangements that offer low-powered incentives, non-rent-seeking mo-tives and unified structures are most likely to minimise net transaction costs under those circumstances that create market power, i.e. specific assets and poor
Ž .
information Coase, 1937 .
We have two empirical hypotheses. First, given the described demand, supply and governance arrangements, particularly the large number and high diversity of purchasers and the relatively low entry and exit barriers, average market power for the whole sample is expected to be relatively low. Second, we expect the
non-profit sector providers to face lower elasticity of demand for their products,
i.e. to have higher ‘market power’, but also to have a lower propensity to use market power to make profits.
2. Theory
This section describes the formal underpinning for the empirical investigation in Section 3. An appropriate model for the market as described is one of imperfect competition with a large number of providers. Behaviour is assumed to be oligopolistic with heterogeneous products, but we make no a priori assumptions about the nature of competitive interaction of providers. Indeed, the aim is not to consider market equilibrium per se but rather to calculate market power as it currently prevails in the sample market. A parameter li j is assumed to describe the conjectures of the ith provider with each other provider j. We do not make the assumption that the market is symmetrical: firms can have different cross-price elasticities with the other ny1 firms in the market.
Ž
A general imperfect competition model with product differentiation Bresnahan,
.
1989 of the following type is used. Consider a market with n providers of residential care. To be clear about market power at the provider level we start with the case where each provider supplies one service. Later we develop the model to allow providers to sell more than one product.
Ž .
Demand in inverse form for the service 1 is:
P1sh1
Ž
x , x , . . . , x , y ;1 2 n 1 s1.
Ž .
1where, P is the service 1 demand price, x to x are the demands faced by the n1 1 n servicerproviders in the market, y1 are demand shift variables and s1 is the
Ž . Ž .
js2 . . . n is made. Buyers are assumed to be distributed throughout the market according to their tastes for each care product.
The partial derivative, Eh1rEx , indicates how provider 1’s demand changes1 Ž
when the prices of all other providers are kept constant the Nash-in-quantity case
.
or Cournot case . However, to allow more general specification of provider conjectures we can be explicit about the dependence of the other providers’ demands on provider 1’s demand:
P1sh1
Ž
x , x1 2Ž
x1.
, . . . , xnŽ
x1.
, y ;1 s1.
.Ž .
2Allowing x , . . . , x to vary, the total derivative of provider 1’s price with regard2 n
Ž .
its demand excluding changes in the exogenous variables is:
n n
d P1 EP1 EP1 Exj EP1 EP1
s q
Ý
s qÝ
lj1Ž .
3d x1 Ex1 js2Exj Ex1 Ex1 js2Exj
Ž .
where lj1 is the conjectural variation. In the Bertrand price competition case each provider expects its rival’s price to remain constant for changes in its own
Ž . ŽŽ . Ž ..
price. Then, with P xj 1 sconst, we have: lj1s y EPjrEx1 rEPjrExj . Clearly, then, the direct demand effect Eh1rEx can differ from the total effect.1
Provider 1’s residual price differential — the relationship between its price and demand net of responses of other providers — is dependent on that provider’s conjectures about the other providers. This perception is, therefore, an element of the provider’s optimal price function. Indeed, it is the residual price differential that we wish to determine because such an estimate would encompass the effects of competitive interaction as it prevails in the sample market. It tells us about provider market power, which we turn to next.
To proceed in the derivation of the provider’s optimal price function we need to be explicit about provider objectives and cost functions. We assume that average costs have the usual U-shape, albeit with relatively small increases in marginal
Ž
costs beyond minimum average cost scale because both the capital mainly
. Ž
property and labour inputs are quite divisible for the industry see Darton and
.
Knapp, 1984 . We write the cost function as:
CisC x
Ž
iŽ .
x ,w, r , z , y ,i i i ui.
Ž .
4where w is the prevailing price of labour, r is the price of capital, z is a vector ofi
cost shift variables such as client dependency levels, where this indicates the level of care required and is thus correlated with total costs. Also, x is capacity andi
assumed to be a function of x ; differences between x and x might reflecti i i
uncertainty about future levels of demand. The elements of the vectorui are the unknown parameters of the cost function.
Ž .
the care home price covers the cost of the marginal resident . Suppose, in
particular, that providers are profit maximisers with probability a and thus
Ž .
marginal cost pricers with a probability of 1ya . Profit maximisers have the
usual profit function:
pisP xi
Ž
i.
xiyCiŽ
x .i.
Ž .
5The first order condition is:
ny1
ECi EPi EPi
Pi
Ž
as1.
sŽ
x ,w, r , z ,i i ui.
yž
qÝ
lji/
PxiŽ
P , y ,i si.
Ž .
6Exi Exi j/iExj
where P is the vector of all providers prices. Providers either set price as in Eq.
Ž .6 with probability a, or at P1sc with probability 11 Ž ya.. The motiÕations
parameter, 0FaF1, measures the average propensity of providers to use market power to make profit. It is assumed to be exogenously determined, and not directly observable, although it is taken to vary for different identifiable sub-sections, s, of the industry, namely, between the private and non-profit sectors of the industry, respectively, ssr, y in as. Above we hypothesised that non-profit providers were mainly operating with unified governance and are expected to have a lower
Ž .
value of a than private providers see Section 1 .
The expected pricing rule for a given provider i in market segment s is therefore:
ECi d Pi
Pis
Ž
x ,w, r , z ,i i ui.
yasP PxiŽ
P , y ,i si,as.
Ž .
7Exi d xi
Ž . Ž .
Overall, then, Eq. 7 indicates that a provider’s expected price setting will
Ž . Ž . Ž .
depend on i the extent of product differentiation y ,i ii the conjectural
Ž . Ž .
variations parameter lji , and also iii on the value of motivations parameter
Žas..
Ž .
Undertaking a direct estimation of Eq. 1 in order to determine the ‘perceived’
Ž .
price differential d Pird x of Eq. 7 presents considerable practical difficultiesi
when, as in our case, the number of own- and cross-elasticities is very large.
Ž .
However, progress can be made instead by using the Baker and Bresnahan 1985 approach, which involves removing the dependence of the other ny1 provider’s prices on the demand function of a representative provider.
For notational convenience we will denote the representative or mean provider in a given market segment s as provider 1. Hence, the other firms are js2, . . . , n.
Ž . Ž Ž .. Ž .
Using the ny1 inverse demand equations Eq. 2 and the ny1 supply
Ž Ž .. Ž .
equations Eq. 7 we can solve for ny1 prices and outputs. The resultant
Ž .
functions can be solved simultaneously to remove the dependence on the ny1
Ž .
substituted for its reduced form in terms of the pre-determined variables. This manipulation generates, for each service j/1:
xjsEj
Ž
x , x ,w, r , z , y ;1 1 1 1 as,lj,sj,uj.
.Ž .
8Ž . Ž .
Following Baker and Bresnahan’s 1985 formulation, for each of the ny1
providers j/1 the differential of E with respect to xj 1 is firm j’s reaction
Ž . Ž . Ž .
function to provider 1 . Eq. 8 defines a reduced form equation for i/1
Ž . Ž .
written in terms of provider 1’s output x1 and characteristics y . These optimal1 demands can then be substituted into the inverse demand function to give the equation to be estimated:
P1shi
Ž
x , E x , x ,w, r , z , y ;iŽ
1 1 1 1 a,l,s,u.
, y ;1 s1.
Ž .
9R
shi
Ž
x , x ,w, r , z , y ;1 1 1 1 a,l,s,u.
where E is the vector of optimal demands for each provider j. This function is the residual demand curve for product 1. The elasticity of hR with respect to x tells1 us about the market power provider 1 has over its price, taking into account the
Ž .
adjustment of all other providers’ prices and quantities Bresnahan, 1989, p. 1049 . Specifically,
d P EhR
i 1
'
Ž
10.
d x1 Ex1
Ž Ž ..
which can be substituted directly into the optimal price function Eq. 7 and is a key component in determining price-cost margins. It remains to show how
EhRrEx can be estimated.
1 1
Thus far we have discussed the single product case; we now move on to consider multiple outputs. Each provider i is assumed to supply xi products or care ‘services’. The defining characteristic of a service is the care received by an individual. Therefore, the potential number of different services supplied by a provider is equal to the number of residents. To use a general formulation, each
ms1, . . . ,xi refers to an individual service, where xiFx and each price is P .i m i
The demand for service m can be written as x , which is conceived as them i
number of service m beds sold. With this notation, the inverse demand for each
Ž .
service is, with direct analogy to Eq. 9 ,
R
Pm1shm1
Ž
xm1, x ,w, r , z , y ;1 1 1 a,l,s,u.
.Ž
11.
Data limitations mean that we do not have values for the xm i terms. We can
proceed, however, by drawing on the relationship between each xm i and x , thei number of places sold by each provider: xisx1 iq. . .qxx1i. On average, there-fore, xjisxirxi. Thus, we estimate the following function across the sample of prices Pm i for all is1, . . . , n providers in the dataset:s
R 1
We are, nonetheless, interested in mark-up levels as they apply to providers. We can then define the average mark-up level using the residual demand price functions as:
x1
P
Ý
m1Ž
hR 1Ž
x.
q. . .qhR 1Ž
x.
.
11 1 1x 1
ms1 1
P1s s .
Ž
13.
x1 x1
Now differentiating we have:
R 1 EhR 1
x
d P1 Eh11
Ž
x1.
1x1Ž
1.
x1 s q. . .q .
Ž
14.
d x1 Ex1 Ex1
If the provider sold identical products such that:
R 1 EhR 1 x R 1
Eh11
Ž
x1.
1x1Ž
1.
Eh1Ž
x1.
s. . .s s
Ž
15.
Ex1 Ex1 Ex1
Ž . RŽ . R1Ž .
then Eq. 14 becomes d P1rd x1' Eh1 x1 rEx1sEh11 x1 rEx1s . . .s
R1Ž . Ž .
Eh1x1 x1 rEx1 which is equivalent to Eq. 10 , the price differential in the single-product or provider level case.
Ž .
Suppose that the equivalent of Eq. 12 was derived for all other providers
is2, . . . , n. The empirical model is then:
Pm isb0qb x1 iqb w2 qb r3 qb z4 m iqb y5 m iqb x6 iqum i
Ž
16.
R1 Ž R1 .Ž .
where the estimated coefficient on output is b1' Eh rExi' Eh rExm i 1rxi .
Ž . Ž .
This model is estimated cross-sectionally across a sample of all potential services from each sample of providers. As the potential number of services is the number of residents, the sample frame is equivalently a sample drawn from all residents, G, in the market.
Ž .
Eq. 16 can be re-written as:
EhR 1
m i
Pm isBm i
Ž
w, r , zm i, y ,um i m i.
q xm i.Ž
17.
Exm i
Adding the demand for each service we get the provider level demand:
P yB
P1 iyB1 i xii xii
xis EhR 1 q. . .q EhR 1 .
Ž
18.
m i m i
Ex1 i Exxii
Now if demand and prices for each provider’s services were identical and we write
Ž .
provider-level price as the average of each service price: Pis P1 iq. . .qPxii rxi, then the inverse provider-level demand function is:
xi B EhR 1 1
m i m i
Pis
Ý
q x .iŽ
19.
Differentiating we have:
d P EhR 1 1
i m i
s 'b .1
Ž
20.
d x1 Exm i xi
Therefore, if each provider’s products are similar then the estimated parameter b1 Ž Ž ..
of the residents-level model Eq. 16 is approximately equal to the residual price differential at the provider level. In regard to costs, each service will have potentially different marginal costs, c , due to any differences in cost shiftm i
factors. However, marginal costs at the service level are assumed to be constant. Cost inefficiency — assumed to be a constant shift factor — is conceived as part of the organisation’s surplusrprofit. Thus, whilst accounting mark-up may be
Ž . Ž .
Piyc
˜
i the latter term is observed marginal cost , economic mark-up is Piyc˜
iŽ .
q c
˜
iyci sPiyc .i2.1. Market power
Ž .
We can re-arrange Eq. 7 as follows:
Piyci d Pi xi X
s yasP P s ya bs
Ž .
7Pi d xi Pi
Ž .
where, as with P , the term c is the average of the minimum efficient marginali i
costs of each service. This expression leads to our definition of market power:
Ž . 1
Mis Piyci rPis yb, that is, the mark-up of a profit maximising provider. Market power is then dependent only on the elasticity of price with respect to output of the residual demand function, i.e. b.
Ž Ž ..
The model Eq. 16 can be estimated in log form, in which case the parameter
L Ž . L
on x , is bi 1'b P1 irx . Thus, the estimated parameter bi 1 of the residents-level model is equivalent to the residual price elasticity at the provider-level from Eq.
Ž20 , which is in turn our measure of market power at the provider-level from Eq.. Ž Ž X
.. Ž .
7 . In notation, extending Eq. 20 this is:
P1 d P Pi 1 X
L
b1'b1 ' 'b.
Ž
20.
x1 d x1 x1
Ž .
This functional form for Eq. 16 is somewhat arbitrary and it does present some
Ž .
difficulties in estimation in the presence of heteroscedasticity see below .
How-1
It is important to note that even if the market was inhabited solely by profit maximising firms, the estimate of prevailing market power,b, is not necessarily the maximum level of market power. The maximum market power in our model would occur only when firms are both profit maximisers and can
Ž .
Ž
ever, there is considerable precedent for its use in studies of this kind see
.
Bresnahan, 1989 and it does have a very useful advantage. Specifically, in Eq.
Ž X.
7 market power is dependent only on the point elasticity estimate — elasticity is
constant along the demand curve. Removing the dependence of xi is very
convenient because x is a function of the unknown parameteri as: we do not know where on its demand curve a provider will be. Indeed, the output level of a profit maximiser will be lower than a marginal cost pricer.
The cross-sectional estimate bL'b can be interpreted as the market power of
1
the ‘sample mean’ provider. It represents the average market power that best fits the sample: actual sample providers may have market power that differs from this value.
2.2. MotiÕation
Actual mark-up rates will depend on the value of as the motivation parameter.
However, we do not have an observable value for as and therefore we cannot
estimate a point value of actual mark-up. Instead, we determine whether actual mark-up is different from zero and then develop this further to estimate a range of actual mark-up values. We draw on our assumption that motivation is partly
Ž .
determined by the characteristics of the provider: assa y to make these
estimates. In particular, we distinguish between the private and non-profit
sub-Ž . Ž .
samples see Section 1 . The estimate of the representative mean provider’s
Ž X
.
mark-up in each of these sub-sectors of the market is analogous to Eq. 7 :
Pigsycigs Y
s ya bs s, ssr,y
Ž .
7Pigs
where price and marginal cost are the provider mean values. For notation at convenience, Pigs will be written as P and P for each s and similarly forr y
marginal cost. Thus, we write:
Prycr
s ya br r
Ž
ar.
Ž
21.
Pr
and
Pyycy
s ya b ay y
Ž
y.
.Ž
22.
Py
These functions can be combined by subtracting one from the other to give:
PryPyycrqcyqa br rPrya by yPys0.
Ž
23.
Ž
differences in the level of mark-up which is a function of ay and ar,
respec-.
tively . Indeed, it provides an estimate of the relationship between ay and ar:
PryPyycrqcy brPr
ays q ar.
Ž
24.
byPy byPy
Ž .
To derive this relationship we need to estimate the value of cyycr and for this we use a three-stage methodology. The first step is to estimate a reduced-form price equation using only the private sector organisations sub-sample. Using Eqs.
Ž .7 and 12 the reduced form equation is:Ž .
P shR 2
Ž
w , r , y ;a ,l ,u ,s ,s.
Ž
25.
k k r r k r r r r k
where each k is a priÕate sector service sold and the subscript r on each vector
denotes that only private sector providers comprise its elements. Our stochastic approximation is:
Pksd0qd1wrqd2rrqd3ykqyk.
Ž
26.
The estimated parameters of this equation will only embody private sector supply relationship and so preserve the effect of private sector motivations.
Second, we ‘cross-predict’ a hypothetical private sector price using the esti-mated parameters from the reduced-form estimation and the mean values of the exogenous variables drawn only from the sub-sample of non-profit sector providers
Žw , r , y ,y y y.
y
Prsd0qd1wyqd2ryqd3yy
Ž
27.
where the superscript denotes that price is derived using non-profit sector charac-teristics.2 In this way, the price function estimated in Table 3 is applied only to the non-profit sector sub-sample in order to generate a predicted private sector price given non-profit sector characteristics.
The third step is to estimate the elasticity of demand of the ‘sample mean’
Ž .
provider in the non-profit sector and in the private sector. An interactive slope dummy as well as an intercept dummy for sector is employed. The modified
Ž .
version of Eq. 16 is thus:
X
1 2 1
Pm isb0qb x1 iqb1rxiqb w2 qb r3 qb z4 m iqb y5 m iqb x6 1qb7rqum i
X 16
Ž
.
where r takes a value of 1 for private sector providers and 0 otherwise. Thus, we can define the private sector elasticity as d P rd x N sb1qb2sb , and the
m i i rs1 1 1 r
non-profit elasticity as: d P rd x N sb1sb .
m i i rs0 1 y
2 Ž .
The underlying private sector supply relationship is preserved and, using our new terminology, can be written:
Pryycy y
s ya br r
Ž
28.
y
Pr
where by is the elasticity of the demand for this organisation. In supposing that r
this hypothetical private sector provider has the product characteristics of the average non-profit sector provider, then it will also have a non-profit sector demand function. The level of demand will be different because private sector providers would charge a higher price for the same service. But, given our constant elasticity demand function, we can assume that by
sb . We can now
r y
advance the following lemma.
y ( )
Lemma 1. GiÕen that Pr)Py)0 and by-0 which are estimated below , the
expectedÕalue of a for the whole market is greater than zero.
Proof. By contradiction we show that arsays0 cannot exist.
Ž . Ž .
Subtracting Eq. 28 from Eq. 21 gives:
cyycrsPryyPrya br rPrqa br rPry
Ž
29.
Ž .
which can be substituted into Eq. 23 :
PryyPyqa br rPryya by yPys0
Ž
30.
or
PyyP Py
r y r
ays qar .
Ž
31.
byPy Py
y Ž
Hence, when ays0 we have ay/0 if Pr)Py)0 and by-0 i.e. because
.
potential mark-up is greater than zero from the estimation. I
This lemma implies that the expected value of a for the whole market must be different from zero.
2.3. Estimates of actual mark-up
Ž .
A whole range of values of ar and ay could have generated our estimated
y y Ž .
values of P , Pr and bs ar,ay , ssr,y. To begin with, suppose that the underlying pattern of motivation is such that non-profit organisations are exclu-sively marginal cost pricers. If this set of motivations was the case then the
estimated parameters b , Py and P would be those generated with a s0 and
y r y y
Ž .
for-profit motivation calculated from Eq. 31 :
PyPy
y r
0
ars b Py .
Ž
32.
y r
Here the superscript on a0
is the assumed value of non-profit motivation used to
r
derive for-profit motivation. Thus, we have removed the dependence of ay in
calculating the limit value of private sector motivation. Given our assumption that
ay-ar we have a minimum value for ar, which can be calculated from our
estimates.
The alternative case is where the underlying motivation is that all private providers are profit maximisers. What are the implications of this set of motiva-tion, corresponding to our estimated parameters, by, Pry and P ? Theny ars1 by
Ž .
construction and Eq. 31 gives the associated value for non-profit motivation:
Pry PyyPry
1
ays y
Ž
33.
Py byPy
which is the maximum value of non-profit motivations. These calculations give us
w 04 1 4x
two sets of hypothetical limit values ays0, arsar , aysa , ars1 which can be used, respectively, to calculate the lowest and highest possible values of
Ž .
mark-up using our estimates . We can then compare private and non-profit
providers on the basis of both market power and actual mark-up. The latter is
Ž
appropriate for estimating comparative allocative efficiency Boadway and Bruce,
.
1984; Ng, 1982 .
3. Empirical investigation
Following the above discussion our intention is to estimate the model in Eq.
Ž X.
16 . Three issues need to be addressed. First, what constitutes an observation for the cross-sectional analysis and what data are used? Second, what is the
specifica-Ž X.
tion of empirical variables to proxy the terms in Eq. 16 ? Third, we need to
Ž X. account for the endogenous variables, price and output, of Eq. 16 .
3.1. The sample data
Ž .
English and Welsh services Lelliott et al., 1996 . Eight health districts were
Ž
selected from those expressing readiness to participate in the study two inner city areas in London, two suburban areas and four rural areas; seven English and one
.
Welsh . The selection was made by the Royal College of Psychiatrists Research
Ž .
Unit CRU on the basis of population size, population density and Jarman’s
Ž1993 underprivileged area score Chisholm et al., 1997 .. Ž .
All facilities known in these areas with residents with a long-standing
func-Ž
tional illness as their principal client group thereby excluding nursing homes for elderly people, facilities for people with learning disabilities and hostels for the
.
homeless were contacted. These facilities could be managed by any agency
ŽNHS, local authority, private or voluntary sector . Information about the facility.
was collected by interview with the facility manager. Data was also collected about all residents aged between 16 and 65 with mental illness by interviews with key workers. This data gathering was conducted between 31 March 1994 and 31 August 1994 and included a dedicated collection of service and other cost-relevant information.
The original study included all facilities providing accommodation for people with mental health problems. This paper is only concerned with facilities managed by agencies other than the NHS and thereby excluded acute psychiatric hospital wards, long-stay psychiatric wards and Forensic units. A number of low-staffed
Ž
group facilities were also excluded, being out of the remit of this study see
.
Lelliott et al., 1996 . The original study census found an eligible population of 1138 residents in 215 facilities. Residents in the private and voluntary sector facilities for which price data were available were included in the analysis. For local authority homes ‘prices’ were constructed from accounts information and other data sources.
The starting sample size was 496 residents with valid price data, who were residing in 112 facilities. Thus, price data were available for 44% of the eligible resident population and 52% of the facility population. Altogether, of the 496
Ž
cases, 38 cases were residents in 11 local authority facilities but 10 of these cases
.
had some element of missing data other than financial data , 426 were in 89
Ž .
for-profit facilities 9 cases with some missing data and 32 residents were in 12
Ž .
voluntary sector facilities 0 missing cases . As might be expected, losses in cases due to missing price data were higher for the local authority and voluntary sectors
Žsee Discussion ..
The data also indicate that providers differentiate prices between beds in their facilities. Of the 112 providers in the sample, 82 had more than one sample
Ž .
resident. Of these 82 providers, 28 34.15% had prices differentiated across the sample residents in the home. The greatest difference between the highest and lowest sample price among the survey providers is £58.
Ž .
Output levels per provider number of beds sold are significantly different
Ž .
according to sector, with non-profits being on average 75% larger p-0.01 . Size is often regarded as an important demand factor, and as such would be another source of product differentiation between providers.
3.2. Specification
The proxy variables collected in the survey that were used to generate an empirical specification of the theoretical model are described in Appendix A. Descriptive statistics are given in Table 1b.
A number of exogenous demand and cost shift factors are listed. The demand for a place in a facility and the marginal cost of that place are hypothesised to be affected by the provider’s serÕice characteristics. Included were factors such as
Ž . Ž
night nursing cover ‘no night cover’ , staffing intensity ‘low staffed home’ and
.
‘low staffed sleep-in’ and services that cater for people with physical disabilities
Ž
and those with alcohol misuse problems variables respectively, ‘physical
disabili-.
ties’ and ‘alcohol misuse’ . These variables allow account to be made of market
Ž .
segmentation according to service characteristics Eaton and Wooders, 1985 . Demand may also be differentiated according to the facility’s client profile, but perhaps only in terms of easily observable factors such as age and sex.
The level of demand for a bed is also likely to be influenced by facility
characteristics, in particular, the proportion of single rooms, bathrooms,
commu-nal living areas and staff areas. These factors are also expected to have a bearing on costs through their effect on the capital inputs required.
In Section 1 we argued that provider sector, in reflecting governance
arrange-Ž X
.
ments and provider motivation, affects demand. Explicit in Eq. 16 is the
assumption that sector has a demand price effect not only as a shift of the curve but also on the slope of the demand curve. We hypothesise that private providers have more elastic demand. As a result we would expect a negative coefficient, b11
Ž X. 2
in Eq. 16 , but a positive coefficient, b on the interaction term.1
In addition, the different strategies, intentions and financial means of
pur-Ž .
chasers purchaser’s preferences were expected to have a bearing on demand. As a significant proportion of demand is expressed by local authority purchasers on
Ž
behalf of clients and because the areas in the sample vary especially in terms of
.
income and deprivation , area dummies were used to capture this effect. The eight
Ž . Ž .
areas comprised two London urban areas, two Southern country rural areas,
Ž .
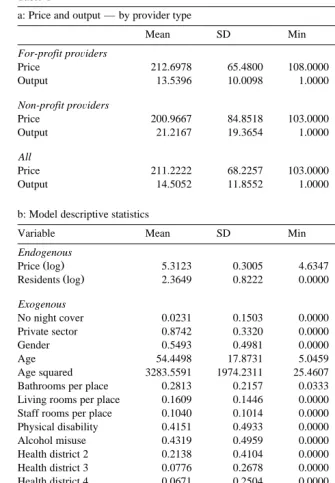
Table 1
a: Price and output — by provider type
Mean SD Min Max n
For-profit proÕiders
Price 212.6978 65.4800 108.0000 481.0000 417
Output 13.5396 10.0098 1.0000 47.0000 417
Non-profit proÕiders
Price 200.9667 84.8518 103.0000 650.0000 60
Output 21.2167 19.3654 1.0000 54.0000 60
All
Price 211.2222 68.2257 103.0000 650.0000 477
Output 14.5052 11.8552 1.0000 54.0000 477
b: Model descriptive statistics
Variable Mean SD Min Max Cases
Endogenous
Ž .
Price log 5.3123 0.3005 4.6347 6.4770 477
Ž .
Residents log 2.3649 0.8222 0.0000 3.9890 477
Exogenous
No night cover 0.0231 0.1503 0.0000 1.0000 477
Private sector 0.8742 0.3320 0.0000 1.0000 477
Gender 0.5493 0.4981 0.0000 1.0000 477
Age 54.4498 17.8731 5.0459 93.8508 477
Age squared 3283.5591 1974.2311 25.4607 8807.9707 477
Bathrooms per place 0.2813 0.2157 0.0333 1.0833 477
Living rooms per place 0.1609 0.1446 0.0000 1.0000 477
Staff rooms per place 0.1040 0.1014 0.0000 0.5000 477
Physical disability 0.4151 0.4933 0.0000 1.0000 477
Alcohol misuse 0.4319 0.4959 0.0000 1.0000 477
Health district 2 0.2138 0.4104 0.0000 1.0000 477
Health district 3 0.0776 0.2678 0.0000 1.0000 477
Health district 4 0.0671 0.2504 0.0000 1.0000 477
Health district 5 0.2055 0.4045 0.0000 1.0000 477
Health district 7 0.1216 0.3272 0.0000 1.0000 477
No client contribution 0.0964 0.2955 0.0000 1.0000 477
Full client contribution 0.5954 0.4913 0.0000 1.0000 477
Number of beds 17.0356 12.3794 1.0000 56.0000 477
Low staffed home 0.1321 0.3389 0.0000 1.0000 477
Low staffed sleep-in 0.2642 0.4413 0.0000 1.0000 477
Additional instruments
No. of beds squared 443.1405 666.0913 1.0000 3136.0000 477
Social interaction score 1.4211 0.9148 0.0000 3.0000 477
Mean emotional score 0.8560 0.6602 0.0000 3.0000 477
Mean emotional score squared 1.1677 1.4218 0.0000 9.0000 477
Ž . 3 Ž
mixed areas from the Midlands and the North. Similar studies e.g. Nyman,
. Ž .
1994; Propper, 1996 use area type dummies urban and rural . Related research in the care of elderly people show that pricing regulation and contract arrangements by local authorities and local authority budgets have an important bearing on
Ž .
prices Netten et al., 1998 . Both these factors vary significantly across individual local authorities in the UK, not just types of authority. However, data of this specific nature were not available, and so recourse was again made to local authority area dummies. Different areas are also likely to have different prevailing input prices and therefore will shift service costs.
We also included indicators of whether client contributions were made to cover the facility’s charge. These variables are included to capture the effects of different
Ž .
sources of demand. In particular, clients who are publicly funded since 1993 have their demands channelled via a care manager, who may have systematically different sets of preferences than private purchasing individuals. Clients that make
no contribution will be localrhealth authority funded. We might expect the
localrhealth authority to select the cheaper independent sector providers, although
Ž .
local authority provision is often more expensive Netten et al., 1998 . Also, localrhealth authority clients are often more dependent and so require more
Ž .
expensive services. We might then weakly expect this variable to be positively related to price.
A measure of the number of beds in each home was also included in the model
Ž
This variable acts both as a provider characteristics variable consumers often have
.
a preference for the size of home they wish to reside and also as a marginal cost
Ž .
shift factor see above .
The instruments used to identify the endogenous variables of our demand
Ž Ž ..
function are those that would enter the cost function Eq. 3 . To this end, two sets of factors believed to affect marginal costs were included in the estimation. First, a set of client dependency characteristics: social interaction score, mean
Ž
emotional score and interviewers’ global impressions of resident well-being see
.4
Lelliott et al., 1996 . These factors are hypothesised to be associated with
3
No quantitative data were available to indicate mental health service purchasing philosophies of the eight areas, although they differed as noted in regard to income, deprivation and population size and also in local political make-up.
4
The individual characteristics used in the analyses were measured using data collected on the Resident Profile, covering 24 dimensions of individual behavioural, clinical and social characteristics
ŽLelliott et al., 1996 . Some of these were grouped in summary scores, following factor analysis and.
individual care costs. Second, non-linear home size variables were also used as instruments to capture the effects of scale economies.
3.3. Estimation
Ž X.
The residual demand function in Eq. 16 has service mi’s demand and price
as endogenous variables. The functional inter-dependence of these variables creates standard problems in OLS regression estimation. Therefore, a two stage
Ž . Ž .
least squares estimation 2SLS technique was used the system is over-identified
ŽPindyck and Rubinfeld, 1981 . See Appendix A and Table 1b for a description of. Ž .
the instruments.
Heteroscedasticity is also a common problem with cross-sectional estimation.
Ž
This problem manifests as inefficient estimation of standard errors although
. Ž .
coefficient estimates are unaffected . White’s 1980 consistent estimator of the variance–covariance matrix is used to overcome this problem. However, the problem of biased errors and so predicted values remains when log-specifications
Ž .
are employed and in two-stage least squares estimation Manning, 1998 . Reme-dial steps — ascertaining the form of the heteroscedasticity — were not practical so some caution must be used when considering the results. Non-logged versions
Ž .
of Eq. 16 did not change the results regarding the significance of the variables.
3.4. Results
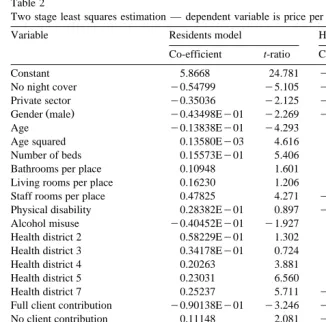
Two 2SLS estimations are reported in Table 2. The first model is at the service
Ž X
.
level of analysis and the second is Eq. 16 estimated at the provider level. In the
Ž
latter case all service-level variables price, client and service characteristic variables, were averaged over the number of residents sampled for the provider to give a single mean value at the provider level. All models were significant at the
Ž .
1% confidence level F-test . A Breusch–Pagan test for heteroscedasticity was
undertaken and it was found that the null hypothesis of homoscedasticity was rejected at the 5% level. For this reason White’s adjusted t-ratios are given in the table. Also, a HausmanrBasmann-Sargan LM specification test was performed on each model. This test produces a statistic that corresponds to a x2
distribution
Ž .
with 5 degrees of freedom in this case . The data did not reject the null hypothesis of an appropriate specification of the instruments. The 2SLS errors are asymptoti-cally normal and therefore a test for normality was deemed to be irrelevant in view of the large sample size.
3.5. Market power
The coefficient on x and its interaction dummy were both significant and hadi
1 2
Table 2
Ž .
Two stage least squares estimation — dependent variable is price per week log
Variable Residents model Home-level model
Co-efficient t-ratio Co-efficient t-ratio
Constant 5.8668 24.781 y0.37053 23.208
No night cover y0.54799 y5.105 y0.29284 y3.653
Private sector y0.35036 y2.125 y0.62402Ey01 y2.297
Ž .
Gender male y0.43498Ey01 y2.269 y0.14857Ey01 y1.016
Age y0.13838Ey01 y4.293 0.14823Ey03 y1.896
Age squared 0.13580Ey03 4.616 0.15268Ey01 1.981
Number of beds 0.15573Ey01 5.406 0.43786Ey01 3.885
Bathrooms per place 0.10948 1.601 0.19126 0.472
Living rooms per place 0.16230 1.206 0.74358 1.308
Staff rooms per place 0.47825 4.271 y0.79903Ey01 3.418
Physical disability 0.28382Ey01 0.897 y0.22946Ey01 y1.607
Alcohol misuse y0.40452Ey01 y1.927 0.86930Ey01 y0.542
Health district 2 0.58229Ey01 1.302 0.14834 1.241
Health district 3 0.34178Ey01 0.724 0.16922 2.153
Health district 4 0.20263 3.881 0.25049 2.163
Health district 5 0.23031 6.560 0.31365 4.270
Health district 7 0.25237 5.711 y0.26028 3.650
Full client contribution y0.90138Ey01 y3.246 y0.94090Ey01 y4.769
No client contribution 0.11148 2.081 y0.24207 y1.166
Low staffed home y0.25879 y5.423 y0.14029 y3.220
Low staffed sleep-in y0.15824 y3.466 5.8917 y2.364
Ž .
Number of residents ln y0.28363 y2.991 y0.23900 y2.892
Ž .
Residents ln=private 0.20166 3.203 0.18029 3.365
Ž . Ž .
Heteroskedasticity — Breusch- Sig 5% Sig 5%
2
Ž .
Pagan x , ns21
Ž . Ž .
Specification — Basmann- 2.41 Not Sig 5% 5.76 Not Sig 5% 2
Ž .
Sargan x , ns5 :
n 477 107
Žr is the proportion of the private sector residents in the sample — hence the
.
mean value of the private provider dummy . This estimate can be interpreted as the elasticity of the sample representative provider assuming that each provider’s
Ž X.
own products are similar, as indicated by Eq. 20 . It corresponds to the Lerner index for the representative provider. In other words a profit maximising provider would at the margin set price some 11% above marginal cost.
Ž X
.
The estimated function Eq. 16 also gives the elasticity of demand for the
Ž .
representative provider from the private ‘for-profit’ and non-profit sub-sectors.
Respectively, these estimates are: d P rd x N sb1qb2s y0.08197 and
m i i rs1 1 1
d P rd x N sb1s y0.28363. Non-profit providers are estimated to have
m i i rs0 1
Žmuch higher market power than private sector providers, a finding that supports.
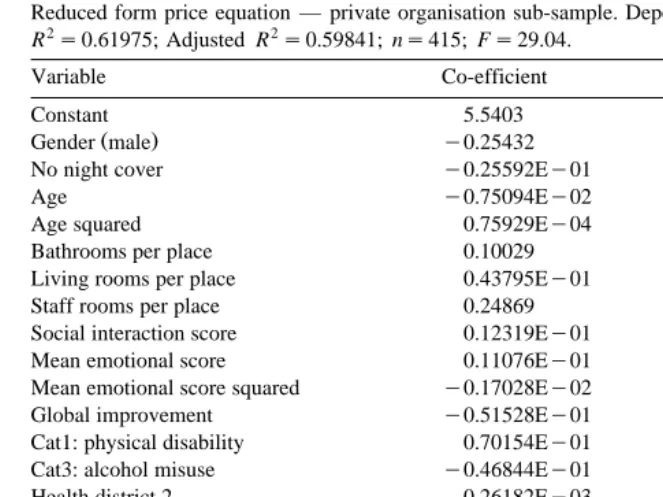
Table 3
Ž .
Reduced form price equation — private organisation sub-sample. Dependent variable: price log
R2s0.61975; Adjusted R2s0.59841; ns415; Fs29.04.
Variable Co-efficient t-ratio
Constant 5.5403 53.654
Ž .
Gender male y0.25432 y6.960
No night cover y0.25592Ey01 y1.347
Age y0.75094Ey02 y2.414
Age squared 0.75929Ey04 2.587
Bathrooms per place 0.10029 1.905
Living rooms per place 0.43795Ey01 0.481
Staff rooms per place 0.24869 2.247
Social interaction score 0.12319Ey01 1.035
Mean emotional score 0.11076Ey01 0.274
Mean emotional score squared y0.17028Ey02 y0.100
Global improvement y0.51528Ey01 y2.716
Cat1: physical disability 0.70154Ey01 2.361
Cat3: alcohol misuse y0.46844Ey01 y2.222
Health district 2 0.26182Ey03 0.006
Health district 3 0.55170Ey01 1.271
Health district 4 0.11982 2.402
Health district 5 0.25986 7.943
Health district 7 0.15625 3.741
Full client contribution 0.11826 2.441
No client contribution y0.14080 y5.563
Low staffed home y0.28313 y6.177
Low staffed sleep-in y0.26286 y6.072
3.6. Actual mark-up
Results of the reduced-form price estimation using only the private sector sub-sample are given in Table 3. The estimated parameters of this equation will only embody the private sector supply relationship and so preserve the effect of private sector motivations. The cross-predicted private sector price is given by the inner product of the vector of non-profit sector sub-sample means and the
y ² :
coefficient vector: Prs drKy s£220.89. The mean of actual prices across the
Ž .
same valid sub-sample of non-profit sector residents is Pys204.04. Underlying this latter price are non-profit characteristics and actual non-profit motivations. The difference in mean cross-predicted price and mean actual price is statistically
Ž .5
significant p-0.01 .
5
A Kolmogorov–Smirnov test casts some doubt on the normality of the distribution of this
Ž .
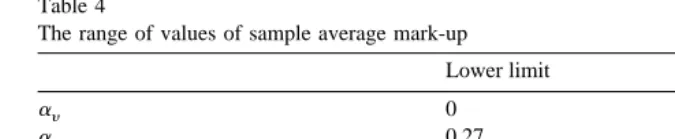
Table 4
The range of values of sample average mark-up
Lower limit Upper limit
ay 0 0.79
ar 0.27 1
Ž .
Private PycrP% 2.20 8.20
Ž .
Voluntary PycrP% 0 22.45
Ž .
Market average PycrP% 1.93 9.99
As noted above bry is equal to the estimated non-profit elasticity, that is
brysbys y0.28363. These values can be used with Lemma 1 to infer that mean
whole sample mark-up is greater than zero.
Turning to our calculation of the limit values of motivation, the first limit case
Ž .
is when ays0. Using our estimates and Eq. 32 we have:
PyPy
y r
0
ars byPy s0.27.
Ž
34.
r r
The alternative case is where we suppose that our estimates are generated with all
Ž .
private providers being pure profit maximisers, so ars1 . In this case, the
Ž .
associated limit value is derived from Eq. 33 :
Pry PyyPry
1
ays y s0.79.
Ž
35.
Py byPy
w y
These calculations give us two sets of hypothetical limit values ays0, ars
4 1 4x Ž
0.27 , ays0.79, ars1 . The corresponding actual mark-up estimates as
Ž Y
.. 6
given by Eq. 7 are reported in Table 4.
4. Discussion
The data indicate that our sample providers have market power allowing them to potentially set prices some 11% higher than marginal costs — the estimated
6
A sensitivity analysis was performed on the key parameters used in estimating actual mark-up. The
Ž .
upper and lower endpoints of the 95% confidence interval were used in various combinations for a
Ž .
the difference between the hypothetical cross-predicted price and the non-private mean price, b the
Ž .
Lerner index was y0.1104. Market power was measured at 8.2% for private organisations, but was over 28% for non-profit organisations.
Ž .
Nyman 1989 estimated a demand function for places in a nursing homes sample from Wisconsin, USA. He found that providers could set price over 50%
Ž .
higher than marginal costs a Lerner index of y0.59 compared to our y0.11 .
This value is high in comparison to our findings. However, the two studies estimate market power for different market segments in different countries — they are not really comparing like-for-like. In particular, Nyman’s estimates are for the
priÕate purchase of nursing care, but in this paper most clients are publicly
funded. Also, the focus in the current paper is only on services for people with mental health problems.
The propensity to set price in order to maximise profits is more difficult to
Ž .
establish; it depends on the objectives of providing stakeholders Steinberg, 1987 and also incentives to make profits created by the prevailing governance arrange-ments. Nonetheless, by estimating cost differences between discrete types of provider, based on cost-relevant data, we were able to calculate a range of possible values of mark-up for the average provider. The calculation was made by defining the proportion of market power that is actually taken as surplusrprofit to be on a 0 to 1 interval — the provider’s profit weight — and being clear that all organisations are constrained to have a profit weight of no less than 0 and no more than 1.
With this restriction, the data indicate that in the lower limit case when non-profit providers have a profit weight of 0, private providers have a weight of 0.27. The upper limit case when private organisations have a weight of 1, non-profit organisations have a value of 0.79. Therefore, the profit weight for private providers is between 0.27 and 0.21 higher than for non-profit organisations
Žp-0.05 . For the overall sample there is clearly a difference between potential.
and actual mark-up.
With respect to the comparative efficiency implications, do private providers have greater or lesser actual mark-ups than non-profit providers? At the lower
Ž .
limit private providers would use about a quarter 0.27 of their 8.2% market power to make profit: an actual mark-up of 2.2%. At the lower limit, non-profits have an actual mark-up of 0. The respective upper limit values of actual mark-up are 8.2% for private organisation and 22.4% for non-profits. It follows that the
difference between actual mark-up varies between q2.20% and y14.25%,
de-pending on the profit weight used. We are therefore unable to say which type of organisation — private or non-profit — operates with higher actual mark-ups. However, we can make some progress here by looking at differences in observed prices.
Ž .
In our sample, private sector average price £213.80 exceeds the non-profit
Ž .
marginal costs. As average prices are little different then either one of these factors
Ž .
or the other or both must have a comparatively low value. For example, were non-profit organisations really operating with mark-ups some 14 percentage points higher than private providers, the implied difference in marginal costs would be
Ž .
very large — about £40 per week 20% of price — for basically the same types of services. The implied difference in marginal costs between for-profit and non-profit organisations becomes much smaller for lower values of profit weight.
Ž .
Therefore, if we accept that the difference in minimum marginal costs between provider types is small in reality, we are left with the implication that providers are unlikely to be profit maximisers and that non-profits are likely to have very low mark-up levels.
The usual data limitations of cross-sectional socialrhealth care studies are perhaps exacerbated in the case of mental health where care and treatment facilities are very far from standardised, where many agencies are involved and where funding is complex. The lack of consensus on the definition of good outcomes compounds the problem of finding appropriate measures of service quality. Included in the model were a range of process indicators of quality such as
Ž
night nursing cover, staffing intensity and provider client categories e.g. that cater
.7 for people with physical disabilities, those with alcohol misuse problems, etc. . However, measures of more intangible aspects of quality relating to user outcomes were not available.8 Despite a lack of direct measures, we might rely on indirect indicators as signals of quality intangibles, and one such measure that was
Ž .
included is provider sector i.e. non-profit, private . . . .
Data limitations give rise to concerns about representativeness. Losses in cases due to missing price data were proportionately high for the local authority and voluntary sectors. This partly reflects the specialist nature of the missing facilities
Ž .
and the multiple sources of funding of their residents obscuring the true price . The final sample is therefore not representative of the respective proportions of the total number of all types of facilities. For the population of the eight districts, the local authority and voluntary sectors both have approximately a 20% share of
Ž .
facilities hostels . In the current sample these shares are about 10%. However, the sample is more representative of the ‘core’ industry where highly vertically differentiated products are absent. It seems reasonable to hypothesise that those facilities with missing or poor price data give low priority to financial matters and so are even less likely than sample non-profits to be rent-seekers.
7 Ž .
Also, a number of factors were tried, for example, the number of qualified nursing staff per home, proportion of single rooms, etc., but these factors did not prove to significant and were dropped.
8
5. Conclusion
The data were found to be largely consistent with our two hypotheses. First that average market power is relatively low. Second, regarding the comparative performance of providers under different governance arrangements, that non-profit providers would have higher market power than private sector providers, but a lower propensity to use market power to make profits. The whole sample Lerner
Ž .
index market power was 11%: 8.2% for private and 28% for non-profit organisa-tions. Moreover, private providers are at least 25% more likely to be profit maximisers. The market power and profit weight estimates are consistent with both hypotheses.
We can then conclude that inter-sectoral differences are real in regard to pricing behaviour. The efficiency consequences of the implied pricing behaviour are more difficult to discern however. In the analysis we had to contend with two areas of
Ž .
limited data; first, providers’ actual minimum efficient marginal costs and,
second, their motivations. Only by supposing that minimum efficiency marginal
Ž .
costs are similar same cost-relevant factors can we weakly infer that actual mark-up levels are higher in the private sector. Even then the differences are not large. Furthermore, comparative efficiency calculus would have to account for
Ž .
possible adverse selection cream-skimming — see Forder, 1997 and better
control for differences in users’ outcomes.
The economics of organisation assumes that governance choice is an
endoge-Ž .
nous decision. Williamson 1994 argues that transactions which differ in their attributes are aligned with governance structures in a ‘discriminating — mainly transaction cost economising — way’. As a positive prediction we might expect comparative differences in efficiency to be relatively small, as we found.
Information about pricing, provider behaviour and provider motivation is crucial in helping to guide policy makers in improving the mental health care system, in particular, regarding the use of market-centred rather than hierarchical means of organisation. This paper provides some of the required information and found a potential for efficiency savings associated with the right choice of governance.
Acknowledgements
Appendix A. Proxy variables
Variable Proxy definition Proxies
Demand
xi output Number of residents in the home at
a
Ž .
time of sample natural log
Pm i price Model price is the individual resident
a
Ž .
gross charge per week logged
ym i demand shift factors
Ž .1 service characteristics home category 1: physical disability home category 3: alcohol misuse night cover
low staffed facilities
low staffed ‘sleep-in’ facilities age
age squared
Ž .
gender male
Ž .2 sector private sector
Ž .3 facility characteristics bathrooms per bed
Žphysical quality.
living rooms per bed staff rooms per bed.
Ž .4 client funding full client contribution to paymentŽ .
zero client contribution
Ž .5 purchasers’ preferences health districts: 2,3,4,5,7
Costs
a Ž .
xi output no. of residents see above
xi capacity number of beds at time of sample
w, r input costs: area dummies health districts: 2,3,4,5,7
zi cost shift factors
b Ž .1 individual’s characteristics mean emotional score
b mean emotional score squared
b social interaction score
b global impression score gender
age
age squared
Ž .2 service characteristics home category 1: physical disability
low staffed facilities
low staffed ‘sleep-in’ facilities
Ž .3 facility characteristics bathrooms per bed
living rooms per bed staff rooms per bed.
b
Ž .4 scale effects no. of beds squared
a
Endogenous variables. b
Non-demand instruments.
References
Baker, J., Bresnahan, T., 1985. The gains from merger or collusion in product-differentiated industries.
Ž .
Journal of Industrial Economics 33 4 , 427–444.
Bartlett, W., Roberts, J., Le Grand, J., 1998. The development of quasi-markets in the 1980s. In:
Ž .
Bartlett, W., Roberts, J., Le Grand, J. Eds. , A Revolution in Social Policy : Quasi-Market Reforms in the 1990s. Policy Press, Bristol.
Baumol, W.J., Panzar, J.C., Willig, R.D., 1982. Contestable Markets and the Theory of Industrial Structure. Harcourt Brace Jovanovich, New York.
Bilodeau, M., Slivinski, A., 1996. Volunteering nonprofit entrepreneurial services. Journal of Eco-nomic Behaviour and Organisation 31, 117–127.
Boadway, R., Bruce, N., 1984. Welfare Economics. Blackwell, Oxford.
Bresnahan, T., 1989. Empirical studies of industries with market power. In: Schmalansee, R., Willig,
Ž .
R. Eds. , Handbook of Industrial Economics. North-Holland, Amsterdam.
Chisholm, D., Knapp, M., Astin, J., Lelliot, P., Audini, B., 1997. The mental health residential care study: predicting costs from resident characteristics. British Journal of Psychiatry 170, 37–42. Coase, R., 1937. The nature of the firm. Economica 4, 386–405.
Darton, R., Knapp, M., 1984. The costs of residential care for the elderly: the effects of dependency,
Ž .
design and social environment. Ageing and Society 4 2 , 157–183.
Eaton, C.B., Wooders, M.H., 1985. Sophisticated entry in a model of spatial competition. Rand Journal
Ž .
of Economics 16 2 , 282–297.
Eckel, C., Steinberg, R., 1994. Tax policy and the objectives of nonprofit organisations in a mixed sector duopoly, mimeo.
Forder, J., 1997. Contracts and purchaser–provider relationships in community care. Journal of Health Economics 16, 517–542.
Forder, J., Knapp, M., Wistow, G., 1996. Competition in the mixed economy of care. Journal of Social
Ž .
Policy 25 2 , 201–221.
Jarman, B., 1983. Identification of underpriviledged areas. British Medical Journal 286, 1705–1709. Kendall, J., Knapp, M., 1996. The Voluntary Sector in the UK. Manchester Univ. Press, Manchester. Knapp, M., Beecham, J., Hallam, A., 1997. The mixed economy of psychiatric reprovision. In: Leff, J.
ŽEd. , Caring in the Community. Wiley, Chichester..
Ž .
Kreps, D., 1996. Markets and hierarchies and mathematical economic theory. Industrial and
Corpo-Ž .
rate Change 5 2 , 561–595.
Kreps, D., Wilson, R., 1982. Reputation and imperfect information. Journal of Economic Theory 27, 253–279.
Le Grand, J., Bartlett, W., 1993. Quasi-markets and Social Policy. Macmillan, Basingstoke. Lelliot, P., Audini, B., Knapp, M., Chisholm, D., 1996. The mental health residential care study:
classification of facilities and description of residents. British Journal of Psychiatry 169, 139–147. Lewis, J., Glennerster,