Oky Dwi Nurhayati, Computer Engineering, Faculty of Engineering, Diponegoro University, Prof. Sudharto street, Tembalang, semarang 50275 Indonesia. Email : [email protected]
Th.Sri Widodo, Electrical and Information Technology, Faculty of Engineering Gadjah Mada University, Grafika Street., Yogyakarta, Indonesia. Email : [email protected]
Adhi Susanto, Dept. of Electrical Eng. and Information Technology, Faculty of Eng., Gadjah Mada University, Yogyakarta. Indonesia. Email : [email protected]
Maesadji Tjokronagoro, Dept. of Medical, Faculty of Medicine,Gadjah Mada University, Yogyakarta. Indonesia
Detection of the Breast Cancer from Thermal
Infrared Images
Oky Dwi Nurhayati, Thomas Sri Widodo, Adhi Susanto, Maesadji Tjokronagoro
Abstract – Thermography can be used as part of an early detection tool which gives women of all ages the opportunity to increase their chances of detecting breast diseases at a very early stage. Breast thermography is a noninvasive prognostic procedure which can predict a tumor growth rate in breast cancer patients. The objective of this research is to acquire the potential of the statistical characteristics of the breast thermogram images for the detection of the breast cancer.
For this research we use thermal data images from Sardjito hospital at Yogyakarta, from normal and abnormal breast (detected breast cancer). Firstly, download the breast image thermograms from the InsideIR software of Fluke Ti20 and save them as the inputs to our image processing program. Then adjust the format of the images, convert to grayscale images, and crop them to separate the suspected objects from the background. Finally we tabulated the statistical characteristics of the objects which are the means, standard deviations, and entropy to reveal the abnormalities of breast thermograms.
The results show that the method are promising to detect the abnormality on the breast thermogram images. The normal breast thermograms have minimum entropies which differ from those abnormal thermograms in the early stage of breast cancer and thesignificantly from the more advanced of breast cancer.
Index Terms: thermogram, early breast cancer, deep breast cancer, statistical characteristics
I. INTRODUCTION
Texture are identifying features or characteristics owned object in a big region and naturally these characteristics could recur in this area. The small region when compared with elements of the available texture inside, could not show the texture itself. Actually, the same texture when saw at different scale would be seen like two different textures, when it was has big scale expansion surface had resemble the origin surface (regular pattern). The other word, they were emerge repeatedly in the interval of distance and certain direction. The texture information used to distinguish the surface characteristics of object in the image were connected with rough and soft, specific characteristics from coarseness and surface refinement, that completely free from the colour surface.
Texture is the important task in the visual system such as surface texture object was used for the inspection of the semiconductor material, the distribution of feature intensity from homogeneous texture was used to group the aerial photograph image, the variation in the texture pattern of the resulting from the perspective projection used to determine forms of three dimensions object. The texture analysis could be used to segment an image, patterns identificate were arranged and continued, patterns intensity, the surface object that was connected with the rough and soft characteristics. The texture characteristics were formed from the distribution of the environment intensity by image field. Texture could not be determined from one point, but must from a group of point.
The aim of the analysis texture image processing was to make the local intensity variation pattern taken repeatedly as distinguish feature, whenever the variation pattern was too small when compared with the observed object in use resolution. The simple example was the dots repeatedly pattern on the white background. The text was printed in a sheet of paper could formed a texture. In this case each intensity point formed pixels connected represent each character. The statistical method was used to extract the texture feature of an image. Image characteristics such as the arrange pixel intensity and texture feature namely contrast, entropy and homogeneity with other feature was counted from the image intensity.
research we were used three feature to detect the breast thermogram images.
II. Entropy and Histogram
Entropy of the image was a feature to measure the randomization of intensity distribution. An image was said perfectly if the entropy value is zero. Entropy was a measure of statistics random could be used to determine characteristics texture the grayscale image. Entropy was defined as:
=−
∑∑
1 2) , ( log ) ,
(1 2 1 2
i i
i i p i i p
Entropy (1)
where pi was the emergence probability. The maximum entropy value was reached when all of the elements p (i1, i2) have the same value, namely the matrix was connected with the image and it’s not available certain regular in a couple of intensity and distance of the d certain vector.
The input image could form of the multidimensional image. If there are more two dimensions input image, the function entropy was preserved as the multidimensional grayscale image and not the RGB image.
Histogram is the graph show the spreading of the pixel intensity values of an image. From a histogram we could know the emergence distribute frequency relative from the image pixel intensity. Histogram has several use show about the brightness and the contrast image.
According to the image processing procedure, the restricted equation of histogram is the following:
1 ,..., 1 , 0
, = −
= i L
n n
h i
i
(2)
Where, n = total number pixel of images ni = number pixel with i grayscale level
The distribution hi, or ni, could provide information about the image emergence. Histogram used to give an information about pixel intensity, number of pixel, and changes of the view by image processing operation.
The number of different light intensities in an image often does not use the whole available spectrum and mostly accentuate a narrow spectrum. Images with such poor intensity distributions can be helped with a process known as histogram equalization. Histogram equalization is a method for "spreading" the histogram of pixel levels more evenly.
Histogram equalization can be used to improve the visual appearance of an image. Peaks in the image histogram (indicating commonly used grey levels) are widened, while the valleys are compressed.
III. Material and Method
Material used to this research was the digital breast thermogram images from the womans in normal and abnormal (the womans were detected breasts cancer in the early stage and the continued stage) that was captured by the camera thermal Fluke Ti20 with the software InsideIR 3.11. The data was taken from RSUP.Dr.Sarjito Yogyakarta. The digital thermogram images was processed use the Matlab program 7.04 by pre-processing images shown in Figure 1.
Figure 1: Steps of the breast thermogram images to detect breast cancer
Breast termogram Image
Adjust Image Format
Convert RGB to Grayscale
Cropping
Histogram
IV. Results
The results of this research can show the conversion RGB breast thermogram images to grayscale thermogram images in Figure 2 below.
the normal breast rgb image the normal breast gray image
the early breast cancer rgb image the early breast cancer gray image
the deep breast cancer rgb image the deep breast cancer gray image
Figure 2: RGB thermogram images (left side) and they conversion to grayscale (right side) from image data N7.jpg, D3.jpg, and L2.jpg
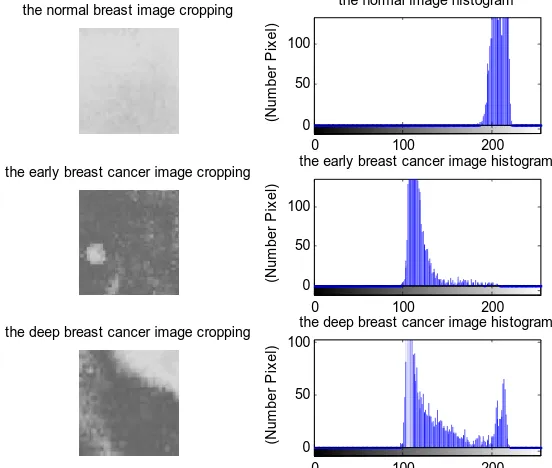
the normal breast image cropping
the early breast cancer image cropping
the deep breast cancer image cropping
0 100 200
0 50 100
the normal image histogram
(N
u
m
b
e
r
P
ix
e
l)
0 100 200
0 50 100
the early breast cancer image histogram
(N
u
m
b
e
r
P
ix
e
l)
0 100 200
0 50 100
the deep breast cancer image histogram
(N
u
m
b
e
r
P
ix
e
l)
Figure 3: Cropping image grayscale (left side) and they histogram (right side) from image data N7.jpg, D3.jpg, and L2.jpg
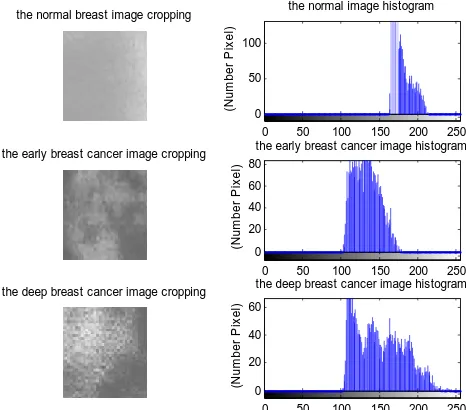
The same manner will achieve Figure 4 and Figure 5 of the normal breast thermogram image from data N42.jpg, the early breast cancer D1.jpg, and the
the normal breast rgb image the normal breast gray image
the early breast cancer rgb image the early breast cancer gray image
the deep breast cancer rgb image the deep breast cancer gray image
Figure 4: RGB thermogram images (left side) and they conversion to grayscale (right side) from image data N42.jpg, D1.jpg, and L1.jpg
the normal breast image cropping
the early breast cancer image cropping
the deep breast cancer image cropping
0 50 100 150 200 250
0 50 100
the normal image histogram
(N
u
m
b
e
r
P
ix
e
l)
0 50 100 150 200 250
0 20 40 60 80
the early breast cancer image histogram
(N
u
m
b
e
r
P
ix
e
l)
0 50 100 150 200 250
0 20 40 60
the deep breast cancer image histogram
(N
u
m
b
e
r
P
ix
e
l)
Figure 5: Cropping image grayscale (left side) and they histogram (right side) from image data N42.jpg, D1.jpg, and L1.jpg
The classification process of the cropped breast thermogram images were carried out with the calculation of image statistics. Some values were used to analyse such as mean value, deviation standard, and entropi. Mean value was pointed out with MN, MD, and ML that means mean normal, mean early, and mean deep. The value of standard deviation was shown with StdN, StdD,
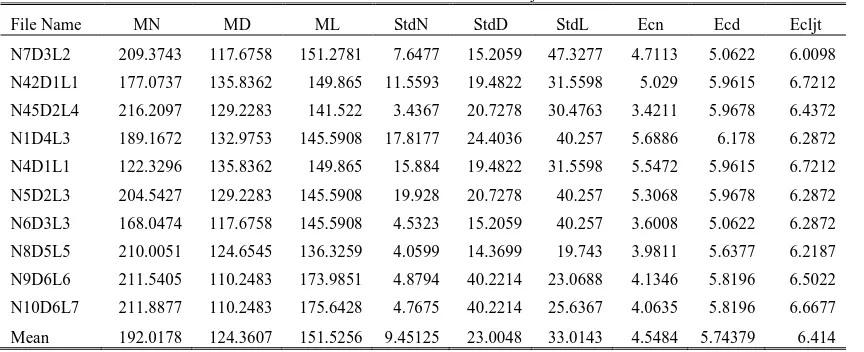
Table 1
The measurement result of the object
File Name MN MD ML StdN StdD StdL Ecn Ecd Ecljt
N7D3L2 209.3743 117.6758 151.2781 7.6477 15.2059 47.3277 4.7113 5.0622 6.0098
N42D1L1 177.0737 135.8362 149.865 11.5593 19.4822 31.5598 5.029 5.9615 6.7212
N45D2L4 216.2097 129.2283 141.522 3.4367 20.7278 30.4763 3.4211 5.9678 6.4372
N1D4L3 189.1672 132.9753 145.5908 17.8177 24.4036 40.257 5.6886 6.178 6.2872
N4D1L1 122.3296 135.8362 149.865 15.884 19.4822 31.5598 5.5472 5.9615 6.7212
N5D2L3 204.5427 129.2283 145.5908 19.928 20.7278 40.257 5.3068 5.9678 6.2872
N6D3L3 168.0474 117.6758 145.5908 4.5323 15.2059 40.257 3.6008 5.0622 6.2872
N8D5L5 210.0051 124.6545 136.3259 4.0599 14.3699 19.743 3.9811 5.6377 6.2187
N9D6L6 211.5405 110.2483 173.9851 4.8794 40.2214 23.0688 4.1346 5.8196 6.5022
N10D6L7 211.8877 110.2483 175.6428 4.7675 40.2214 25.6367 4.0635 5.8196 6.6677
Mean 192.0178 124.3607 151.5256 9.45125 23.0048 33.0143 4.5484 5.74379 6.414
From the Table 1 above we could see the biggest mean value founded in breast thermograms, and the smallest mean value was gotten in the thermogram that was detected early breasts cancer. On the other hand the smallest deviation standard value was found in the breast normal thermogram and the biggest value was found in the advance breasts cancer. The last measurement showed that the smallest entropy found in the breast normal thermogram, on the contrary the biggest value entropy was found in the advance breast cancer thermogram.
V.Conclusion
There are several methods in breast thermogram images viz :
1.first is pre-processing image of the breast thermogram images were done by adjusting format images, converted the RGB images to grayscale images;
2.Statistical characteristics of the breast thermogram images were carried out by extracting information of the image. These characteristics could be used to distinguish the thermogram images and the abnormal thermogram images so it could be use to detect breast cancer of breast thermogram images.
REFERENCES
[1] Gonzalez, R.C and Rafael E.W, 2008, Digital Image Processing, Prentice-Hall, Inc., United State, America.
[2] Angenent, S., Eric Pichon, and Allen Tannenbaum, 2000, Mathematical Methods in Medical Image Processing, Buletin of the American mathematical society.
[3] Frize,M; Herry C;Scales,N,2003,Processing thermal images to detect breast cancer and assess pain , Information Technology Applications in Biomedicine, 2003. 4th International IEEE EMBS Special Topic
Conference on. Volume , Issue , 24-26 April 2003 Page(s): 234 – 237.
[4] Francis Arena M.D,Clements Barone M.D,Thomas Dicicco, Use Of Digital Infrared Imaging in Enhanced Breast Cancer Detection and Monitoring of The Clinical Response to Treatment.
[5] Hairong Qi,Phani Teja Kuruganti,Wesley E.Snyder, 1995, Detecting Breast Cancer From Thermal Infrared Images by Asymmetry analysis
[6] Jain, A.K., 1995, Fundamentals of Digital Image Processing, Prentice-Hall of India, New Delhi. [7] Liza Allen ,MD Thermal Image Medicine
Systems
[8] Abubaker, A.A., Qahwadi, R.S.,Aqel, M.J., Al-Osta, H., Saleh, M.H., 2006, Efficient Pre-Processing of USF and MIAS Mammograms Images, Journal of Computer Science 3 (2): 67 – 75, ISSN 1549 – 3636.
[9] Barron, W.R. 2000. Principles of Infrared Thermometry. Williamson Corporation. [10] Benitez, H., H.Loaiza, E.Caicedo, B.Bacca ,
H.Jimenez, M.Barreto, and J.Vargas, 2005, Software Tool in Java for Infrared Image Processing: TermUV, Journal of International Workshop: p.209-214, ISBN: 2-9809199-0-X. [11] Chandra Sekaran S, et. Al, An Eigenspace
Update Algorithm for Image Analysis, Department of Electrical and Computer Engineering University of California, Santa Barbara, 1997.
[12] Christiansen, J. , Gerow G. 1990. Thermography. Williams and Wilkins. Baltimore.
[14] Roderick A.Thomas, Kelvin E.Done, Marc.C, Mike K,”An Application of Thermography with Human Skin.
[15] Schalkoff, R.J., 1799, Digital Image Processing and Computer Vision, John Wiley & Sons, Inc, Monticello.
[16] Fausset, L.,1994,Fundamentals of Neural Networks, Architectures, Algorithms, and Applications, Prentice Hall, Englewood Cliffs, New Jersey 07632
[17] G.D, R.M. Rangayyan, W.A. Carnielli, J.A. Zuffo, and J.E.L. Desautels, 2003,
Segmentation of breast tumors in mammograms using fuzzy sets, Journal of Electronic Imaging, 12(3): 369-378, July 2003.
Oky Dwi Nurhayati. Born in Semarang, 2nd
October 1979. Graduated from the Department of Telecommunication Engineering, Faculty of Engineering, Telecommunication Engineering Institute, Indonesia in 2002.
Master from Post Graduate Program, Department Electrical Engineering, Gadjah Mada University, Indonesia in 2008. In the period of 2008— present she is a Ph. D. Candidate in the Department of Electrical Engineering, Faculty of Engineering, Gadjah Mada University, Yogyakarta, Indonesia. From 2009— present she is a lecturer in the
Department of Computer System, Faculty of Engineering, Diponegoro University, Indonesia. Current and interest research is in biomedical image processing.
Thomas Sri Widodo. Born in Klaten,
Indonesia, 1950. A Professor in the Department of Electrical Engineering and Information Technology, Faculty of Engineering, Gadjah Mada University, Yogyakarta. INDONESIA. (email: [email protected]).
Dipl. Ing. ENSERG, Grenoble, France, 1985. Doctorat d'Etudes Approfondies, Univ. Montpellier 2, France, 1986
Docteur de l'Universite, Univ. Montpellier2, France, 1988. Current research interest is system, signal and electronics. He is a Professor in The Dept.of Electrical Engineering and Information.
Adhi Susanto. Born in Banjar, Indonesia, 1940.
M. Sc. (1966) and Ph.D. (1988) from University of California Davis. A Professor in The Dept. of Electrical Engineering and Information Technology, Faculty of Engineering, Gadjah Mada University, Jogjakarta, Indonesia. (email: [email protected]). Current research interest is Electronics Engineering, Image Processing, Signal Processing, Adaptive System, Classification and Pattern Recognation
Techniques. A member in IEEE and Planetary Society.
Maesadji Tjokronagoro. A Professor in The