Corresponding Author: S.V.S. Sai Krishna, Atmospheric and Climate Sciences Group, Earth and Climate Science Area, National Remote Sensing Centre, Hyderabad
ESTIMATION OF NET RADIATION USING SATELLITE BASED DATA INPUTS
S.V.S. Sai Krishna*, P. Manavalan, P.V.N. Rao
Atmosphere and Climate Sciences Group (ACSG), Earth and Climate Science Area (ECSA), NRSC, Hyderabad, India [email protected], [email protected], [email protected]
Commission VI, WG VI/4
KEY WORDS: Net Surface Radiation, Insolation, Shortwave Albedo, Air Temperature, Emissivity, Satellite based Data Inputs
ABSTRACT:
Daily net surface radiation fluxes are estimated for Indian land mass at spatial grid intervals of 0.1 degree. Two approaches are employed to obtain daily net radiation for four sample days viz., November 19, 2013, December 16, 2013, January 8, 2014 and March 20, 2014. Both the approaches compute net shortwave and net longwave fluxes, separately and sum them up to obtain net radiation. The first approach computes net shortwave radiation using daily insolation product of Kalpana VHRR and 15 days time composited broadband albedo product of Oceansat OCM2. The net outgoing longwave radiation is computed using Stefan Boltzmann equation corrected for humidity and cloudiness. In the second approach, instantaneous clear-sky net-shortwave radiation is estimated using computed clear-sky incoming shortwave radiation and the gridded MODIS 16-day time composited albedo product. The net longwave radiation is obtained by estimating outgoing and incoming longwave radiation fluxes, independently. In this, MODIS derived surface emissivity and skin temperature parameters are used for estimating outgoing longwave radiation component. In both the approaches, surface air temperature data required for estimation of net longwave radiation fluxes are extracted from India εeteorological Department’s (IεD) Automatic Weather Station (AWS) records. Estimates by the two different approaches are evaluated by comparing daily net radiation fluxes with CERES based estimates corresponding to the sample days, through statistical measures. The estimated all sky daily net radiation using the first approach compared well with CERES SYN1deg daily average net radiation with r2 values of the order of 0.7 and RMS errors of the order of 8-16 w/m2.
1.
INTRODUCTIONNet surface radiation is the balance of energy between incoming and outgoing shortwave and longwave radiation fluxes at land-atmosphere interface. It is the major driving force behind land surface processes such as evaporation and exchange of energy between surface and atmosphere and the feedbacks of radiation fluxes play a significant role in evolution of climate systems. The net surface radiation (Rn) is obtained by summing up the net surface shortwave (Rns) and longwave (Rnl) radiation:
= + = ↓− � ↑ + ↓− ↑ (1) where ↓ = downward shortwave radiation
↑ = upward shortwave radiation � = surface shortwave albedo ↓ = downward longwave radiation ↑ = upward longwave radiation
The radiation components are variedly influenced by the surface heterogeneity and by the presence, type and diurnal distribution of clouds. As a result, the net surface radiation varies spatially as well as temporally. Of the four different radiation components, the incoming shortwave and longwave components are essentially independent of surface conditions while the outgoing shortwave and longwave components strongly rely on them.
Radiation measurements can be done at specific locations using instruments such as net radiometers. As these measurements are strongly influenced by surface heterogeneity, it is difficult either
to extend measurements made at specific location to other sites (Blad et al., 1998) or to extrapolate them to regional scales. However, as the incoming shortwave and longwave components are mostly independent of surface conditions the ground point measurements can be applied to estimate them at regional scales. Point measurements of incoming shortwave may be extended to a much larger area if atmospheric scattering and absorbing properties are assumed to be uniform over the region (Blad et al., 1998).
Radiative transfer model such as MODTRAN is useful for estimating incoming conditions; however, its computational complexity makes it unsuitable for estimating the global surface radiation flux directly. Global Climate Models (GCMs) such as the Global Energy and Water Cycle Experiment (GEWEX) and International Satellite Cloud Climatology Project (ISCCP) can also be used to estimate the radiation components. Nearly all GCMs calculate shortwave solar radiation reaching land surface with low spatial resolutions (> 1° ) and moderate temporal resolutions (6 hours) (Liang et al., 2010). Most GCMs tend to overestimate the amount of shortwave radiation and with considerable uncertainty (Liang et al., 2010). Surface longwave radiation budget data are also available from GCM simulations. However, many GCMs have simplified land surface emissivity and considerable differences exist between model outputs and satellite derived products (Liang et al., 2012).
remote sensing pixel or model grid spatially. Spatial upscaling always results in errors, but the use of remote sensing observations with different spatial resolutions will help to reduce uncertainties (Liang et al., 2010).
Remotely sensed data is found more useful for estimation of reflected and emitted radiation (outgoing components) from different types of surfaces and at various spatial scales. Of the incoming components, the shortwave radiation can be estimated using remote sensing with less uncertainty than the longwave radiation. The incoming long-wave radiation flux can be estimated from models which incorporate air temperature and vapour pressure data (Blad et al., 1998). Many algorithms are available to calculate the amount of radiation at surface using satellite data and global land surface radiation products are currently being generated from CERES, which is onboard the NASA Earth Observing System (EOS) Terra and Aqua satellites and the Tropical Rainfall Measuring Mission (TRMM) satellite (Liang et al., 2012). The other long term satellite retrieved radiation data sets include the ISCCP data which has a 280-km spatial resolution (1983-2000) and the Global GEWEX surface radiation budget data, which has a 1° spatial resolution (1983-2005).
In the present study, the downwelling and upwelling components of surface radiation fluxes are computed using satellite derived geophysical parameter products and point observed meteorological parameter data. Daily net surface radiation products are then generated for Indian land mass at shortwave and net longwave fluxes, employing two different approaches.
2.1 First Approach
2.1.1 Net Shortwave Flux: In this approach, the daily net surface shortwave flux, Rns in equation (1) is calculated using the daily insolation products derived from Kalpana VHRR (MOSDAC portal, ISRO) and the 15 days time composited broadband albedo product of Oceansat OCM2 (BHUVAN portal, ISRO).
The insolation products posted at MOSDAC portal are generated using VIS, TIR and WV channels of Kalpana-1 VHRR at rectangular grid spacing of about 0.069 X 0.075 deg. A spectrally integrated, clear sky and three layer cloudy sky model is implemented to estimate direct, diffuse and global instantaneous surface insolation. Daily total insolation is computed through trapezoidal integration from half an hourly insolation. It has been reported that results of validation of the product indicated an RMSE of 1.85 MJm-2 which corresponded to 10% of the measured mean. Also it has been specified that accuracy in cloudy sky is less than in clear sky.
The 15 days time composited broadband albedo products version 1.0 available from BHUVAN portal at a spatial resolution of 1km (1080m to be precise) are derived from the data acquired by Ocean Color Monitor (OCM2) sensor onboard Oceansat-2. For validation purpose, these products (at 360 m) were resampled to 500m and compared with MCD43A3 16 day composite products of MODIS. The correlation plot for four
months data between the OCM2 and MCD43 broadband products showed good overall correlation with r² ~ 0.90. 2.1.2 Net Longwave Flux: The net longwave flux is the balance between surface upwelling and downwelling longwave radiations.
Upwelling longwave radiation that is highly heterogeneous is very difficult to measure, and point measurements on the ground represent a very small area and they lack quantified accuracies (Liang et al., 2010).
Satellite retrievals of surface downwelling longwave fluxes have to rely heavily on retrieved meteorological profiles, cloud parameters, and radiative transfer models to compute the surface downwelling flux (Zhou et al., 2007). It is observed that the downwelling longwave radiation is dominated by the radiation from a shallow layer close to the surface of the earth and the contribution of the lowest 10 meters of the atmosphere accounts for 32-36% of the total surface downward longwave radiation (Schmetz, 1989).
Allen et al. (1998) provides a simplified procedure to estimate the net daily outgoing flux of longwave radiation without computing incoming and outgoing radiations separately, through formulation of single equation based on Stefan-Boltzmann law which is corrected for humidity and cloudiness:
= � [ ,�+ � ,�] ( � − �√ ) [ − ]
al, bl, ac, bc = calibration coefficients (dimensionless); ea = actual vapour pressure [kPa].
In this study the net outgoing longwave radiation is computed using equation (2) with values of (0.34, 0.14) for al and bl and (1.35, -0.35) for ac and bc as recommended by Allen et al. (1998).
An estimate of actual vapour pressure, ea, is obtained by using dew point temperature (Tdew) in the following equation:
= 0 = � [
+ . ] (3)
For estimating ‘ea‘ in units of ‘kPa’, values of 0.611 and 17.27 are to be used as constants a and b, respectively.
The all-sky solar radiation, Rs is obtained from Kalpana-1
VHRR daily insolation products.
The clear-sky solar radiation, Rs0 is obtained from the equation:
0= . + x − ℎ (4) where Ra = extraterrestrial radiation
The extraterrestrial radiation, Ra, for each day of the year and for different latitudes can be estimated from the solar constant, the solar declination and the time of the year by:
= ( � ) �x [� sin � sin
+ � sin � ] (5)
where Ra = extraterrestrial radiation in MJm-2day-1 Gsc = solar constant [0.0820 MJm-2min-1] dr = inverse relative distance Earth-Sun ωs = sunset hour angle [rad]
ϕ = latitude [rad] = solar declination [rad]
Values of ‘h’ in the equation (4) are obtained by geo-processing of SRTM DEM products available at 3” postings with reported height accuracy of about 16 m.
The daily maximum, minimum and dew point temperature data required for estimation of net longwave radiation are extracted from India εeteorological Department’s (IεD) Automatic Weather Station (AWS) records.
2.1.3 Daily Net Surface Radiation Flux: The net surface radiation is computed by subtracting net outgoing longwave radiation calculated using equation (2), from net shortwave radiation obtained by the procedure as described in section 2.1.1.
2.2 Second Approach
In this approach, instantaneous net radiation estimates are computed for the afternoon 1330 IST overpass of the MODIS sensor aboard Aqua satellite. The daily average net radiation is then computed from the instantaneous net radiation by applying sinusoidal diurnal cycle function.
2.2.1 Instantaneous Net Shortwave Flux: The incoming shortwave radiation at surface, ( ↓) is calculated following Allen et al. (1998):
↓= � �0 � (6)
�0= + . cos � ⁄ (7)
where
�0 = eccentricity correction factor of the Earth’s orbit about Sun S = solar constant (1367 W/m2)
� = solar zenith angle
dn = Julian day of the year (between 1 and 365/366)
The transmissivity of the atmosphere ( ) is calculated as a function of the elevation above sea level (h); the same way as in equation (4):
MODIS black-sky albedo from the MCD43C3 albedo product is used in the above equation.
Instantaneous net shortwave radiation is obtained by subtracting the computed outgoing shortwave radiation from clear-sky solar radiation.
2.2.2 Instantaneous Net Longwave Flux: In this second approach, the instantaneous net longwave flux is obtained by estimating incoming and outgoing longwave radiation components, independently.
For estimation of incoming longwave radiation ( ↓), the parameterized method suggested by Brutsaert (1975), which uses measurements of meteorological variables near the surface has been employed:
↓= � (10)
= ( + . ) (11) where
= atmospheric emissivity = vapor pressure in mb
= air temperature in ˚C
and = calibration constants with =1.24 and =0.143
� = Stefan-Boltzmann constant (5.67 x 10⁻⁸ W/m2-K4)
The vapor pressure, ed in mb is computed using the equation (3) with a and b values, 6.11 and 7.5, respectively.
The outgoing longwave radiation ( ↑) is calculated from the Stefan-Boltzmann equation using land surface temperature and land surface emissivity obtained from the MYD11C1 MODIS product:
↑= � (12)
where = land surface emissivity Ts = land surface temperature in K
2.2.3 Daily Net Surface Radiation Flux: The net radiation at surface essentially follows the shape of the diurnal variation of the land surface temperature during day-time. The shape of the net radiation curve may be approximated by a parabola and a sine curve with period twice the duration of the day. The sinusoidal method suggested by Bisht et al (2005) is applied in this study to compute the daytime net radiation (Rnd) from sunrise to sunset:
= �� − � � � [ − �
− � �] (13)
where INR = Instantaneous Net Radiation
t = overpass time of sensor at which INR is computed � and = sunrise and sunset times respectively
net outgoing longwave radiation during the night-time hours can be calculated. The incoming longwave radiation for the night-time hours are calcuated using the Brutsaert (1975) method using the observations from the IMD AWS network.
The night-time downwelling longwave radiation is given by,
, = ∫
The night-time upwelling longwave radiation is given by,
, = ∫
The night-time net longwave radiation ( ) is then obtained by summing the above two components.
= , + , (16)
The daily net radiation is calculated by simply adding Rnd and components.
3. RESULTS AND DISCUSSION 3.1 Daily Net Surface Radiation Products
Daily net surface radiation products corresponding to the four dates of November 19, 2013, December 16, 2013, January 8, 2014 and March 20, 2014 are generated at 0.1° uniform grid spacing for Indian landmass using the two methods described in previous sections.
Figure 1. Daily net surface radiation estimated at 0.1° grid scale for November 19, 2013 using (a) Approach 1 and
(b) Approach 2
Figures (1a) and (1b) show the net surface radiation products of November 19, 2013. Visual comparison of these products indicates gross variation of estimates between the two approaches, especially in southern regions. Similar results are observed in the estimates for the other three dates. This is expected due to the fact that the first approach considers all sky condition at every stage of computation while the second considers clear sky condition at most of computation stages. 3.2 Comparison with CERES Products
The Clouds and the Earth’s Radiant Energy Systems (CERES) program of NASA is one of the few sources of currently available Earth Radiation Budget data. The daily net radiation estimates of the two approaches are compared with CERES SYN1deg Ed3A Level 3 daily average net radiative fluxes. The radiative fluxes in the Level 3 SYN1deg product are produced from temporally interpolated CERES top of atmosphere radiative fluxes combined with MODIS derived cloud and aerosol properties and include geostationary satellite derived cloud properties and broadband fluxes. The CERES SYN1deg Ed.3A product which has been used for reference daily net radiation estimates, is currently undergoing evaluation and is expected to have greater surface radiative fluxes accuracies than the Level 2 SSF product which has accuracies varying between 17 – 25 W/m2 for the downward longwave and 73 – 89 W/m2 for the downward shortwave, respectively depending upon the type of surface under study. The daily net radiation fluxes computed at 0.1° grid intervals are upscaled to 1° grid spacing to match with that of CERES. The daily net radiation retrieved using Approach 2 is valid only for clear-sky conditions. Hence, only the CERES data with more than 90% clear sky percentage are used for comparison against Approach 1. The daily net radiation retrieved using Approach 1 is however valid for all-sky conditions and hence all the corresponding applicable grid estimates are compared against the CERES estimates.
without considering direction. In this averaging process, all of the individual differences are weighted equally.
Figure 2. Daily net surface radiation flux on November 19, 2013, upscaled to 1° by (a) Approach 1 and (b) Approach 2 for
comparison with (c) CERES based product
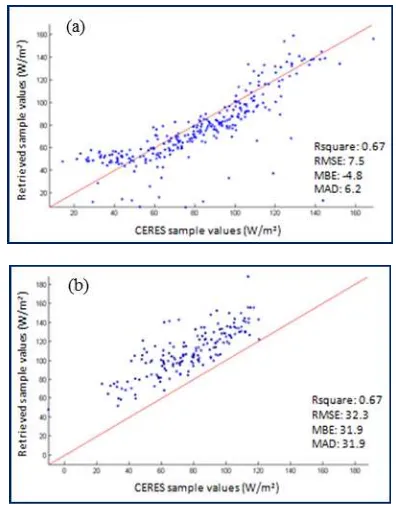
Scatter plots are prepared using retrieved daily net radiation sample values and CERES based sample values for all the four days and are provided in Figures 3 to 6.
Figures (3a) and (3b) pertain to November 19, 2013. The r2 values of 0.7 for estimates by both the approaches indicate that there is better degree of linear association with CERES estimates. However, the larger RMSE (34.2 W/m2) of Approach 2 suggests that there exists significant large deviations of estimates. Also, the high positive MBE highlights the overestimation by this approach.
Figures (4a) and (4b) pertain to December 16, 2013. All the four statistical parameters record almost the similar values as for November 19, 2013 indicating better degree of linear association of retrievals by both the approaches with CERES estimates and over estimation by the second approach.
Figure 3. Scatter plots of valid CERES sample values and values retrieved by (a) Approach 1 and (b) Approach 2
corresponding to November 19, 2013
Figure 4. Scatter plots of valid CERES sample values and values retrieved by (a) Approach 1 and (b) Approach 2
Figures (5a) and (5b) pertain to January 8, 2014. The Approach 1 yielded better value of 0.79 compared to the Approach 2 which recorded a value of 0.57. The remaining parameters are also observed better for Approach 1 than Approach 2. As for the previous dates, Approach 2 overestimates. Approach 1 also overestimates contrary to the previous dates, but marginally with MBE of + 3.1 W/m2.
Figure 5. Scatter plots of valid CERES sample values and values retrieved by (a) Approach 1 and (b) Approach 2
corresponding to January 8, 2014
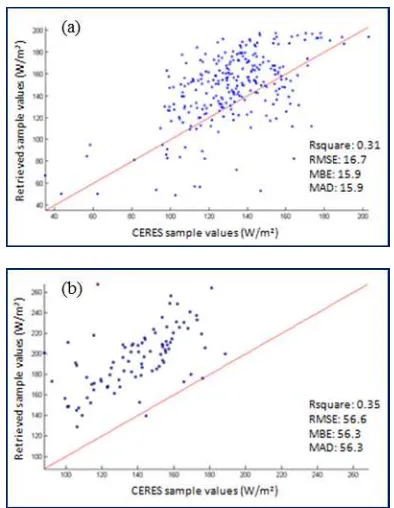
Figure 4. Scatter plots of valid CERES sample values and values retrieved by (a) Approach 1 and (b) Approach 2
corresponding to March 20, 2014
Figures (6a) and (6b) pertain to March 20, 2014. Both, Approach 1 and Approach 2 provided poor r2 values of 0.31 and 0.35, respectively. Also, they overestimated CERES values and with significant deviations. Compared to Approach 2, better values of RMSE, MBE and MAD are recorded by Approach 1.
4. CONCLUSIONS
The feasibility of computing the components of surface radiation fluxes using satellite based geophysical parameter products and point observed meteorological parameter data and generating daily net surface radiation products at 0.1° grid intervals have been demonstrated. Statistical comparison of retrieved net radiation values with CERES based estimates at 1 degree grid spacing indicated good overall agreement. Of the two approaches employed in this study, the first approach using Kalpana VHRR derived insolation and Oceansat OCM2 based shortwave albedo parameters is promising better than the other, towards generating all sky daily net surface radiation products. The Approach 1 yielded higher r2 value of about 0.8, better RMS error of about 8.0 W/m2 and lower Mean Bias Error of about 3.0 W/m2, when compared to CERES estimates. With acceptable accuracy achieved in this study though with inherent high uncertainties of input parameters, these products can find applications in regional energy and moisture flux studies of the climate system.
ACKNOWLEDGEMENTS
The authors wish to acknowledge the support, encouragement and guidance provided by Dr C B S Dutt, Deputy Director, ECSA, NRSC and Dr V K Dadhwal, Director, NRSC for carrying out this work.
The CERES SYN1degEd3A data used in this study were obtained from the Atmospheric Science Data Center at the NASA Langley Research Center.
REFERENCES
Allen, R.G., Pereira, L.S., Raes, D. and Smith, M., 1998. Crop evapotranspiration – Guidelines for computing crop water requirements, Irrigation and drainage paper 56, United Nations Food and Agriculture Organization, Rome, 15pp.
Blad B.L., E.A. Walter‐Shea , M.A. Mesarch , C.J. Hays , P.J. Starks , D.W. Deering & T.F. Eck, 1998. Estimating net radiation with remotely sensed data: Results from KUREX‐91 and FIFE studies, Remote Sensing Reviews, 17:1-4, 55-71. Bisht G., V. Venturini, L. Jiang, and S. Islam, 2005. Estimation of the net radiation using MODIS data for clear sky days, Remote Sens. Environ., vol. 97, no. 1, 52–67.
Brutsaert, W., 1975. On a derivable formula for long-wave radiation from clear skies. Water Resources Research, 11, 742-744.
Lagouarde, J. P. and Brunet, Y., 1983. A simple model for estimating the daily upward longwave surface radiation flux from NOAA–AVHRR data. International Journal of Remote Sensing, 14(5), 907–925.
Liang, S., 2004. Quantitative remote sensing of land surfaces, Hoboken, NJ: Wiley.
Liang, S., Wang, K., Zhang, X., and Wild, M., 2010. Review on estimation of land surface radiation and energy budgets from ground measurement, remote sensing and model simulations. IEEE Journal of Selected Topics in Applied Earth Observations and Remote Sensing, 3, 225-240.
Liang, S., Xiaowen Li and Jindi Wang (Ed.), 2012. Advanced remote sensing: terrestrial information extraction and applications, Oxford, Academic Press, 799 pp., ISBN 978-0-12-385954-9
Wielicki, B. A., B. R. Barkstrom, E. F. Harrison, R. B. Lee III, G. L. Smith, and J. E. Cooper, 1996: Clouds and the Earth's Radiant Energy System (CERES): An Earth Observing System Experiment, Bull. Amer. Meteor. Soc., 77, 853-868.
Xiong, Y.J., Qiu, G.Y., Yin, J., Zhao, S.H., Wu, X.Q., Wang, P. and Zeng, S., 2008. Estimation of daily evapotranspiration by three-temperatures model at large catchment scale, The International Archives of the Photogrammetry, Remote Sensing and Spatial Information Sciences. Vol. XXXVII. Part B8, 767-774.
Yan, H., Huong, J., Minnis, P., Wang, T. and Bi, J., 2011. Comparison of CERES surface radiation fluxes with surface observations over Loess Plateau, Remote Sensing of Environment, 115, 1489-1500.