3D CASE STUDIES OF MONITORING DYNAMIC STRUCTURAL TESTS
USING LONG EXPOSURE IMAGERY
D. M. J. McCarthy a, J. H. Chandler a, A. Palmeri a
a
School of Civil and Building Engineering, Loughborough University, UK - (d.mccarthy, j.h.chandler, a.palmeri)@lboro.ac.uk
Commission V, WG V/1
KEY WORDS: Vibration, Engineering, Monitoring, Long Exposure Imagery, Image Processing, Close Range Photogrammetry
ABSTRACT:
Structural health monitoring uses non-destructive testing programmes to detect long-term degradation phenomena in civil engineering structures. Structural testing may also be carried out to assess a structure’s integrity following a potentially damaging event. Such investigations are increasingly carried out with vibration techniques, in which the structural response to artificial or natural excitations is recorded and analysed from a number of monitoring locations. Photogrammetry is of particular interest here since a very high number of monitoring locations can be measured using just a few images. To achieve the necessary imaging frequency to capture the vibration, it has been necessary to reduce the image resolution at the cost of spatial measurement accuracy. Even specialist sensors are limited by a compromise between sensor resolution and imaging frequency.
To alleviate this compromise, a different approach has been developed and is described in this paper. Instead of using high-speed imaging to capture the instantaneous position at each epoch, long-exposure images are instead used, in which the localised image of the object becomes blurred. The approach has been extended to create 3D displacement vectors for each target point via multiple camera locations, which allows the simultaneous detection of transverse and torsional mode shapes. The proposed approach is frequency invariant allowing monitoring of higher modal frequencies irrespective of a sampling frequency. Since there is no requirement for imaging frequency, a higher image resolution is possible for the most accurate spatial measurement. The results of a small scale laboratory test using off-the-shelf consumer cameras are demonstrated. A larger experiment also demonstrates the scalability of the approach.
1. INTRODUCTION
In civil engineering, it is often necessary to detect long-term degradation phenomena in existing structures using structural health monitoring programmes. Structural testing may also be required to assess integrity due to a change of use or following a potentially damaging event. The development of new materials also demand advanced monitoring instrumentation to more fully understand the processes involved.
The benefits of photogrammetric monitoring can be realised for structural testing. The approach allows non-contact monitoring of displacements at many monitoring locations distributed across the structure. For monitoring of vibrations the same approach has been used, but the potential is limited by the capabilities of imaging hardware. This paper describes the use of an alternative approach using longer exposures to capture the motion within motion-blurred images, which are processed with a bespoke algorithm. The approach has now been extended in to three dimensions. Two case studies are contained in this paper, demonstrating the approach for monitoring vibrations in model structures in 3D. Visualisations of the 3D motion vectors demonstrate the captured detail.
2. DYNAMIC STRUCTURAL TESTING 2.1 Monitoring structures
When testing civil engineering structures, non-destructive test techniques are usually utilised for most existing structures.
Dynamic test techniques are of particular interest, since the vibration response is sensitive to more subtle structural properties. The vibration response to artificial or natural excitation is recorded and analysed using specialised approaches. For instance, a reduction in modal frequencies would possibly indicate a concentrated loss of stiffness due to the presence of damage, but this information alone cannot determine the location or severity of damage and would require further investigation. Richer information comes from the analysis of the modal shapes, as changes in the curvature of the modal shape or in the position of nodes and antinodes may allow estimates of the location and severity of the structural damage (Pandey et al., 1991).
In order to detect these modal shapes, a number of sensors are distributed on a structure. A higher number of monitoring locations is desirable since interpolation is necessary between data points. Past studies also show that the best results are found with a higher number of sensors (Carden & Fanning, 2004). Contact accelerometer gauges are conventionally used, but practical limitations exist as each additional accelerometer adds hardware cost and requires cabling and data collection infrastructure. The highly specialised laser Doppler vibrometer (an optical instrument that measures vibration by detecting frequency shifts in a reflected laser beam) can be used, but remains expensive and takes time for the measuring laser beam to be moved systematically to each monitoring location. Photogrammetry is of interest here since a high number of monitoring locations can be measured using just a few imaging sensors.
3. PHOTOGRAMMETRIC MONITORING OF STRUCTURAL DYNAMICS
Photogrammetry has proven capabilities for accurate spatial measurement. Advantages include that it is non-contact, relatively inexpensive for the amount of data collected, and the capability of measuring many locations simultaneously. Photogrammetry has been used for monitoring static deformations in structural testing by making repeated measurements, and calculating the change in measurements between subsequent measurement epochs. (Maas & Hampel, 2006; Yoneyama et al., 2007; Ronnholm et al., 2009).
Since monitoring of dynamic structural properties is emerging as a tool for structural assessment, it is natural progression to apply photogrammetric monitoring to the dynamic monitoring case. Studies have already applied photogrammetric monitoring to tests utilising dynamic techniques (Olaszek, 1999; Jurjo et al., 2010; Choi et al., 2011). The principle has remained the same, but imaging frequency is increased to many frames per second in order to capture vibrations. The Nyquist criterion states that, to be able to detect vibrations of a given frequency, it is necessary to sample the data at double the vibration frequency or more (Morlier et al, 2007). Where photogrammetric monitoring has been applied using sensors capable of higher imaging frequencies, structural properties have been successfully identified, however, it is often necessary to reduce the image resolution at a cost of spatial measurement accuracy due to hardware limitations.
Consumer-grade DSLR cameras are capable of very high image resolutions, including up to 30MP, but at this resolution they are limited to recording only a few continuous image frames per second (fps), insufficient for monitoring most vibrations. Consumer grade video cameras, which record at up to 60 fps and are more suitable to monitoring vibrations, but these sensors tend to be limited to 2MP (‘HD’ 1080p resolution). Even specialist sensors are limited by a compromise between sensor resolution and imaging frequency.
Some authors have improved measurement accuracy by ‘zooming-in’ to individual measurement points. Whilst providing sufficiently accurate measurement at these locations, the advantage of simultaneous monitoring of multiple points, a particular advantage of photogrammetric monitoring, is lost. The literature review noted how for structural assessment using dynamic techniques, ‘modal-shapes’ are most accurately determined where interpolation is reduced with a higher number of monitoring points.
4. METHODOLOGY
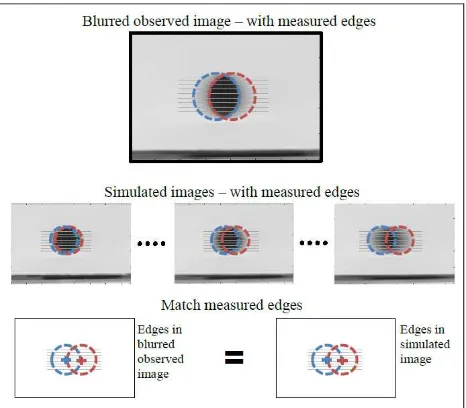
To alleviate this compromise, a different approach has been developed. Instead of using high-speed imaging to capture the instantaneous position at each epoch, long-exposure images are used in which the localised image of the object becomes blurred (McCarthy, 2013). This paper describes tests where the approach has been further developed to demonstrating 3D. Ordinary circular targets are used since their motion-blurred appearance is predictable. A bespoke Matlab routine using Matlab’s image processing toolbox determines two image coordinates at each target (Figure 1). 3D displacement vectors can be determined with multiple camera locations, which is of interest since simultaneous detection of transverse and torsional mode shapes is then possible.
Figure 1. Motion-blurred target measurement algorithm
4.1 Experimental approach
Model structures were built in a laboratory and testing methodology developed. Ordinary circular targets were placed on the model in the conventional way. These targets were not coded, since the broken ring of a motion-blurred coded target disturbs the appearance and measurement of the centre circle. Other coded control targets are arranged around the test subject for independent reference in the conventional way. In our implementation, an unblurred image is also captured which is used by the target measurement algorithm to improve accuracy. This sharp image may be taken before dynamic excitation is applied or, in the case of natural excitation, simply a short exposure image with appropriately adjusted exposure settings.
Two or more cameras are arranged on tripods to achieve a suitable base-to-distance ratio as is normally desired in photogrammetric measurement. The control targets located in images remain stationary and unblurred, and are read into the PhotoModeler Motion software package (EOS Systems, 2014) for determining the cameras exterior orientation. Interior orientation is also determined using PhotoModeler’s automated camera calibration and a camera calibration field.
Registration of the motion-blurred images is done using the Matlab script. After determining 2D image coordinates, a space intersection algorithm then determines 3D coordinates at either end of each target’s motion path. From this pair of 3D coordinates, the motion distance and direction are determined and plotted on to a figure.
Difficulty referencing measurements between images was encountered, since at each target in each image where there would normally be only a single measurement, two measurements exist at either end of the motion path (figure 2). This was further complicated by the fact that there is no possibility for unique coding, since they originate from the one same physical target. Figure 3 shows the results produced by both combinations and how it produces motion vectors in different directions. It is possible in some cases to determine the correct combination by engineering judgement, but a more reliable approach was to select the combination that produced the smallest image residuals.
Care had to be taken arranging cameras when only two are in use, since if the relative positions of two cameras are in the same direction as the test subject’s motion, the image residuals of both combinations will be similarly small. In these case studies the motion was expected to be broadly horizontal, so the cameras were arranged at different levels on different height tripods.
Figure 2. Ambiguity exists in matching motion ‘ends’ which exist from the same target.
Figure 3. Unresolved measurement matching produced two possible motion vectors.
5. CASE STUDIES 5.1 Small scale shaker table models
A 780 mm tall 2D plastic model was fitted on to a structural dynamics shaker table, to observe its response to different vibrations (figure 4). The shaker table used was a 1 dimensional APS400 shaker table. The table can induce vibration of varying frequencies, amplitudes and waveforms to model structures fitted to its surface. The movement of the table is controlled by a laptop and a Matlab routine. Different types of accelerometer are available in the structural dynamics laboratory and the motion of the table is accurately monitored by a laser displacement gauge.
The cameras used were two Nikon D80 10.2 megapixel cameras with 24 mm fixed focal length lenses. Both cameras were connected to the same remote shutter so that they are both triggered simultaneously. Black circular 8 mm targets with a white background were distributed over the model structure, as well as on the table surface itself. A number of coded control targets were supported on stands around the model, and their positions measured using a total station in reflectorless mode.
The natural frequencies of the model were determined using an accelerometer. Vibration was applied at these frequencies and images were captured recording the structure’s response to each motion. Images were then processed using the process described above to determine image coordinates, and 3D object-space coordinates were determined using the space intersection algorithm.
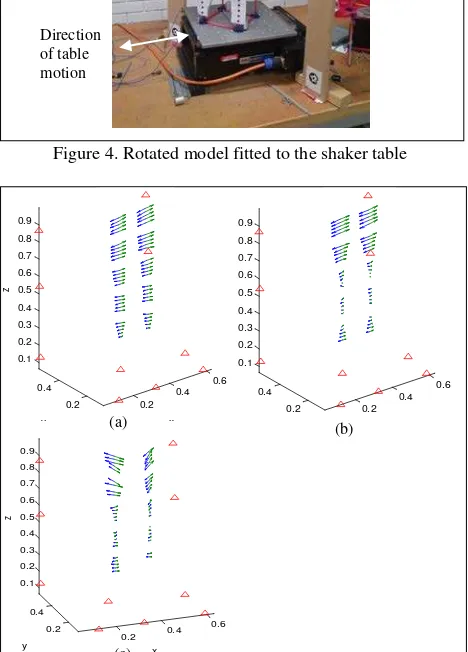
The shaker table can apply only 1D excitation, but 3D motion can be created with an appropriately asymmetric physical structure. Figure 5 shows three vibration envelopes exhibited by the model structure when vibrated at different frequencies on the shaker table. Figures 5a and 5b both show lateral motion of the model, and 5b shows the detail of the model’s curvature. Figure 5c, shows how the top of the model is exhibiting 3D torsional motion.
Figure 4. Rotated model fitted to the shaker table
Figure 5. Captured vibration envelopes of the model structure.
The model was repositioned on the shaker table so that the table motion was diagonally across the model (figure 4). Figure 6 shows further vibration envelopes that were captured. In particular, Figure 6a shows how the torsional curvature of the
Direction of table motion
Control points
Model structure Monitoring
points
0.2 0.3 0.4 0.5 0.6 0.7 -0.050
0.05 1.2 1.3 1.4 1.5 1.6 1.7 1.8 1.9
x
z
y
0.2 0.4
0.6
0.2 0.4 0.1 0.2 0.3 0.4 0.5 0.6 0.7 0.8 0.9
x y
z
0.2 0.4
0.6
0.2 0.4 0.1 0.2 0.3 0.4 0.5 0.6 0.7 0.8 0.9
0.2 0.4
0.6 0.2
0.4 0.1 0.2 0.3 0.4 0.5 0.6 0.7 0.8 0.9
x y
z
(a) (b)
(c)
modal, which starts in the direction of the applied diagonal motion at the base of the structure, and ends at the top of the structure where the motion is across the model’s axis.
Figure 6. Captured vibration envelopes of the rotated model structure.
5.2 Vertical timber section
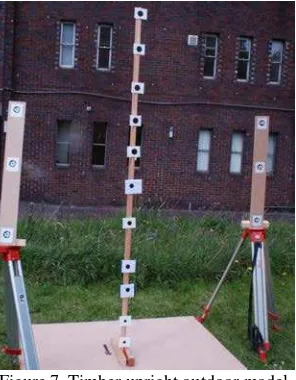
A larger model was constructed to demonstrate how the approach is scalable and how the test remains effective in outdoor conditions. This larger model was a 2.4 m tall vertical timber section which was fixed to another flat piece of wood. As before, D80 cameras were used, coded control targets were placed either side of the test subject and their coordinates were measured using total station in reflectorless mode. Larger monitoring targets were used to reflect the changed image scale (figure 7).
Figure 7. Timber upright outdoor model.
The timber upright was excited manually in the X and Y axis. The objective here was to examine the curvature of the vibration envelope rather than identify nodes. Figure 8 gives the motion vectors for motion in the X and Y directions. Since the stiffness of the section in the minor axis is greater than the major axis, it would be expected that the vibration amplitude is more in this direction with a similar excitation.
It was found that whilst working outside, images would be overexposed by the brighter sunlight, even on the camera’s lowest sensitivity settings. Neutral density filters were used to bring sensor exposure into an acceptable range.
Figure 8. Captured vibration envelopes of the vertical timber as a result of excitation in the (a) X and (b) Y axis.
6. DISCUSSION
These experiments have demonstrated how long exposure imagery can be used for monitoring dynamic tests of vibrating structures. The approach overcomes inherent limitations in the high frequency imaging for monitoring vibrations which is limited to lower image resolutions.
The 3D experiments demonstrate the advantage of the photogrammetric technique over traditional sensors such as accelerometers. The approach is frequency independent, and frequencies up to 12 Hz have been recorded successfully, beyond the Nyquist frequency of 1.5 Hz (considering the 3 fps the Nikon D80 camera is capable of). The cameras used were off-the-shelf DSLR cameras, making the cost of the system considerably less than the highly specialised laser Doppler vibrometer, or using many accelerometers.
Accelerometers are contact sensors, so many are required to record the varying vibration throughout a structure. Alternatively, it is possible to systematically move an accelerometer to each monitoring location if vibration can remain constant. If multiple sensors are used, each additional monitoring location requires additional hardware, and requires cabling infrastructure and data logging hardware, increasing cost and set up time. Each additional monitoring point in this case requires only the addition of adhesive paper targets, so increased cost and set-up time is very low. The simplest accelerometer is one-dimensional, although three-dimensional accelerometers are available at additional cost. The laser Doppler vibrometer overcomes some of the limitations of accelerometers by making optical measurements from a remote observation point, but this instrument is limited to measuring out-of-plane movement only, and remains expensive.
All the motion vectors presented in the paper are represented by double-ended arrows. This is because it is not possible to determine the direction of the motion at the time the image is captured. Although the traditional high speed imaging approach allows instantaneous motion direction to be discerned between successive images, but it has not prevented the vibration envelope from being visualised with this approach.
The motion-blurred target measurement algorithm is less accurate than methods used for measurement of ordinary sharp images. However, alleviating the need for high speed imaging allows different hardware to be used, and images can be of a
0.5
higher resolution than would otherwise be possible. The image resolution of consumer level DSLR cameras is much higher than that used by camcorders that have previously been used for their higher imaging frequency. Unfortunately, the bespoke algorithm for measuring motion-blurred targets also has a longer duration than conventional sharp circular target measurement algorithms. However, the whole motion is captured within a single image so only the one image needs to be processed, rather than a long sequence of images. This also has advantages in terms of data storage and transmission, since the total file size for a long sequence of images would be very large.
Having fewer image files is also advantageous to real-time monitoring, which requires images to be downloaded to a computer and processed at the same rate at which they are acquired. Real time monitoring using the conventional approach has only been demonstrated possible at a reduced image resolution. The arrangement of artificial monitoring and control targets, and camera observation positions, is almost the same to that previously used for the monitoring of static deformation (Lange & Benning 2006; Ronnholm et al. 2009). In this way, the monitoring scheme can be used to monitor any static deformations also.
An additional constraint in camera positioning existed due to the difficulty in matching measured target ‘ends’. As noted in figure 2, only one combination is correct, and this combination can usually be identified by selecting the case that produced the smallest image residual measurements. However, if only two cameras are used, and the cameras were arranged so that their relative positions are in the same direction as the motion of the test subject, both combinations produce similarly small coordinate residuals. This situation can be avoided by using more than two cameras, or by having ‘a-priori’ knowledge of expected vibration directions and suitably arranging the cameras.
The determined data is different to the traditional monitoring approach which determines natural frequencies by analysing acceleration history with a discrete Fourier transform, rather emphasising measurement of the vibration envelope. This approach could accompany traditional acceleration gauges for more detailed data, or used with frequency-selective excitation, where tests make use of artificial exciters. In this way it is not a complete replacement for traditional specialist dynamic monitoring instruments, indeed the approach currently does not provide the same level of accuracy, but aims to provide more detailed information.
7. CONCLUSIONS
This paper has presented two case studies of photogrammetric monitoring of vibrating structures using localised motion-blurred image patches. The case studies have shown how the measurement approach provides richer 3D detail for visualising the vibration envelope, using consumer grade imaging hardware. The scalability of the approach is demonstrated. The frequency invariance means that monitoring of higher frequency vibrations, where photogrammetric monitoring has in been limited to lower image resolutions in the past, is possible with higher image resolutions, and hence better spatial measurement accuracy. They approach has been effectively used to record vibrations of up to 12 Hz.
Additional measurement matching complications not normally found in photogrammetric monitoring were identified, and how they can normally be resolved discussed. Although each target
itself can be easily matched between images, the ‘end’ of each target’s motion path cannot be uniquely coded, and selecting the combination with the smallest target residuals was effective in most cases. Another complication was the outdoor brightness level which caused images to be overexposed, which was overcome by using Neutral Density filters.
8. REFERENCES
Carden, E.P. & Fanning, P., 2004. Vibration Based Condition Monitoring: A Review. Structural Health Monitoring, 3(4), pp. 355–377.
Choi, H.-S., Cheung, J.-H., Kim, S.-H., Ahn, J.-H., 2011. Structural Dynamic Displacement Vision System using Digital Image Processing. NDT & E International, 44(7), pp. 597–608.
EOS Systems, 2015. PhotoModeler Motion Overview, Vancouver, Canada
http://www.photomodeler.com/products/motion/default.html (14 Apr. 2014).
Jurjo, D.L.B.R., Magluta, C., Roitman, N., Gonçalves, P.B., 2010. Experimental methodology for the dynamic analysis of slender structures based on digital image processing techniques.
Mechanical Systems and Signal Processing, 24(5), pp. 1369–
1382.
Lange, J. & Benning, W., 2006. Crack detection at concrete construction units from photogrammetric data using image processing procedures. In: Proceedings of the ISPRS
Commission VII Symposium “Remote Sensing: From Pixels to
Processes.” Enschede, The Netherlands. Vol. XXXVI, Part 7,
pp. 15-19.
Maas, H. & Hampel, U., 2006. Photogrammetric Techniques in Civil Engineering Material Testing and Structure Monitoring.
Photogrammetric Engineering & Remote Sensing, 72(1),
pp. 39–45.
McCarthy, D.M.J., Chandler, J.H. & Palmeri, A., 2013. Monitoring Dynamic Structural Tests Using Image Deblurring Techniques. In: Key Engineering Materials. Dublin, Ireland, pp. 932–939.
Morlier, J., Salom, P. & Bos, F., 2007. New Image Processing Tools for Structural Dynamic Monitoring. In: Key Engineering
Materials. Oxford, UK, pp. 239–244.
Pandey, A., Biswas, M. & Samman, M., 1991. Damage detection from changes in curvature mode shapes. Journal of
Sound and Vibration, 145(2), pp. 321–332.
Olaszek, P., 1999. Investigation of the dynamic characteristic of bridge structures using a computer vision method.
Measurement, 25(3), pp. 227–236.
Ronnholm, P., Nuikka, M., Suominen, A., Salo, P., Hyyppa, H.,Pontinen, P., Haggren, H., Vermeer, M., Puttonen, J., Hirsi, H., 2009. Comparison of measurement techniques and static theory applied to concrete beam deformation. The
Photogrammetric Record, 24(128), pp. 351–371.
Yoneyama, S., Kitagawa, A., Iwata, S., Tani, K., Kikuta, H, 2007. Bridge deflection measurement using digital image correlation. Experimental Techniques, 31(1), pp. 34–40.