EXTRACTION OF BUILIDNG SHAPE FROM TANDEM-X DATA
A. Thiele a,b *, M. M. Wurth a, M. Even b, S. Hinz a
a
Institute of Photogrammetry and Remote Sensing (IPF), Karlsruhe Institute of Technology (KIT), Karlsruhe, Germany (antje.thiele, stefan.hinz)@kit.edu
b
Fraunhofer Institute of Optronics, System Technologies and Image Exploitation (IOSB), Ettlingen, Germany (antje.thiele, markus.even)@iosb.fraunhofer.de
KEY WORDS: TanDEM-X, Interferometry, Building Detection
ABSTRACT:
Large scale mapping and modeling of urban areas is requested in many fields, especially in planning of energy supply and for change detection. For this purpose, SAR systems are highly attractive due to their independency of daytime and weather. The new satellite configuration of TerraSAR-X and TanDEM-X provides single-pass 3D mapping of the earth with unprecedented geometric resolution, allowing for improved detection and extraction of building positions and shapes.
In this paper, single-pass interferograms of the TanDEM-X mission are utilized to automatically reconstruct buildings. To this purpose, first an interferogram is calculated from a TanDEM pair. Then, a new detector is applied that analyses phase ramps in the interferogram. Phase ramps being a pattern typically observable in layover areas of buildings, the detector is able to indicate building locations. Afterwards, the detected building areas are analyzed in more detail to extract width, length, and height of the buildings. Last, an edge detector is applied to deduce the building shapes. The reconstruction results are compared with reference data.
* Corresponding author. This is useful to know for communication with the appropriate person in cases with more than one author. 1. INTRODUCTION
Since 2011, the new satellite configuration of TerraSAR-X and TanDEM-X delivers high resolution single-pass InSAR data (Krieger et al. 2009). These new data prepare the ground for new applications; in particular, methods to automatically derive cartographic information are desirable. One major challenge is the monitoring of urban areas especially in case of disasters, where SAR systems are capable of providing information independent of daytime and weather.
In recent work on building extraction from spaceborne SAR and InSAR data two main trends can be distinguished. First, analysis of single SAR images with fast applicability, but showing drawbacks in dense urban areas. Second, analysis of InSAR time series which provides results of high precision, but takes a long time to acquire the data.
The first group utilizes the intensity signatures of buildings. In (Brunner et al. 2010), a top down approach is presented, in which simulated building signatures are compared with real SAR images to enable the detection of collapsed buildings after earthquakes. Bottom up strategies are given in (Zhang et al. 2011), (Barthelet et al. 2012), and (Ferro et al. 2013) where, based on detected intensity features (e.g. layover, corner, shadow), building hypotheses are generated and rated. The second group investigates the interferometric phase signature of buildings, and particularly point scatterers at façades, which allows for the detection of slight motions (e.g. Gernhardt & Bamler 2012).
The TanDEM configuration establishes the new opportunity of exploiting interferometric phase acquired during a single pass of the two satellites, which minimizes the effect of decorrelation on building extraction. Our concept of exploiting these data for
3D building reconstruction is presented in this paper, which is structured as follows. First, the InSAR signature of buildings in TanDEM-X data is discussed. Afterwards, in section 3, the developed approach is described. The results are presented in section 4. Finally, we give conclusions and an outlook on our work.
2. SIGNATURE ANALYSIS
In this section, we first specify the utilized data sets of the TanDEM-X configuration. Then we give the definition of the building model taken as basis of our reconstruction approach. Additionally, the signature of buildings in high resolution InSAR data is described and discussed.
2.1 Test Data
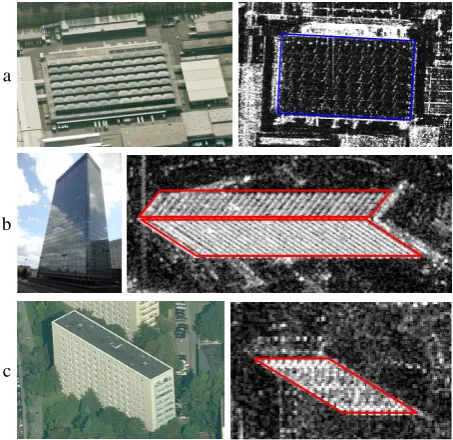
The high-resolution TanDEM-X science data are provided by the DLR as additional product independent from the TanDEM mission to derive the global Digital Elevation Model (DEM). The high-resolution SpotLight data used for this study are taken over Paris and Berlin with a bandwidth of 300 MHz. They have comparable effective baselines of approximately 107 m, but due to different off-nadir look angles heights of ambiguity are 52 m and 65 m. The pixel spacing in range is approximately 90 cm in azimuth and 60 cm in range direction. Furthermore, both data sets are recorded from ascending orbit at begin of January 2012. In the following, detailed results are only shown for parts of the scenes. We will focus on the tower building Tour Initiale in Paris (Figure 1b) and apartment houses along the Alexander Street in Berlin (Figure 1c).
2.2 Building Model
As demonstrated in previous work (e.g. Thiele et al. 2010a), the appearance of characteristic building features depends on the building geometry and properties as well as on the direct neighborhood. Hence, as preparatory work for the bottom up process of building reconstruction, we analyzed the two test datasets to define a proper building model.
In Paris as well as in Berlin, three building types are easily detectable – industrial halls, tower buildings, and apartment houses. Examples of signature of all three are given in Figure 1. Of course, in inner districts of the towns, the situation is often more complex and classification is difficult. Hence, we start with right-angled buildings having a flat-roof and whose signature not overlaying each other. The assumed building model is shown in Figure 2. It is defined by the parameter vector P=(l, b, h, ρ). In the next subsection, the InSAR signature of such buildings is described.
2.3 Building Signature
The InSAR signature of buildings shows characteristic features concerning intensity (Figure 3b), coherence (c), and interferometric phase (d). The most remarkable phenomena are layover area (red), corner lines (yellow), roof area with single backscatter (blue), and shadow area (white). The subsequent descriptions of the radiometric and geometric characteristics are
referring to the signature in TanDEM data as given in Figure 3.
Intensity: The layover area shows mostly patterns of high
contrast that are caused by regular façade structures. In the given example, the contrast is less distinct due to the rough concrete walls (cp. optical data (a)). The corner line located at the building footprint is characterized by a high intensity due to the superposition of all double-bounce backscattering between building wall and ground. Medium intensity and less prominent patterns are found in the roof area. The building shadow has very low intensity values since no radar signal is returned from this area.
Coherence: Layover area and corner line are characterized by high coherence (bright pixels). The appearance of the roof area varies between low and high values depending on roof material. The signal in shadow areas stems from sensor noise and has low coherence.
Phase: In InSAR phases, the layover is often characterized by a
linear ramp in range direction. It has a decreasing slope from near to far range. At the corner line, a constant phase value occurs that corresponds to the local terrain level. For flat-roofed buildings, phases of the roof area are constant and correspond to roof height. Shadow areas have uniformly distributed phase values.
Shape: Assuming rectangular buildings, layover is characterized
by two parallelograms each having two sides parallel to slant-range direction. If the building is not oriented parallel to azimuth direction, the building corners have L-shape. By completing it to a parallelogram the building footprint can be deduced. Shapes of roof and shadow areas can be described by a rectangle and a polygon, respectively.
Returning to the three buildings shown in Figure 1, the most remarkable areas are the red framed colored layover and the blue framed colored roof. In preliminary investigations, we studied pattern detectors to classify these areas according to texture in the intensity data (e.g. regular patterns). Due to the fact that such structures depend on façade and roof conditions as well as the illumination geometry, it was difficult to achieve reliable results. Hence, we decided to mainly make use of the
a
b
c
Figure 1: Typical building types in urban area: optical and intensity signature of an industrial hall (a, source: Bing ), the tower building Tour Initiale (b), and an apartment house in
the Alexander Street, Berlin (c, source: Bing)
Figure 2: Building model
b c d
a
Figure 3: Building signature in optical data (a, source: Bing), intensity (b), coherence (c), and interferometic phase data (d), building layover (red), corner (yellow), roof area (blue), radar shadow (white)
interferometric phase signature. We will see later that it shows distinctive features in the layover areas, which are taken into account during the building detection and reconstruction steps.
3. BUILDING EXTRACTION
Our general approach of building extraction will be described briefly in the following subsection. The crucial steps of detection of phase ramps, extraction of building patches and of building shape are discussed in more detail afterwards.
3.1 Workflow
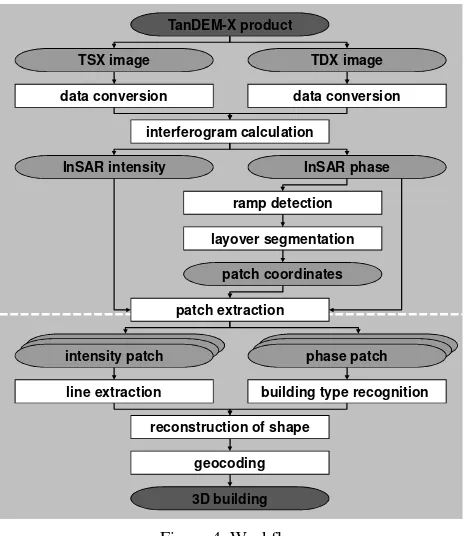
The workflow depicted in Figure 4 is subdivided in two parts (see white dashed line). The upper one consists of processing steps performed on the complete scene and the lower one of processing steps working on image patches containing a single building signature.
Since the interferograms provided with the data sets are reduced in spatial resolution, we decided to recalculate the TanDEM interferograms. The processing starts with the import of the CoSSC data files, the interferogram calculation, and the flat-earth correction. More information concerning TanDEM-X data can be found in (Balss et al. 2012) and (Fritz et al. 2012). On the interferograms the new phase ramp detector is applied to and layover regions are segmented. On the segmented InSAR image patches, a detailed analysis is carried out to retrieve the parameters of the building model. Finally, the footprints of the extracted buildings are geocoded.
3.2 Detection of Phase Ramps
The building detection starts by analyzing the full scene to expose layover areas that hint to building locations. An example of a fully developed layover area is given in Figure 5a. The corresponding phase profile is depicted in (b) showing the typical saw tooth pattern, as the building height is about twice the height of ambiguity.
This observation leads us to generate a synthetic phase ramp as search pattern. Its gradient is defined by the parameters of the TanDEM pair – height of ambiguity, off-nadir look angle, and slant-range pixel spacing. The implemented detector D determines the difference between InSAR phases (Figure 5b, blue line) and synthetic phase ramp ϕs (Figure 5b, red line):
∑
twice – running from near to far range (see Figure 5b, red point at the left end of the red line) and vice versa to achieve sharper edges in the detector image. From these two intermediate results, the final detector result is obtained by applying minimum operator. The detection result is visualized in Figure 5c, where bright areas characterize high correlation between InSAR phases and synthetic phase ramp. It can be seen that phase jumps in the layover signature do not affect the result.The tricky point using that detector is the choice of a proper length of the synthetic phase ramp. We will discuss this in section 5.
3.3 Extraction of Building Patches
Based on the detector image, an iterative segmentation is applied to extract patches containing a single building. The algorithm described in (Toennies 2005) searches for a connected region R starting at an initializing image pixel. Pixels in the neighborhood of R are assigned to R if their pixel values are similar to the average value of the region R. For that, a tolerance of variance is defined. Furthermore, a dilatation is applied on the segments to achieve more convex regions. geocoding
intensity patch phase patchcoherencecoherence
line extraction building type recognition TanDEM-X product
Figure 5: Detector of phase ramps – InSAR phase signature (a), phase profile overlaid with synthetic
ramp (b, red), result of detector (c)
The segmentation step starts at the highest detector value max (D), and after a region has been completed is continued with the highest value outside the union of regions found at that time. The best ten regions are visualized in Figure 6 by using random colors. The final building patches are defined by an enclosing rectangle, 20 percent larger than the size of the segment (see Figure 6).
3.4 Detection of Building Shape
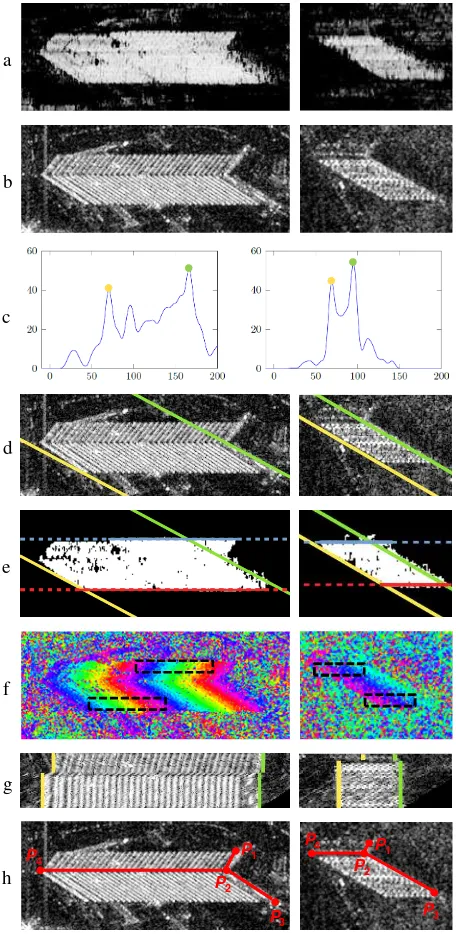
The process of building detection is visualized in Figure 7. The first column contains a tower building, the second a narrow apartment house. In the rows (a) and (b) the extracted building patches are given, on which the analysis of shape is carried out. First, an edge detector (Touzi et al. 1988) and a line detector (Tupin et al. 1998) are applied to the intensity patch to extract the layover area in range direction. On the resulting probability images, a Hough transformation is carried out. In the Hough space, the orientation of the strongest line hint is selected. A profile through the Hough space at this orientation value is plotted in Figure 7c. On the x-axis the distance to the point of origin in the Hough space is given. The hint value is depicted on the y-axis. The maxima marked yellow and green correspond to the enclosing layover edges in range direction. The results in image space are shown in Figure 7d. A slight misalignment is observable for the tower building due to smearing effects at the corner line location.
The extraction of the layover boundary in azimuth direction is easy since those lines have to be horizontal in slant range data (see Figure 7f blue and red line). For that, a Hough transformation is carried out on the ramp detector result. The two maxima in the Hough space showing orientation parallel to slant range direction specify the position of the azimuth boundaries (blue and red line).
For the building given in the second column, the cross points of the lines match to one layover parallelogram. This is not the case for the first building. In order to distinguish these cases, the course of interferometric phase is analyzed. This is visualized in Figure 7f, where two areas (black dashed lines) are extracted. In these areas, the offset of the phase ramp between successive slant range lines is calculated. If both areas show same sign offsets, it’s the case of the second building. Opposite signs of the offsets correspond to the case of the first building.
The reconstruction of the complete building footprint is achieved by taking the building model into account. The second building wall spans a right-angle with the first detected building wall in ground range geometry. It follows:
> −
≤ +
= ′
0 with
, 2
0 with
, 2
ρ
π
ρ
ρ
π
ρ
ρ
where ρ = building orientation (see Figure 2) ρ´ = orientation of second building wall
Due to the transformation between ground and slant range geometry and due to different azimuth and range spacing’s, we Figure 6: Building patches: detector image overlaid with
segmented layover regions and corresponding patch areas
b a
d c
e
f
g
P4
P2
P1
P3
P4
P2
P1
P3
h
Figure 7: Detector of building shape: – result of ramp detector (a), intensity patch (b), Hough histogram (c), detection of azimuth lines (d), result of line detection (e),
analysis of building type (f), input of height extraction (g), and bases of building shape (h)
have to keep in mind that the span angle between the two building walls is not equal 90 degree in the slant range geometry.
In the next step, the building height is computed from the extracted information. We calculate the distance between the Hough lines and extracted the layover length from the intensity and detector image. Corrected intensity patches are shown in Figure 7g. There, the layover distortion due to the building orientation is subtracted. Among these three possibilities the detector image delivered the best results. Based on the estimated layover length lb, the range pixel spacing dr, and the off-nadir look angle θ, the building height h is found as:
. cos
r b
θ
d l
h= ⋅
With detected lines and the calculated building height, the building geometry can be described and visualized by the four base points P1, P2, P3, and P4 (see Figure 7h). For the second building, the point P1 is added manually, given an arbitrary building width, since an automatic detection of this narrow building wall was not possible.
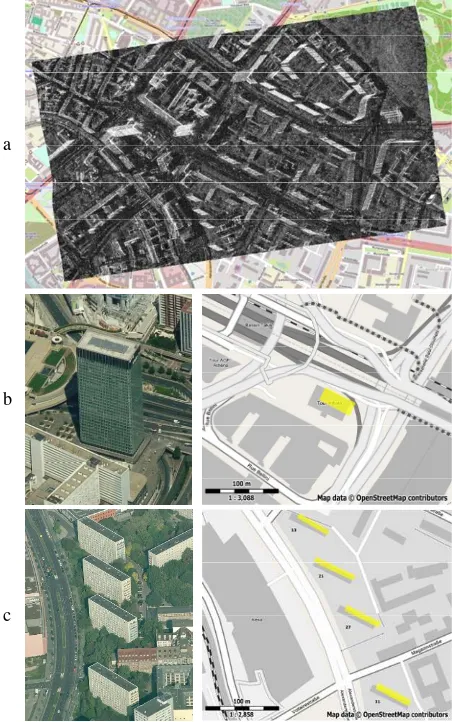
The subsequent geocoding of the SAR data is accomplished within Next ESA SAR Toolbox (NEST) by using the SRTM height data. The result of the whole scene is given in Figure 8a.
The building points P1, P2, P3 are geocoded by using same height values to preserve the perpendicularity of the building footprint. In Figure 8b and c, the geocoded building footprints are colored yellow. The comparison with the underlaid map data shows an offset that is caused probably by the quality of SRTM data.
4. RESULTS
The reconstruction results are summarized for the three buildings in Table 1. The comparison between the reference data and extracted building parameters shows promising results for the Tour Initiale and the Alexander Street 23. Similar results could be achieved for two additional apartment houses in this street (see Figure 8c). The underestimation of the length of the houses in Alexander Street is caused by less reflection at the end of the façade due to missing window columns (see Figure 1c). An extraction of the building width was not successful for the row of apartment houses since the given combination of sensor geometry and building orientation result in the formation of an undersized second layover area. The extracted building heights fit quite well to the reference data. Furthermore, the orientation of the buildings according to geocoding (Figure 8c) is similar to that of the footprints given in the map data.
For the tower building, the differences for the length and the width of the building are up to 5 m. The height difference is much higher. This can probably be ascribed to imprecise reference data and the complex structure of building ground floor, because a decrease of building length and width are recognizable between ground floor and second floor. Furthermore, problems appear for such tall buildings due to overlapping effects with neighboring buildings.
5. CONCLUSION AND OUTLOOK
In this paper, we presented a new approach for extraction and reconstruction of buildings from spaceborne single-pass InSAR data. At beginning of processing, the new phase ramp detector is applied to the whole scene, followed by a segmentation step in order to obtain building patches. Based on those, the building a
c b
Figure 8: Geocoding – map data overlaid with geocoded TerraSAR-X intensity image (a, Berlin), optical data
(source: Bing) and map data overlaid with building footprints – see Paris (b) and Berlin (c)
Table 1: Result and reference data of three buildings
Tour Initiale Alexander St. 13
Alexander St. 23
Reconstruction
Length
Width
Height
47 m
20 m
96 m
47 m
-
30 m
59 m
-
34 m
Reference
Length
Width
Height
42 m
24 m
105 m
57 m
10 m
30 m
57 m
10 m
30 m
parameters are extracted. Last, the 3D building hypotheses are geocoded.
The phase ramp detector shows very good results that verify the high level of information given in the phase signature of buildings. Of course, only buildings showing a dominant layover can be extracted. Hence, for being able to treat also industrial halls, the segmentation of roof areas in the interferometric phases is planned. Furthermore an adaptation of the segmentation step is envisaged, because the search for layover areas can be limited to parallelograms with two sides running parallel to slant direction. Up to now, computation of building height was based on extraction of layover length and phase values have not been analyzed. For that, a phase unwrapping algorithm has to be implemented especially to handle tall buildings. The geocoding results can hopefully be improved by including height information extracted from the InSAR heights in the surrounding of the building.
In the near future, we will start with detailed studies on the parameterization of the ramp detector. The main goal is the definition of an appropriate length of the synthetic phase ramp. Since, the appearance of the layover depends on off-nadir look angle and expected building height, an automatic choice of a proper length is aimed. Furthermore, the phase values in the layover are influenced by the building roof type and the building neighborhood (Thiele, 2010b). We will analyze the effect of this on the ramp detector.
As long-term objective, the combination of multi-aspect data from the next phase of the TanDEM mission is planned, when large baselines are scheduled for descending orbits.
6. REFERENCES
Balss, U., Breit, H., Duque, S., Fritz, T., Rossi, C., 2012. TanDEM-X Payload Ground Segment: CoSSC Generation and Interferometric Considerations, TD-PGS-TN-3129, Weßling: DLR Remote Sensing Technology Institute.
Barthelet, E., Mercier, G., Denise, L., Reynaud, S., 2012. Feature Based Maximum Likelihood Model Inversion For Three-Dimensional Building Extraction From Single High Resolution SAR Images. In: Proceedings of IEEE International
Geoscience and Remote Sensing Symposium, IGARSS 2012,
pp. 3600-3603.
Brunner, D., Lemoine, G., Bruzzone, L., 2010. Earthquake Damage Assessment of Buildings Using VHR Optical and SAR Imagery. In: IEEE Transactions on Geoscience and Remote
Sensing, 48(5), pp. 2403-2420.
Ferro, A., Brunner, D., Bruzzone, L., 2013. Automatic Detection and Reconstruction of Building Radar Footprints From Single VHR SAR Images. In: IEEE Transactions on
Geoscience and Remote Sensing, 51(2), pp. 935-952.
Fritz, T., Duque, S., Bräutigam, B., Bello, J.L.B., 2012. TanDEM-X Ground Segment: TanDEM-X Experimental Product Description, TD-GS-PS-3028, Weßling: DLR Remote Sensing Technology Institute.
Gernhardt, S., Bamler, R., 2012. Deformation monitoring of single buildings using meter-resolution SAR data in PSI. In:
ISPRS Journal of Photogrammetry and Remote Sensing, 73, pp.
68-79.
Krieger, G., Zink, M., Fiedler, H., Hajnsek, I., Younis, M., Huber, S., Bachmann, M., Gonzalez, JH., Schulze, D., Boer, J.,
Werner, M., Moreira, A., 2009. The TanDEM-X Mission: Overview and status. In: IEEE Proc. of the International Radar Conference, pp. 1-5.
Thiele, A., Wegner, JD., Soergel, U., 2010a. Building Reconstruction from Multi-Aspect InSAR Data. In: U. Soergel
(Ed), Radar Remote Sensing of Urban Areas, Springer, 1st
Edition, isbn: 978/9048137500, chapter 8, pp. 187-214.
Thiele, A., Hinz, S., Cadario, E., 2010b. Combining GIS and InSAR Data for 3D Building Reconstruction. In: Proceedings of 2010 IEEE International Geoscience and Remote Sensing
Symposium, IGARSS 2010, pp. 2418-2421.
Toennies, K.D. 2005. Grundlagen der Bildverarbeitung. Pearson Studium (I, Informatik), ISBN 9783827371553.
Touzi, R., Lopes, A., and Bousquet, P.,1988. A Statistical and Geometrical Edge Detector for SAR Images. In: IEEE
Transactions on Geoscience and Remote Sensing, 26(6), pp.
764-773.
Tupin, F., Maitre, H., Mangin, J., Nicolas, J., Pechersky, E., 1998. Detection of Linear Features in SAR Images: Application to Road Network Extraction. In: IEEE Transactions on
Geoscience and Remote Sensing, 36(2), pp. 434-453.
Zhang, F., Shao, Y., Zhang, X., Balz, T., 2011. Building L-shape Footprint Extraction From High Resolution SAR Image.
In: Stilla U, Gamba P, Juergens C, Maktav D (Eds) JURSE
2011 - Joint Urban Remote Sensing Event, pp. 273-276.