QUALITY ANALYSIS ON 3D BUIDLING MODELS RECONSTRUCTED FROM UAV
IMAGERY
M. Jarz bek-Rychard*, M. Karpina
Institute of Geodesy and Geoinformatics, Wroclaw University of Environmental and Life Science, Poland - (malgorzata.jarzabek-rychard, mateusz.karpina)@igig.up.wroc.pl
ThS11: Unmanned Aerial Systems: The Roadmap from Research to Applications
KEY WORDS: UAV, structure from motion, point clouds, building reconstruction, 3D modeling, performance validation
ABSTRACT:
Recent developments in UAV technology and structure from motion techniques have effected that UAVs are becoming standard platforms for 3D data collection. Because of their flexibility and ability to reach inaccessible urban parts, drones appear as optimal solution for urban applications. Building reconstruction from the data collected with UAV has the important potential to reduce labour cost for fast update of already reconstructed 3D cities. However, especially for updating of existing scenes derived from different sensors (e.g. airborne laser scanning), a proper quality assessment is necessary. The objective of this paper is thus to evaluate the potential of UAV imagery as an information source for automatic 3D building modeling at LOD2. The investigation process is conducted threefold: (1) comparing generated SfM point cloud to ALS data; (2) computing internal consistency measures of the reconstruction process; (3) analysing the deviation of Check Points identified on building roofs and measured with a tacheometer. In order to gain deep insight in the modeling performance, various quality indicators are computed and analysed. The assessment performed according to the ground truth shows that the building models acquired with UAV-photogrammetry have the accuracy of less than 18 cm for the plannimetric position and about 15 cm for the height component.
* Corresponding author
1. INTRODUCTION
Rapidly growing UAV market has gained great attention in recent years. Developments in drone technology and structure from motion techniques caused that UAV systems are becoming standard platforms for 3D data collection. Because of a capability to provide high resolution and high accuracy data UAVs are viewed as a low-cost alternative to traditional aerial platforms. They offer advantages in numerous geomatic domains requiring large scale mapping of relatively small area (Nex and Remondino, 2014; Colomina and Molina, 2014).
Currently, we can observe increasing demands on urban applications, where easily affordable UAVs are particularly useful. They provide essential information for smart city monitoring and management (Gruen, 2013; Mohammed et al., 2014). As small flying vehicles they can be used for fast change detection and disaster response (Qin, 2014). Because of flexibility and ability to reach inaccessible urban parts, drones appear as an optimal solution for building surveying. Three dimensional building models belong to the most popular outcomes of UAV urban application. Although building models are commonly generated from laser scanner data (Dorninger and Pfeifer, 2008; Borkowski and Jó ków, 2012; Perera and Maas, 2014), relatively little work is reported about modeling with LiDAR equipped UAV (e.g. Roca et al). In order to provide information for building reconstruction, drones are usually used with photogrammetric or video cameras (Haala et al., 2012; Feifei et al., 2012). Together with various SfM techniques and reconstruction
workflows, collected images enable us to generate 3D building models at various level of details (Qin et al., 2013). UAV-based modeling pipelines presented in the literature include highly accurate semi-automatic reconstruction of building facades (Daftry et al., 2015) as well as less detail but fully automatic modeling of whole urban sites (Rothermel et al., 2014). As 3D building modeling from UAV imagery becomes more common it is of importance to correctly evaluate generated outputs (Bolognesi et al., 2014; Caroti et al., 2015). Insight in the quality is needed in order to decide whether the models are usable for certain application. Building reconstruction from the data collected with drones has important potential to reduce labour cost for fast update of already reconstructed 3D cities. However, especially for updating of existing scenes derived from different sensors (e.g. airborne laser scanning), a proper accuracy assessment is necessary.
The objective of this paper is thus to evaluate the potential of UAV imagery as an information source for automatic 3D building modeling. The investigation process is conducted threefold: (1) comparing resulted SfM point cloud to ALS data; (2) computing internal consistency measures of reconstruction process; (3) analysing the deviation of control points indentified on building roofs and measured with tacheometer. In order to gain deep insight in the quality of the output, various quality measures are computed and presented in quantitative analysis.
In the following section our complete pipeline for building models acquisition is described. Details on the collection of UAV data and reference information are followed by a brief The International Archives of the Photogrammetry, Remote Sensing and Spatial Information Sciences, Volume XLI-B1, 2016
presentation of the reconstruction method. Section 3 presents and discusses the results of the quality analysis. Conclusions are summarized in Section 4.
2. METHODOLOGY
2.1 Data collection
The experiments were conducted in the suburban area of Wroclaw (Poland) with an approximate size of 300 x 400 m2. The test site contains 44 residential buildings with complex roofs and numerous small superstructures. For UAV image acquisition we used Leica Aibotix X6V2 equipped with a camera Nikon D800. The sensor had the image resolution of 36 megapixels and was equipped with a focus lens set up at 24 mm focal length. Images were collected at the height of 75m with an overlap of approximately 80% forward and 70% side. Structure from motion were performed using a state of the art tool (Verhoeven, 2011). For a precise georeferencing we used Ground Control Points measured in the field by differential GPS with the improved location accuracy (DGPS). Extraction of building models were performed on a 3D point cloud generated with a GSD of 5 cm.
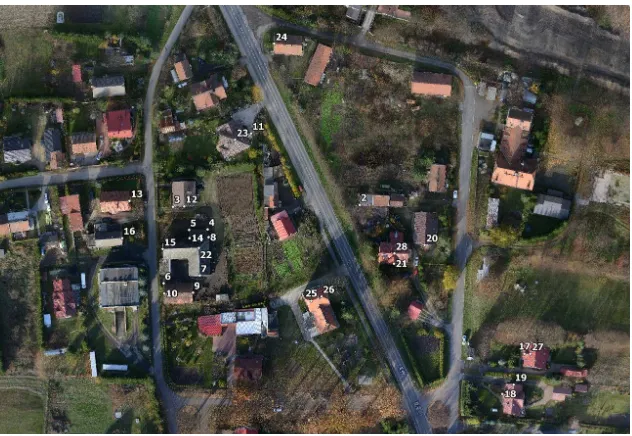
For the reference information two types of data source were used: airborne laser scanning and tacheometry. ALS point cloud was collected with a density of 12 points/m2 by the Riegl LiteMapper system 6800i (based on LMS-Q680i scanner). The ALS data set was utilized twofold. First, as a direct reference for the evaluation of UAV point cloud. Second, indirectly as an input for the reconstruction of ALS-based 3D building models which were compared with the models generated using UAV. In order to assess the achieved absolute accuracy of reconstructed models, we used Check Points which serve as geometrical ground truth. The points were identified on the vertices of building roofs and measured in the field by a tacheometer. An overview of the study area with marked Check Points is presented in Fig. 2.1.
2.2 Building modeling
Building 3D models were automatically generated by our modeling methodology for unambiguous decomposition of complex objects into predefined parametric primitives (Jarz bek-Rychard, 2015). The method allows for a reconstruction of polyhedral models with an explicit topological relation and semantic information. As an input data the algorithm uses a set of 3D building points. The core part of the reconstruction process is the identification of predefined roof structure elements and their logic combination. In order to relate specific features extracted from the data to general knowledge about building shapes a library of elementary building structures is established. Roof structure recognition is performed using topology graphs, which describe the topological relation between roof planes (Verma et al., 2006). Building graph pieces are unambiguously matched with simple sub-graphs associated with basic elements from the library. The detected building pieces are reconstructed according to the implemented soft rules and combined into one topologically consistent object.
Fig 2.2: 3D scene automatically reconstructed from UAV data.
Fig 2.1: An overview of the study area. Orthophoto image with Check Points located on building roofs vertices.
For comparison purpose we generated two sets of 3D building models: i) UAV-based, reconstructed from SfM point cloud and ii) ALS-based, produced directly from LiDAR data. The reconstruction was performed on LOD 2, which is a common building representation in large scale 3D cities. According to the standard (Groger et al., 2012) buildings are presented as solid objects with simplified facades and faithfully reflected roof structure. Building models reconstructed from the data collected by UAV are presented in Fig. 2.2.
3. RESULTS AND DISCUSSION
3.1 Data quality
The starting point for the assessment of the modeling quality is to determine the quality of the input data. The reconstruction algorithm used for automatic building modeling directly works on 3D point clouds. Hence, before analysing the accuracy of the extracted features we evaluate the point cloud generated by SfM from the images collected
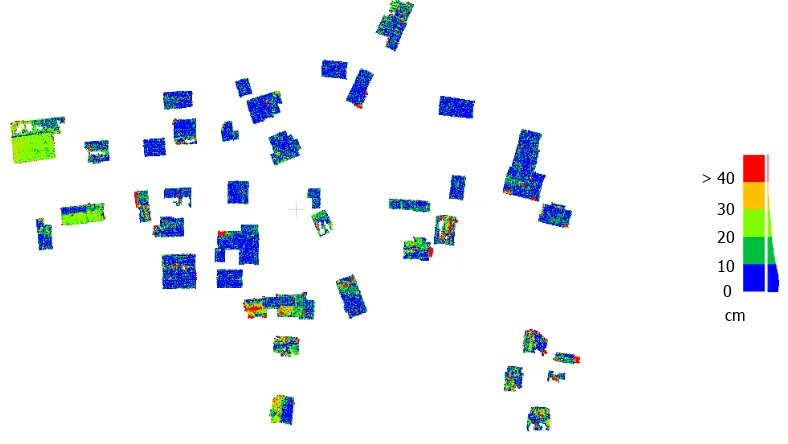
by UAV. In order to indicate how the data characteristics affect the quality of extracted building, two reconstruction pipelines are compared within the paper: UAV-based and ALS-based. In this section we present a relative quality investigation of the UAV point cloud with respect to the data set collected by airborne laser scanning. Figure 3.1 shows the color-coded deviations between both point sets. The prevailing group contains deviation values which are smaller than 10 cm. For 75% of the points the calculated differencies are within the range of 20 cm. The bigger discrepancies occur locally and they are mostly due to the data gaps.
For the computation of accuracy metrics we selected an internal part of a roof data, in order to eliminate the influence of the edge points. The computed mean distance between both point sets is equal to 7.7 cm, with a standard deviation of less than 6 cm. The discrepancies between ALS and UAV data are illustrated in Fig. 3.2. A visual analysis of the mutual coverage in roof profiles shows a clear data offset in the planar position. The information on the height of object location provided by UAV is very similar to the data acquired by ALS.
Fig 3.1: Residuals between UAV point cloud and ALS data set.
Fig 3.2: Selected internal part of building data (left), UAV points (blue) compared to ALS data (red) (right).
3.2 Internal quality of modeling
The next numerical experiment aims at determining the internal quality of modeling. The evaluation is based on the relation between input data and output model. Various indicators can be used in order to asses the quality of reconstruction without exploiting reference information (e.g. overview in Oude Elberink, 2011). In this study, we compute an orthogonal distance between 3D points and corresponding roof faces and perform a quantitative analysis. For comparison, the same evaluation is executed for both information sources, UAV imagery and ALS. The statistics on the quality investigation are collected in Tab. 3.1.
Table 3.1: Statistics on the internal accuracy of 3D reconstruction results.
ALS UAV
Detected segments 163 215
Points in segment (average) 931 12559 Standard deviation of plane
There are 163 roof faces identified in the laser scanner data. Information collected with drone enables detecting 215 planes. This relatively high increase of more than 30% is related to the difference in the input data density, which is about 30 times larger in the UAV case. At the same time, the mean number of points in a detected segment is only about 13 times larger. These results indicate that the buildings reconstructed from the UAV imagery contain much more smaller details (e.g. dormers). The statistics concerning the accuracy of plane fitting are very similar in both data sets. The mean absolute values between reconstructed planes and corresponding points are about 5 cm. The main difference is related to the plane with the largest mean residual value, which is nearly twice as better for UAV. The inferior of ALS might be an effect of much lower density of this data. As a consequence, sparse points belonging to various small roof faces can be identified with the biggest neighbouring plane.
3.3 External quality of modeling
The evaluation of the absolute accuracy of modeling requires an independent reference dataset. Such information provides a mean and local variation in 3D space between reference data and the reconstructed model. A review of existing performance metrics is presented in Ruzinger (2009). In this study, the geometrical accuracy of modeling is analysed comparing coordinates of Check Points (CPs) identified on the vertices of building roofs. The points are acquired in three manners: (1) measured by a tacheometer in the field, (2) provided by the reconstructed 3D models, (3) manually indentified in the 3D point clouds (we used the points with
the best approximation of real corners). CP coordinates were analysed separately for plannimetric and height errors. In order to compare the feasibility of the UAV-based building modeling to the reconstruction from ALS information, the same investigation was conducted for laser scanner data.
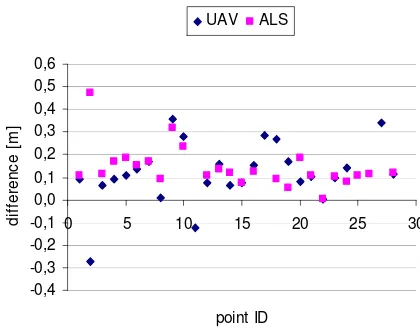
Plannimetric absolute residuals between the Check Points located on 3D models and measured in the field are presented in Fig. 3.3. The corresponding height differences are illustrated in Fig. 3.4. In 2D residual analysis the results are very similar for both data sources. The largest discrepancies reach up to 40 cm whereas the most of the calculated differences do not exceed 20 cm. The performance achieved for UAV-based and ALS-based models differs slightly in the second analysis of height accuracy. The values computed for ALS models are very close to each other and show a horizontal trend of 10 cm. In the UAV results we observe a bigger variation, which is probably related to the generation of input 3D data (directly used for the reconstruction) by SfM techniques.
Fig 3.3: Planar differences between Check Points located on 3D models and measured by tacheometer (absolute values).
-0,4
Fig 3.4: Height differences between Check Points located on 3D models and measured by tacheometer.
Tab 3.2: Statistics on the absolute accuracy, performed based on the residuals between Check Points.
mean distance [cm] standard deviation [cm] difference
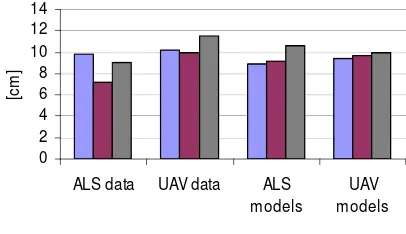
In order to get a wider view of the modeling performance, the statistics considering various CP comparisons are performed. Figure 3.5 illustrates mean residuals between Check Points, calculated with respect to the data collected by a tacheometer. The mean residuals enable assessing the absolute accuracy of the location of derived models in 3D space. As expected, the values computed for ALS input data show clear prevalence of the height accuracy over planar precision (18 cm vs 10 cm). In the UAV-based 3D point cloud these values are nearly the same (around 14 cm). The accuracy analysis of generated models accuracy shows comparable results for the outputs reconstructed from both data sets (i.e., ALS results in the accuracy of 16 and 14 cm of the planar and height components, respectively, whereas UAV results in 18 and 15 cm, respectively). Additionally, we directly compare these two sets of 3D models. The calculated differences between with respect to the data collected by tacheometer.
0
As the statistics based on mean residuals may be affected by a constant shift, for the assessment of reconstruction precision it is useful to analyse standard deviation (Fig. 3.6). The results based on the comparison between CPs located on the models and surveyed by a tacheometer are similar for the UAV and ALS outputs. The plannimetric accuracy as well as the height component are within the range from 8.9 cm to 9.6 cm. Considering a typical roughness of roof surfaces this result demonstrate the high precision of the executed 3D reconstruction.
4. CONCLUSIONS
We have presented the investigation on the quality of 3D building models automatically reconstructed from UAV imagery. For this purpose we analysed the quality of input data, the internal quality of reconstruction, and the absolute geometric accuracy of generated models. In order to compare modeling outputs to independently determined reference data, Check Points were identified on building roofs and measured by a tacheometer. The assessment performed according to the ground truth shows that the building models acquired with UAV-photogrammetry have the accuracy of less than 18 cm for the plannimetric position and about 15 cm for the height component.
As virtual cities are commonly reconstructed from airborne laser scanning data, we executed the same modeling algorithm on UAV and ALS data set. The executed numerical experiments show a high correlation between the modeling performances in both cases. The results proof that UAVs provide a compelling accuracy in the building reconstruction task. Moreover, comparing to ALS, the height density of a UAV-based 3D point cloud allows for the improvement of the feature extraction, with a comparable precision of plane fitting (5 cm of mean residuals from 3D points to the corresponding plane). The generated models meet the requirement of being accurate and reliable. The results of the conducted investigation show that UAV imagery can be a very capable source of imaging data for 3D building reconstruction. In the future, we will exploit more information contained in the collected data by refining the reconstruction algorithm through adding edges directly extracted from UAV images
ACKNOWLEGEMENTS
This work was supported by National Science Centre, Poland (Project No 2014/13/N/ST10/04892).
REFERENCES
Bolognesi, M., Furini, A., Russo, V., Pellegrinelli, A., Russo, P., 2014. Accuracy of cultural heritage 3D models by RPAS and terrestrial” in The International Archives of the Photogrammetry, Remote Sensing and Spatial Information Sciences, Volume XL-5, pp. 113-119.
Borkowski, A., Jó ków, G., 2012. Accuracy Assessment of Building Models Created from Laser Scanning Data. International Archives of the Photogrammetry Remote Sensing and Spatial Information Sciences, Vol. 39-B3, pp. 253-258
Caroti, G.; Martínez-Espejo Zaragoza, I.,Piemonte, A., 2015. Accuracy assessment in structure from motion 3D reconstruction from UAV-born images: The influence of the data processing methods. International Archives of the Photogrammetry, Remote Sensing and Spatial Information Sciences, 40, pp.103–109.
Colomina, I., Molina, P., 2014. Unmanned aerial systems for photogrammetry and remote sensing:a review”, ISPRS Journal of Photogrammetry and Remote Sensing, 92, pp.79-97.
Daftry, S., Hoppe, C., Bischof, H., 2015. Building with Drones: Accurate 3D Facade Reconstruction using MAVs. Proceedings of International Conference on Robotics and Automation (ICRA), Seattle.
Dorniger P., Pfeifer N., 2008. A comprehensive automated 3D approach for building extraction, reconstruction and regularization from air borne laser scanning point cloud. Sensors, vol. 8, pp. 7323-7343.
Feifei, X., Zongjian, L., Dezhu, G., Hua, L., 2012. Study on construction of 3D building based on UAV images, International Archives of the Photogrammetry, Remote Sensing and Spatial Information Sciences, XXXIX-B1, pp.469-473.
Groger, G., Kolbe, T.H., Nagel, C., Häfele, K.H. 2012. OGC City Geography Markup Language (CityGML)
Encoding Standard. Version 2.0;
http://www.opengeospatial.org/standards/citygml (23.03.16)
Gruen A (2013) Next generation smart cities-the role of geomatics. Singapore-ETH Centre, Future Cities Laboratory, Singapore
Haala, N., Rothermel,M., 2012. Dense multiple stereo matching of highly overlapping uav imagery. International Archives of the Photogrammetry, Remote Sensing and Spatial Information Sciences, vol. XXXIX-B1, pp. 387-392, 2012.
Jarzabek-Rychard, M., 2015. 3D building modeling based on laser scanning data. PhD Thesis, Wroclaw University of Environmental ad Life Sciences, Poland.
Mohammed, F., Idries, A., Mohamed, N., Al-Jaroodi, J., Jawhar, I., 2014. UAVs for smart cities: Opportunities and challenges. International Conference on Unmanned Aircraft Systems (ICUAS), pp. 267-273.
Nex, F., Remondino, F., 2014. UAV for 3D mapping applications: a review. Applied Geomatics, Volume 6, Issue 1 , pp 1-15.
Oude Elberink, S., Vosselman, G. , 2011. Quality analysis on 3D building models reconstructed from airborne laser scanning data. ISPRS Journal of Photogrammetry and Remote Sensing, Vol. 66, pp. 157-165.
Perera, G.S.N.; Maas, H.-G., 2014. Cycle graph analysis for 3D roof structure modelling: Concepts and performance. ISPRS Journal of Photogrammetry and Remote Sensing, Vol. 93, pp. 213–216.
Roca, D., Armesto, J., Lagüela, S., Díaz-Vilariño, L., 2014. Lidar-equipped UAV for building information modeling. International Archives of the Photogrammetry, Remote Sensing and Spatial Information Sciences, Volume XL-5, pp.523-527.
Rothermel, M., Bulatov, D., Haala, N. Wenzel, K., 2014. Fast and Robust Generation of Semantic Urban Terrain Models from UAV Video Streams, 22nd International Conference on Pattern Recognition, Stockholm.
Rutzinger, M., Rottensteiner, F., Pfeifer, N., 2009. A comparison of evaluation techniques for building extraction from airborne laser scanning. IEEE Journal of Selected Topics in Applied Earth Observations & Remote Sens. 2 (1), 11–20.
Verhoeven, G., 2011. Taking computer vision aloft-archaeological threedimensional reconstructions from aerial photographs with photoscan. Archaeological Prospection, vol. 18, no. 1, pp. 67-73.
Verma,V., Kumar,R., Hsu,S., 2006. 3D building detection and modeling from aerial LiDAR data. Proceedings of the 2006 IEEE Computer Society Conference on Computer Vision and PatternRecognition. CVPR’06. IEEE Computer Society, Washington, DC, pp.2213–2220.
Qin, R., 2014. An Object-Based Hierarchical Method for Change Detection Using Unmanned Aerial Vehicle Images. Remote Sensing, 6, pp. 7911-7932.
Qin, R., Grün, A., Huang X., 2013. UAV project – building a reality-based 3D model. Coordinates, 9 (2013), pp. 18–26 The International Archives of the Photogrammetry, Remote Sensing and Spatial Information Sciences, Volume XLI-B1, 2016