AUTOMATIC EXTRACTION OF BUILDING OUTLINE FROM HIGH RESOLUTION
AERIAL IMAGERY
Yandong Wang
EagleView Technology Corp.
25 Methodist Hill Dr., Rochester, NY 14623, the United States [email protected]
Commission III, WG III/2
KEY WORDS: Point Cloud, Extraction, Building, Image, Outline, Automation.
ABSTRACT:
In this paper, a new approach for automated extraction of building boundary from high resolution imagery is proposed. The proposed approach uses both geometric and spectral properties of a building to detect and locate buildings accurately. It consists of automatic generation of high quality point cloud from the imagery, building detection from point cloud, classification of building roof and generation of building outline. Point cloud is generated from the imagery automatically using semi-global image matching technology. Buildings are detected from the differential surface generated from the point cloud. Further classification of building roof is performed in order to generate accurate building outline. Finally classified building roof is converted into vector format. Numerous tests have been done on images in different locations and results are presented in the paper.
1. INTRODUCTION
Building outline is important geospatial information for many applications, including planning, GIS, tax assessment, insurance, 3D city modelling, etc. Extracting buildings/building outlines automatically from digital images has been an active research area in both photogrammetry and computer vision communities for decades. Numerous approaches have been developed to extract buildings automatically from digital imagery or elevation data such as LiDAR data. Review on methods for automatic building extraction from digital imagery can be found in Mayer, 1999 and Baltsavias, 2004. Some of methods for automatic extraction and reconstruction of buildings using LiDAR data are discussed in Dorninger and Pfeifer 2008. In this paper, an automated approach for extraction of building outline from digital imagery is presented. The proposed method uses both spatial information of objects derived from the imagery using computer vision technique and spectral information to detect buildings and delineate building outline accurately. It consists of four major steps, i.e. generation of point cloud from imagery using semi-global image imaging technology, detection of buildings from the generated point cloud, classification of building roof and creation of building outline in vector format. Automatic generation of point cloud is based on semi-global image matching. A hierarchical approach is implemented in image matching in order to achieve high accuracy of point matching. In this approach, matching starts with low resolution images and the match results are used as reference of matching at next level. After image matching is finished, 3D coordinates are computed for every matched point.
Once point cloud is generated, an approximate bare-earth surface is created. There are various approaches for computation of bare-earth surface from LiDAR data. A polynomial surface fitting algorithm is used for automatic generation of bare-earth surface in this paper. After bare-earth surface is generated, a differential surface is created by subtracting the bare-earth surface from the point cloud. Buildings are detected by checking the gradients of elevation in the created differential surface and their location and size are computed.
In order to generate accurate building outline, building roof is classified further using pixel’s radiometric features. Classification of building roof starts with generation of seed areas which are smooth and have uniform surface properties. Once seed areas are generated, a number of spatial and spectral properties in these areas are computed and used as a “pattern” for classification of building roof. In order to eliminate the effect of trees, algorithms for detection of trees are developed to detect both green and leaf-off trees.
After building roof is classified, a rectangular building outline is generated for the classified building roof. First the edge pixels of the classified building roof is traced and a closed polygon is generated. To create rectangular shape outline, a split-and-merge process is applied to split the traced building boundary into segments based on the curvature of the polygon. For each line segment, a straight line is fitted. Once all line segments are fitted, intersections between consecutive segments are computed as roof corners.
The developed approach has been tested with a large number of images. The test results and their statistical numbers will be presented in section 5 this paper.
2. BUILDING MODEL
Basically automatic extraction of objects from imagery includes two major tasks. One is the automatic recognition of objects while the other is to locate objects accurately. In order to recognize objects from the imagery, the properties of objects to be extracted should be used. For automatic extraction of buildings, some generic knowledge on buildings should be used in the extraction process. The following covers some generic knowledge of a building:
a. A building has certain height b. A building has certain size
e. A building usually has homogeneous roof surface f. A building may be occluded by trees or shadow.
Properties from a to d are related to the geometric properties of a building and property e is radiometric property of a building while the last item is the knowledge on contextual relation between a building and other objects. These properties are used in the following extraction processes.
3. AUTOMATIC GENERATION OF POINT CLOUD FROM DIGITAL IMAGERY
In the last few years, significant progress has been made in automatic generation of point cloud from stereo image pairs in computer vision. One of the best technologies in automatic point cloud generation is Semiglobal image matching developed by Hirschmueller (2008). The main advantages of semiglobal image matching is that it tries to find corresponding point for every pixel in the image. Since it uses global information rather than local information in a small window, matching results is more reliable, especially in poor texture areas such as road surface, building roof, water surface, etc. In this paper, point cloud is generated by using semiglobal image matching and it consists of three major steps:
a. Computation of orientation parameters of image pair b. Rectification of image pair
c. Image matching and generation of point cloud
3.1 Computation of Orientation Parameters and Rectification of Image Pair
There are two ways to compute accurate orientation parameters of the images. One is to triangulate all images in the area in one block or sub-blocks while the other is to compute orientation parameters of one pair at one time. The general procedure for these two ways is same. Basically they include feature extraction, feature matching and bundle adjustment with the match points. In this study, Affine-Scale Invariant Feature transform (ASIFT) operator (Morel and Yu, 2009) is used for extraction and matching. Match feature points are then used to compute images’ orientation parameters by using least squares bundle adjustment.
Before image matching, images have to be rectified so that both images have similar image scale and more importantly the corresponding points are located on the same row on both images. The standard rectification process is used in this paper to generate rectified images.
3.2 Image Matching by SemiGlobal Matching (SGM)
SGM is a new image matching approached developed by computer vision scientist in recent years (Hirschmueller, 2008). Unlike traditional image matching, SGM uses a cost as the measure of image matching. The entropy is computed by double convolution of joint probability function with a Gaussian kernel function which defined as:
image with the pixel at a disparity d on the match image. g is the Gaussian kernel function and n is the size of the window.
The matching cost is defined by the Mutual Information (MI) as:
) introduced in computing the energy which is defined as:
)
The costs in different paths (8 or 16) at pixel p are accumulated as the final matching measure.
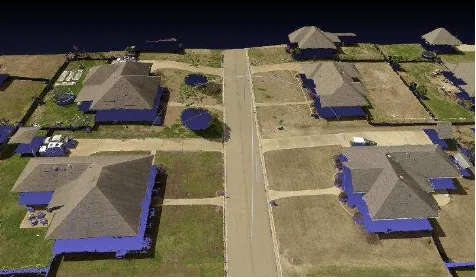
In order to generate disparity map correctly, a hierarchical image matching is performed. An initial disparity map is created from the image at the top of image pyramid. After image matching, a new disparity map is created and used as the reference for the matching at the next level. This process is repeated until the image at final level is finished. Figure 1 shows the point cloud generated by SGM.
Figure 1 Point Cloud Generated by SGM
4. AUTOMATIC DETECTION OF BUILDINGS AND CLASSIFICATION OF BUILDING ROOF
Automatic extraction of buildings consists of automatic generation of approximate bare-earth surface from point cloud, detection of buildings, classification of buildings and generation of building outline in vector format. Automatic detection of buildings is done by using geometric properties of buildings while the radiometric properties are used to classify building roof.
4.1 Automatic Generation Approximate Bare-Earth Surface Model
Vosselman, 2004. In this paper, a polynomial surface fitting is used to generate bare-earth surface from the point cloud, which has the following form:
b Y X a
Z k n k
n
k
k
0 (4)where n is the order of polynomial function which is determined by the magnitude of terrain relief.
The generation of bare-earth surface is an iterative process in which an initial surface is created using all points from the point cloud as shown in Figure 2. After the initial surface is created, points above this surface are excluded and only the remaining points are used to create a new surface. This process is repeated until the variance of elevation between the created surface and the points used to create this surface is smaller than given threshold. After bare-earth surface is created, a differential surface is generated by subtracting bare-earth surface from the original point cloud. In the differential surface, only objects above the terrain surface such as buildings and trees are represented. This facilitates the detection of buildings.
Figure 2 Automatic Generation of Bare-earth Surface
4.2 Automatic Detection of Trees
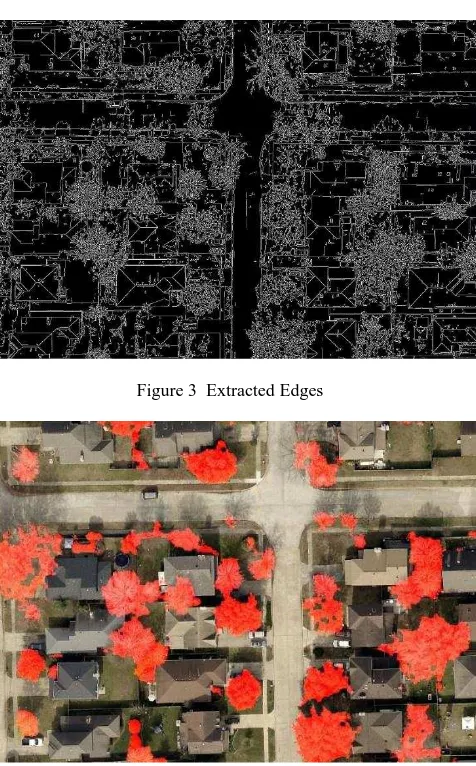
Once differential surface is created, some trees can be detected by checking the variance of surface normal directions (Brunn and Weidner, 1997). However, this approach may not work for trees with leaf-off. In order to detect trees without leafs, an algorithm based the variance of edge direction is proposed. Figure 3 shows the edge information extracted from a portion of the image. As shown in the figure, only main structures of buildings such as ridge lines and roof edges are represented while there is a lot of variance on trees. The variance of trees is computed by
N O O O O
E ij
m n ij
v
( )*( )/ (5)Where m, n are the dimensions of the window, Oij is the
orientation of an edge at pixel (i,j), O is the average orientation of the edge, N is the total number of pixels in the window.
Figure 4 shows the result of automatic tree detection. As can be seen, trees with and without leafs are extracted nicely.
Figure 3 Extracted Edges
Figure 4 Automatically Detected Trees
4.3 Automatic Detection of Buildings
After trees are detected from the image, they are excluded from the differential surface. The gradient of elevation in the differential surface is then computed and building boundaries are detected by thresholding the computed elevation gradient. The entire building roof is detected by comparing the elevation of neighboring pixels against the elevation of the detected building boundary. Figure 5 show the result of building detection.
To extract building outline more accurately, pixels within the areas determined by the detected buildings are classified further by using the radiometric properties of building. Seed areas from the detected buildings are first selected and features are computed in the selected seed areas. Once the features of seed areas are computed, the features of other pixels in the defined building areas are computed and compared with the features of the seed areas. If their difference is within the defined threshold, they are classified as building roof. Some of classification results are shown in Figure 6.
Initial surface generated from point cloud
Figure 5 Automatically Detected Buildings
Figure 6 Classified Building Roof
4.4 Automatic Generation of Building Outline
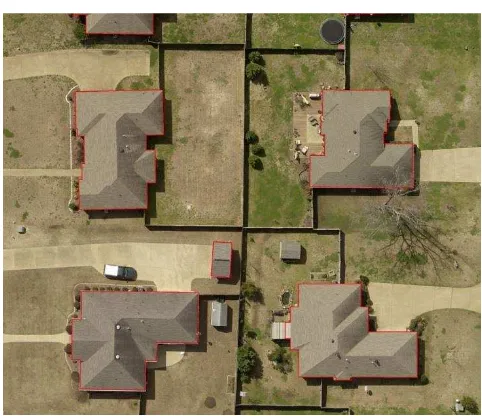
For many applications, it is not convenient to use the extracted buildings in raster format. Building outlines should be created in vector format. To convert the classified building roof from raster to vector, the edge of classified building roof is traced first. The traced roof edge is a closed polygon. It is then split by applying split-and-merge process. The traced edge is split into two segments at the midpoint at the beginning. The splitting is done by checking the distance of a point on the edge to the connection of two end points of the segment. The edge is split at the point with maximum distance. The split segments are split again until the maximum distance of edge points is less than the given threshold. After the splitting is finished, the orientations of two consecutive segments are compared at every splitting point and the segments are merged if they have similar orientations. A line is fitted to every split segment and the intersection between two consecutive segments is computed as the corner of building. Figure 7 shows the extracted building outline.
Due to the effect of occlusion such as trees or shadow cast by trees, the extracted building outline in occluded areas is usually
not right and some corner points may be missed. To reduce the effect of occlusion, the occlusion areas should be detected and the missing edge segments and corners should be found. Since a building usually has a regular shape, the occlusion area can be detected by checking the regularity of the traced edge. Once the occlusion area is detected, the missing edge segments and corner points can be inferred by the knowledge of roof structure near the occlusion area. Figure 8 shows the extracted building outline with correction of occlusions.
Figure 7 Extracted Building Outline
Figure 8 Extracted Building Outline with Correction of Occlusion
5. TESTS
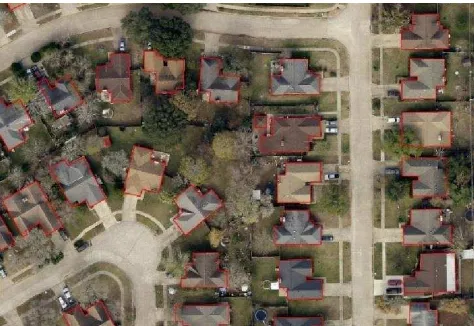
The developed approach has been tested on a large number of aerial images. The test images have a GSD of 10cm and cover an area of over 100 square kilometers. The test area contains newly developed subdivisions without big trees, relatively old subdivisions with a lot of trees between buildings or surrounding buildings and some established subdivisions with some big trees surrounding buildings. Some test results without trees, with trees and shadows are shown in Figures 9 to 11 respectively.
Figure 9 Extracted Building Outlines in Open Area
Figure 10 Extracted Building Outlines in Partial Occluded Area
Figure 11 Extracted Building Outlines in Heavily Occluded Area
has been achieved with the developed approach. For open areas, the accuracy of automatically extracted building outline is 99.3% and 89.3% of the automatically extracted building outlines are accurate. Only half percent of the extracted buildings are false and about the same percentage of buildings are not extracted. In partially occluded areas, 1,128 buildings among 1153 extracted buildings are true buildings, which accounts for 97.8% of the total buildings. The percentage of both false buildings and missed buildings is around one percent. These show that very reliable building outlines can be extracted in both open area and partially occluded area.
Type of test Area Open Area Partially occluded area Total number of
extracted buildings
2072 1153
Number of true buildings
2057 (99.3%) 1128 (97.8%)
Number of false buildings
10 (0.5%) 12 (1%)
Number of missed buildings
9 (0.4%) 15 (1.3%)
Number of accurate buildings
1851 (89.3%)
Table 1 Test Results of Automatic Extraction of Building Outline
6. CONCLUSIONS
A new approach for automatic extraction of building outline from high resolution imagery has been developed. The developed approach uses both geometric properties and radiometric properties of building to recognize buildings and delineate their boundaries accurately. The test results show that 99% accuracy has been achieved in open area and about 98% of the extracted buildings are correct. About 90% of the extracted building outlines are very accurate and can be used for various applications.
REFERENCES
Baltsavias, E.P., 2004. Object Extraction and Revision by Image Analysis using Existing Geodata and Knowledge: Current Status and Steps towards Operational Systems. ISPRS Journal of Photogrammetry & Remote Sensing, 58 (2004), pp. 129-151.
Brunn, A. and Weidner, U, 1997. Extracting Buildings from Digital Surface Models. IAPRS, Vol. 32, Part 3-4W2, pp. 27-34.
Dorninger, P. and Pfeifer, N., 2008. A Comprehensive Automated 3D Approach for Building Extraction, Reconstruction, and Regularization from Airborne Laser Scanning Point Clouds. Sensors 2008, 8, pp. 7323-7343.
Hirschmueller, H., 2008. Stereo Processing by Semiglobal Matching and Mutual Information. IEEE transactions on Pattern Analysis and Machine Intelligence, Vol. 30, No. 2, pp. 328-341.
Mayer, H., 1999. Automatic Object Extraction from Aerial Imagery – A Survey Focusing on Buildings. Computer Vision and Image Understanding, Vol. 74, No. 2, pp. 138-149.
Morel, J.M. and Yu, G., 2009. ASIFT: A new framework for fully affine invariant image comparison. SIAM Journal on Imaging Sciences, 2(2), 438-469.