COMBINING SPECTRAL AND TEXTURE FEATURES USING RANDOM FOREST
ALGORITHM: EXTRACTING IMPERVIOUS SURFACE AREA IN WUHAN
Zhenfeng Shao a, b, Yuan Zhang a, *, Lei Zhang a, Yang Song c, and Minjun Peng d
a State Key Laboratory of Information Engineering in Surveying, Mapping and Remote Sensing, Wuhan University, 129 Luoyu Road, Wuhan, China 430079
b Shenzhen Research and Development Center of State Key Laboratory for Information Engineering in Surveying, Mapping and Remote Sensing, Shenzhen, China, 518057
c Guangzhou urban planning design &survey research institute, 10 Jianshedamalu, Guangzhou, China, 510060 d Wuhan city land resources and Planning Information Center, 13 Sanyang Road, Wuhan, China, 430014
Commission VII, WG VII/4
KEY WORDS: Impervious surface area, Random forest, Texture features
ABSTRACT:
Impervious surface area (ISA) is one of the most important indicators of urban environments. At present, based on multi-resolution remote sensing images, numerous approaches have been proposed to extract impervious surface, using statistical estimation, sub-pixel classification and spectral mixture analysis method of sub-sub-pixel analysis. Through these methods, impervious surfaces can be effectively applied to regional-scale planning and management. However, for the large scale region, high resolution remote sensing images can provide more details, and therefore they will be more conducive to analysis environmental monitoring and urban management. Since the purpose of this study is to map impervious surfaces more effectively, three classification algorithms (random forests, decision trees, and artificial neural networks) were tested for their ability to map impervious surface. Random forests outperformed the decision trees, and artificial neural networks in precision. Combining the spectral indices and texture, random
forests is applied to impervious surface extraction with a producer’s accuracy of 0.98, a user’s accuracy of 0.97, and an overall
accuracy of 0.98 and a kappa coefficient of 0.97.
1. INTRODUCTION
Rapid growth of urban impervious surfaces is one of the most salient features of rapid urbanization. Impervious surface is generally defined as any material that water cannot permeate, including the traffic and the construction of the building, which is closely related to human activities and living. In the process of urbanization, the ground objects information changes frequently, including changes from suburb permeability better land types to poor permeability transition urbanized land, leading to that vegetation coverage area for the main part of the natural landscape is replaced by artificially constructed surface which is the by-product of urban development. Additionally, industrial land in old city and low-density residential land have been developed into high-density residential land and commercial land. Above changes result in a series of ecological, environmental and climate issues, such as urban heat island effect, non-point source pollution, air pollution, and reduced biodiversity.
Since 1970, ground measurements and manually digitized methods were used to estimate impervious surface. Although these methods are accurate, the low-level automatization, time-consuming and data on a small range limited the scope of the application of these methods. In contrast, impervious surface has caused widespread concern with the advantages of multiple spectral bands, detection without geographical and environmental constrains, broad perspective, transient imaging functionality and low cost. However, most previous research is applied primarily to medium/coarse resolution remote sensing images, such as Landsat Thematic Mapper (TM) and Enhanced Thematic Mapper Plus (ETM+) data. The resulting impervious
surface estimation, therefore, is difficult to meet the needs of urban planning and management and mapping. With more details, high spatial resolutions images attract the interests of urban planners. However, in order to produce high resolution impervious surface information quickly and accurately, it still has a great deal of work to do.
At present, research in this field focuses on the application, experimental use of existing methods, and contrast .Machine learning algorithms such as artificial neural networks, decision trees, support vector machines and ensemble classifiers, have been successfully adopted to urban impervious surface area estimation and monitoring, making it possible to deal with the heterogeneous spectral signature of land cover categories over large areas (Grinand et al., 2013) .Such algorithms have the advantages with high accuracy, and are able to handle large volumes of data effectively. Wu et al (2009) quantified high resolution impervious surfaces using spectral mixture analysis (SMA) from the IKONOS image. To solve within-class variability and the mixed pixel, they proposed two approaches:
Interior end-member set selection and spectral normalization. Fei and Marvin(2006) investigated digital classification techniques of mapping of impervious surface area using high resolution Quick bird satellite data, and explored and compared two methods – object-based and per pixel classification. In addition, Deng sheng Lu et al (2011) got a good performance provided by the hybrid method consisting of thresholding techniques, unsupervised classification and limited manual editing. To reduce the impact of shadows, an algorithm of multiple agent segmentation and classification (MASC) that includes sub-models of segmentation, shadow-effect, MANOVA-based classification and post classification was The International Archives of the Photogrammetry, Remote Sensing and Spatial Information Sciences, Volume XLI-B7, 2016
proposed by Yuyu Zhou and Y.Q. Wang (2008). To assess the effectiveness of multi-scale segmentation and Object-oriented fuzzy classification method, Robert and Navendu (2008) extracted 8 types of land cover classification in the Ohio area and achieve an overall accuracy of 93.6%. Mohapatra et al (2008) also extracted high resolution impervious surfaces using an artificial neural network (ANNs) which is 3-layer structure from the IKONOS image in Grafton, Wisconsin area.
Among these algorithms, Random forest (RF) algorithm is a new and powerful classification and regression algorithms and exhibits many desirable properties, including the robustness of over fitting the training data and evaluation of variable importance. It also has better performance at capture non-linear association patterns between predictors and response and fits for parallel computing platforms (Kühnlein et al., 2014).Schneider (2012) reported that on the basis of accuracy assessment, RF was superior to maximum likelihood classifier and support vector machines. This is one of the reasons it has led us to investigate the usefulness of RF approaches for urban impervious surface area estimation in high resolution remote sensing. However, as a statistical learning technique, when the number of samples is distributed unequally, the result of RF is often biased in favor of the majority class, and vice versa the numbers of minority class tend to be underestimated.
The main objective of this study was to effectively and feasibly map impervious surfaces in Wuhan, and these research results can be used by urban planners to analysis environmental monitoring and urban management for sustainable urban development. In this paper, combining with texture and the spectral indices, including Brightness, Soil adjusted vegetation index SAVI, Normalized Differences Water Index (NDWI) and the Built-Up Areas Index (BAI), we exact impervious surfaces using random forests from the ZiYuan-3 in part area of Wuhan. This research shows that overall accuracy and kappa coefficient of RF were 0.98 and 0.96, respectively. It is higher than decision tree (DT) and artificial neural networks (ANNs) methods.
2. RANDOM FORESTS
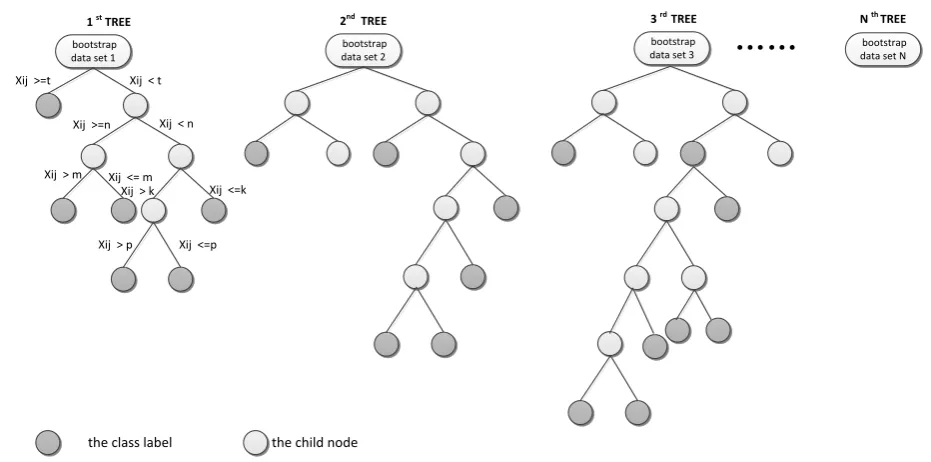
In 2001 a random forest (RF) algorithm, which is an ensemble of many classification or regression trees designed to produce accurate predictions that do not overfit the data, has been proposed by Breiman 2001 . Combining Breiman’s bagging sampling method (1996a) and the random selection of features introduced individually by Ho (1998) and Amit and Geman (1997), it perform excellently for linear and nonlinear prediction by keeping the balance between bias and variance. Additionally, the advantages of RF include (Fawagreh et al.
,
2014):1. Accuracy of classification is very high 2. Less human intervention is required 3. Data can provide additional description 4. Operation is fast
Random forest algorithm, therefore, is increasingly being applied to remote sensing image classification and regression analysis model (Dye et al., 2012; Akar and Güngör, 2015; Im et al., 2012). tree is independently determined employing a bootstrap sample of the data set. m predictors of each node ,which is specifying one of the standard parameters, are randomly sampled as a subset of predictor variables, simultaneously the best split between these variables is selected optimally in random split selection. Another standard parameter is the number of trees to be grown. The results of RF are obtained via majority voting (Breiman, 2001). The procedure is as follows:
1. n observations is randomly selected with replacement from the training data to obtain a bootstrap sampler 2. m predictors are selected at random from predictor
variables. When tree splitting is terminated, there are only one class is present at each terminal node Once all N trees are grown in the forest, predicted class label are voted with each classifier, afterwards the class label that receives the most vote is deemed to classify the instance.
3. COMBINING THE SPECTRAL INDICES AND TEXTURE INFORMATION
With the increase of the spatial resolution, detail features of the ground objects become even more significant. But due to the influence of city landscape heterogeneity, the intra class spectral variability enhancement, and synonyms spectrum phenomenon is obvious. Shadow, which is produced by terrain fluctuation, high buildings and tree canopies, is seriously interfering with the spectrum of the underlying surface of the shadow area. And the area covered by the shadow may contain many kinds of features such as broken grass and road, and it also makes the identification of impervious surface more difficult. High-resolution remote sensing images typically involve only the visible and near-infrared bands. It is difficult to deal with the problem of within-class variability relying solely on spectral characteristics. In order to reduce the influence of the phenomenon of synonyms spectrum, texture information and object-oriented technology has been widely used (Zhang et al., 2014; Moran, 2010). Texture is the change of image color as a grade function, which can be applied to edge detection and reduce the variation in spectral class. The key to obtain the suitable texture information is the choice of image, the size of the window and the method of texture calculation (Frohn and Chaudhary, 2008; Zhang et al., 2014). In order to improve the classification accuracy, this paper selects the spectral indices and texture features as new bands to join the original image.
3.1 The spectral variables
In this study the spectral variables used consisted of the ZiYuan-3 visible and four spectral indices, including Brightness, Soil adjusted vegetation index (SAVI), Normalized Differences Water Index (NDWI) and the Built-Up Areas Index (BAI) in order to increase the classification accuracy. For the extraction of water information from remote sensing imagery, the normalized difference water index (NDWI) was proposed by McFeeters (1996). Then, Water features have positive values and thus are enhanced, while other ground objects usually have zero or negative values. Because of the lack of middle infrared band, the modified NDWI (MNDWI), even though outstanding in removing built-up land noise, was abandoned. Furthermore, the SAVI (Alhammadi and Glenn, 2008), increased the different between buildings and vegetation, has been used for estimating vegetation cover however the NDVI is more suitable for detecting a wide range of vegetation densities. Moreover the SAVI is more robust, since they account for the contribution of
the soil background. Developed by Mhangara et al. (2011), the Built-Up Areas Index has good performance in detecting asphalt and concrete surfaces. It is a very robust index that remains relevant even if it is calculated on an image with some vagueness. Moreover the brightness method (Hsieh et al., 2011; Zhou et al., 2009) , which was defined as the mean of the four multispectral bands red, green, blue, and near infrared, is useful in distinguishing shadows and non-shadows. The spectral indices are calculated as: G= the second band of the ZiYuan-3 image B= the third band of the ZiYuan-3 image NIR= the fourth band of the ZiYuan-3 image
3.2 Texture analysis
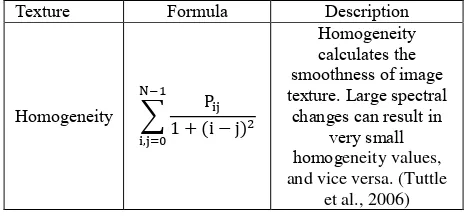
Many studies have shown that texture analysis supplies an alternative to spectral analysis by employing a combination of shape, size and spectral data to classify image, and increases the performance of multispectral image classification. In addition, to a certain extent, object-oriented technology and texture information reduce the noise and increase the classification accuracy. In this paper, a texture filter of Co-Occurrence Measures used a co-occurrence matrix to calculate texture values, was applied. The co-occurrence matrix is a function of both the angular relationship and distance between two neighbouring pixels. It shows the number of occurrences of the relationship between a pixel and its specified neighbour. Haralick et al (1973) represented this as a "gray-tone spatial-dependence matrix". Their implementation took the sum of all four directions (0°, 45°, 90°, and 135°) into account between neighbouring cells that are separated by some distance. These filters contained mean, variance, homogeneity, contrast, dissimilarity, entropy, second moment, and correlation. This approach described the probability of any grey level arising spatially relative to any other grey level within a moving window, as shown in Table 1.
Table 1. Co-occurrence texture measures used in this study
Texture Formula Description i, j = adjacent texture pixel
4. EXPERIMENTS AND ANALYSIS 4.1 Study area
Located in the middle and lower reaches of the Yangtze River, Wuhan is a significant scientific research and education base of
China. It is one of the best cities in the development of Chinese higher education, and the third largest scientific and educational cantered city only second to Beijing, Shanghai. According to statistics, from 2002 to 2012, the number of lake was reduced from more than 200 to about 160 in Wuhan, and correspondingly total area of Wuhan urban construction is growing year by year, from 455.06 km2 (2006) to The International Archives of the Photogrammetry, Remote Sensing and Spatial Information Sciences, Volume XLI-B7, 2016
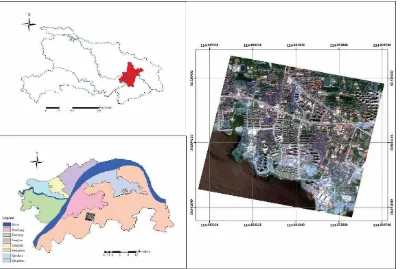
507.54km2(2011), with a five-year growth rate 11.53%.This shows that the rapid development of the city makes the land use types change frequently in urban areas. And urban construction and expansion makes artificial construction surface replace the original wetland lakes and other kind of natural surface. The impervious surface area increases every year and has a centralized distribution characteristics. The study area (Figure 2) covers 3.125 km2 with canter coordinates 114° 21 20 E, 30° 30 14 N. It has been selected because: (1) Adjacent to the Nan lake, it contains rich information of environments and land covers; and (2) in recent years, the rapid development of the city led to great changes in hydrological characteristics. Water-logging caused by the heavy rainfall occurs frequently in Wuhan, which brings huge economic loss and bad effect. According to the urban waterlogging risk map produced by Water Affairs Bureau and Meteorological Bureau of Wuhan in 2013, there are 20 level risk points and the number of \ level risk points is 15 and 32, respectively. Therefore we chose one of level risk points---the Gaofen community as study area.
The image acquired from the ZiYuan-3 remote sensing images in August 2012. The ZiYuan-3--- a Chinese Earth observation satellite was successfully launched on January 9, 2012 by a Long March 4B rocket from China. It provides assistance 84
degrees north and 84 degrees south latitude of area measurement and carries three high-resolution panchromatic cameras and an infrared multispectral scanner (IRMSS) .The ground-facing camera records images with a spatial resolution of 2.5m and 51.1km ground swath, while the other two (front-facing and rear-(front-facing) records images with a spatial resolution of 4.0m and 52.3km ground swath. In addition, IRMSS produces images with a spectral resolution of 6.0m and 51.1km ground swath. And it has much significance to conduct surveys on monitor resources, help with natural disaster reduction and prevention and agriculture, water conservation, urban planning. First of all, the DN values are converted to reflectance (range 0-1) by the radiometric calibration, and then an atmospheric correction was applied to image pre-processing. From the image cropped a typical waterlogging area with 500 x 500 pixel size for experiments, soil adjusted vegetation index(SAVI), Brightness, Normalized Differences Water Index (NDWI), the Built-Up Areas Index (BAI) and the mean and homogeneity characteristics obtained by texture filtering based on second-order matrix are calculated respectively . As new bands, these features are added to the random forest classification to improve the classification accuracy (Ghimire and Miller, 2010; Xu, 2013).
Figure 2. (a) The administrative boundary of Wuhan in Hubei province (b) Part of the administrative region of Wuhan (c) the ZiYuan-3 image of Wuhan in 2012
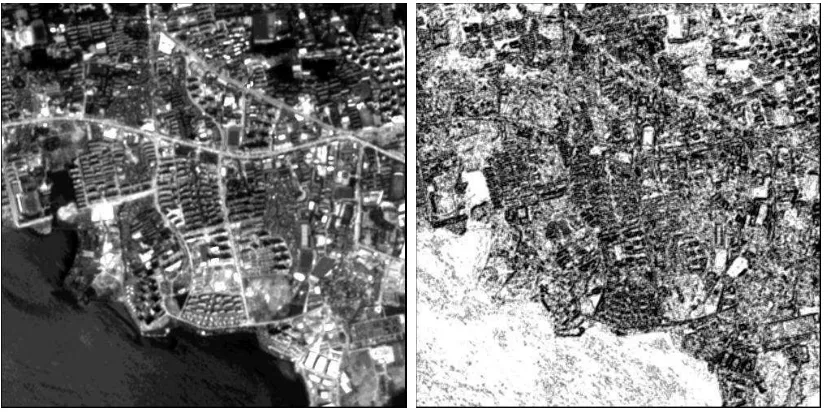
4.2 Calculate the spectral indices and texture features The feature index and texture feature of the image are calculated from the pre-processed image, mainly including SAVI, Brightness, NDWI, BAI and the mean and homogeneity
characteristics obtained by texture filtering based on co-occurrence matrix. Window size used for texture filtering is 3 x 3 pixels, as shown in Figure3 and Figure4.
(a) (b)
(c) (d)
Figure 3. The spectral indices (a) SAVI (b) NDWI (c) BAI (d) Brightness
(a) (b)
Figure 4. Co-occurrence texture measures (a) Mean (b) Homogeneity
4.3 Calculate the spectral indices and texture features A certain amount of sample was extracted and Google Earth images were used as references in identifying land covers. The two thirds of training samples are input to the classifier, and the remaining one third of training samples is used to calculate the error rate of the model. Data processing and analysis were carried out in ArcGIS 10.1, ENVI5.1, and Matlab R2013a. The
experimental error rate was 0.375, lower than 0.5, so the model can be used for classification. Results of random forest are shown in Figure 5(b), besides, Figure 5(a) shows study area. In order to verify the classification effect of this method, the classification method of decision tree (DT) and artificial neural networks (ANNs) are used for a comparison. Classification results are shown in Figure 5(c)-(d).
(a) (b)
(c) (d)
Water Veg IS Soil
Figure 5. (a) The study area (b) Results of RT(c) Results of DT (d) Results of ANNs
4.4 Accuracy assessments
In this paper, confusion matrix is used to evaluate the accuracy of the classification results. The total numbers of pixels for impervious and non-impervious surfaces were 2346 and 3041, respectively. The numbers of regions of interest for impervious, vegetation, water and soil were 2346, 1109, 1298 and 634. Due to the lack of bare soil area in study area, the total numbers of
regions of interest for soil was least. In this paper, we didn’t
extract shadow as a class.
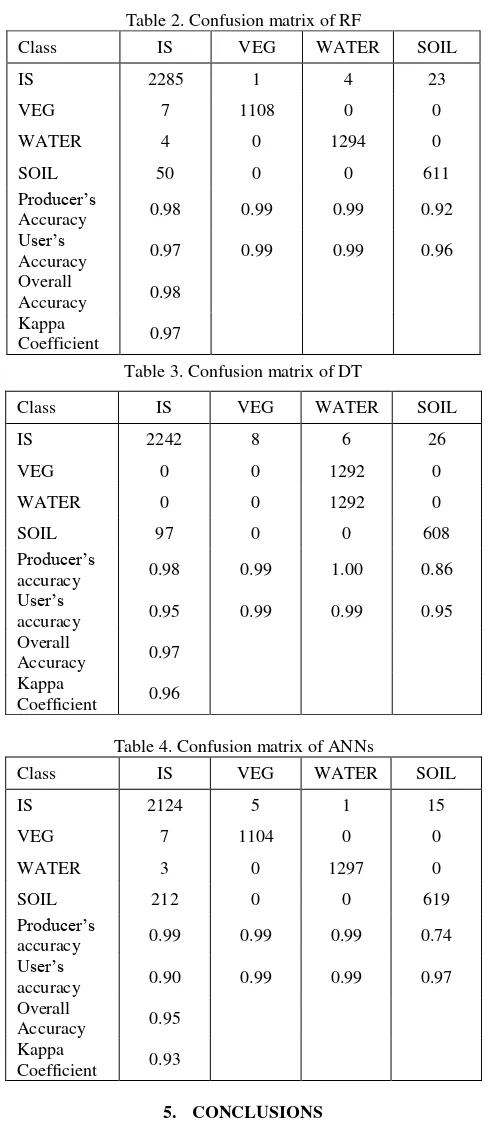
Overall accuracy and kappa coefficient of RF were 0.98 and 0.96, respectively. It is higher than the other methods. The
user’s accuracy and producer’s accuracy were 0.97 and 0.98,
respectively. According to Table 1-3, there was only a tiny gap between these methods. Furthermore, it showed that there were 61 sample points of impervious surfaces was mistaken for non-impervious surfaces, 7 sample points located in vegetation, 4 in the water, and 50 in soil, respectively. Due to spectral confusion of heterogeneous impervious surfaces, soil is one of the classes were most easy mistaken for impervious surfaces. Table 1-3 shows the classification accuracy of different methods.
Table 2. Confusion matrix of RF
Table 3. Confusion matrix of DT
Class IS VEG WATER SOIL
Table 4. Confusion matrix of ANNs
Class IS VEG WATER SOIL be used in the treatment of high dimensional data. RF, DT, and ANNs all showed strong classification performance. Specifically, RF is now possible to exploit multiple feature data to map impervious surface, and to resolve confusion between impervious surface and soil with similar spectral characteristics. And it was found to be an effective and robust tool for combining spectral and texture remote sensing image for impervious surface extraction. Compared to ANNs and DT, RF algorithms showed higher classification accuracy. Impervious surface is most likely to be confused with bare soil, followed by water, because bare soil and impervious surface have a high
similarity on the spectrum. For the reason that the best model was achieved using the RF backward variable selection method, four spectral indices and texture variables were used. Accuracy
assessment indicated that the producer’s accuracy and a kappa
coefficient yield 0.98 and 0.96, respectively. However, more research is needed to evaluate useful feature selection, which at present is based on spectral information solely. And many scholars also consider class-imbalance and -overlap the linchpin for the application of RF.
ACKNOWLEDGEMENTS
This research was financially supported by the National Science & Technology Specific Projects under Grant 2012YQ16018505, 2013BAH42F03, Shenzhen science and Technology Development Foundation (JCYJ20120618162928009) ,
Special Project on the Integration of Industry, Education and Research of Guangdong Province (2012B090500016), and Guangzhou Science and Technology Development Foundation (201504291602178)
REFERENCES
Grinand, C. et al., 2013. Estimating deforestation in tropical humid and dry forests in Madagascar from 2000 to 2010 using multi-date Landsat satellite images and the random forests classifier. Remote Sensing of Environment , 139, pp. 68-80.
Wu, C., 2009. Quantifying high ‐ resolution impervious surfaces using spectral mixture analysis
.
International Journal of Remote Sensing, 30(11), pp. 2915-2932.Fei, Y.,Bauer, M. E., 2006. Mapping impervious surface area using high resolution imagery: a comparison of object-based and per pixel classification.
Lu, D., Hetrick, S.,Moran, E., 2011. Impervious surface mapping with Quickbird imagery. International Journal of Remote Sensing, 32(9), pp. 2519-2533.
Yuyu, W., YQ, Z., 2008. Extraction of Impervious Surface Areas from High Spatial Resolution Imagery by Multiple Agent Segmentation and Classification. Photogrammetric Engineering & Remote Sensing, 74(7), pp. 857-868.
Frohn, R. C.,Chaudhary, N., 2008. Multi-scale Image Segmentation and Object-Oriented Processing for Land Cover Classification. Giscience & Remote Sensing, 45(4), pp. 377-391.
Mohapatra, R. P.,Wu C., 2008.Sub pixel Imperviousness Estimation with IKONOS Imagery: An Artificial Neural Network Approach. Taylor & Francis Group, London.
Kühnlein, M., Appelhans, T., Thies, B.,Nauss, T., 2014. Improving the accuracy of rainfall rates from optical satellite sensors with machine learning — A random forests-based approach applied to MSG SEVIRI. Remote Sensing of Environment , 141, pp. 129-143.
Schneider, A., 2012. Monitoring land cover change in urban and peri-urban areas using dense time stacks of Landsat satellite data and a data mining approach. Remote Sensing of Environment , 124, pp. 689-704.
Breiman, L., 2001. Random Forests. Machine Learning, 45(1), pp. 5--32.
Breiman, L., 1996a. Bagging Predictors. Machine Learning, 24(2), pp. 123-140.
Ho, T. K., 1998. The Random Subspace Method for Constructing Decision Forests. IEEE Transactions on Pattern Analysis & Machine Intelligence, 20(8
)
, pp. 832-844.
Amit, Y.,Geman, D., 1997. Shape Quantization and Recognition with Randomized Trees. Neural Computation, 9(7), pp. 1545-1588.
Fawagreh, K., Gaber, M. M.,Elyan, E., 2014. Random Forests: From Early Developments to Recent Advancements. Systems Science & Control Engineering An Open Access Journal , 2(1), pp. 602-609.
Dye, M., Mutanga, O.,Ismail, R., 2012. Combining spectral and textural remote sensing variables using random forests: predicting the age of Pinus patula forests in KwaZulu-Natal, South Africa. Journal of Spatial Science, volume 57(2), pp. 193-211.
Akar, Ö.,Güngör, O., 2015. Integrating multiple texture methods and NDVI to the Random Forest classification algorithm to detect tea and hazelnut plantation areas in northeast Turkeyf. International Journal of Remote Sensing, 36(2), pp. 442-464.
Im, J., Zhenyu, L., Rhee, J.,Quackenbush, L. J., 2012. Impervious surface quantification using a synthesis of artificial immune networks and decision/regression trees from multi-sensor data. Remote Sensing of Environment, 117, pp. 102-113.
Zhang, Y., Zhang, H.,Lin, H., 2014. Improving the impervious surface estimation with combined use of optical and SAR remote sensing images. Remote Sensing of Environment, 141, pp. 155-167.
Moran, E. F., 2010. Land Cover Classification in a Complex Urban-Rural Landscape with Quickbird Imagery. Photogramm Eng Remote Sensing, 76(10), pp. 1159-1168.
Frohn, R. C.,Chaudhary, N., 2008. Multi-scale Image Segmentation and Object-Oriented Processing for Land Cover Classification. Giscience & Remote Sensing, 45(4), pp. 377-391.
Zhang, Y., Zhang, H.,Lin, H., 2014. Improving the impervious surface estimation with combined use of optical and SAR remote sensing images. Remote Sensing of Environment, 141, pp. 155-167.
McFEETERS, S. K., 1996. The use of the Normalized Difference Water Index (NDWI) in the delineation of open water features. International Journal of Remote Sensing, 17(7), pp. 1425-1432.
Alhammadi, M. S.,Glenn, E. P., 2008. Detecting date palm trees health and vegetation greenness change on the eastern coast of the United Arab Emirates using SAVI. International Journal of Remote Sensing, 29(6), pp. 1745-1765.
Mhangara, P., Odindi, J., Kleyn, L., Remas, H., 2011. Road extraction using object oriented classification
.
Africageodownloads Info.
Hsieh, Y. T. et al., 2011. Automatic extraction of shadow and non-shadow landslide area from ADS-40 image by stratified classification. In: 2011 IEEE International Geoscience and Remote Sensing Symposium (IGARSS), Vancouver, BC, pp. 3050-3053.
Zhou, W., Huang, G., Troy, A., Cadenasso, M. L., 2009. Object-based land cover classification of shaded areas in high spatial resolution imagery of urban areas: A comparison study.
Remote Sensing of Environment, 113(8), pp. 1769–1777.
Haralick, R. M., Shanmugam, K.,Dinstein, I., 1973. Textural Features for Image Classification. Systems Man & Cybernetics IEEE Transactions on, 3(6), pp. 610-621.
Tuttle, E. M., Jensen, R. R., Formica, V. A.,Gonser, R. A., 2006. Using remote sensing image texture to study habitat use patterns: a case study using the polymorphic white-throated sparrow ( Zonotrichia albicollis ). Global Ecology & Biogeography, 15(4), pp. 349-357.
Ghimire, B.,Miller, J. R. J., 2010. Contextual Land-Cover Classification: Incorporating Spatial Dependence In Land-Cover Classification Models Using Random Forests And The Getis Statistic. Remote Sensing Letters, 1(1), pp. 45-54.
Xu, H., 2013. Rule-based impervious surface mapping using high spatial resolution imagery. International Journal of Remote Sensing, 34(1), pp. 27-44.