IMPROVED MODEL-BASED POLARIMETRIC DECOMPOSITION USING
THE POlINSAR SIMILARITY PARAMETER
H. Latrache a,*, M. Ouarzeddine a,*, B. Souissi a
a University of Sciences and Technology Houari Boumediene (USTHB), Faculty of Electronics and Computer Science, Image Processing and radiation Laboratory, BP 32, El-Alia, Bab-Ezzouar 16111, Algiers, Algeria. Tel: +21321 247 912, Fax:
+21321 247 187.
E-mail:
[email protected],
[email protected],
[email protected]Theme Sessions ,ThS 7
KEYWORDS: Model based decomposition, orientation angle, Polarimetric SAR Interferometry, polarimetric interferometric similarity parameter. Volume model.
ABSTRACT:
In this paper, we present a new approach to solve the problem of volume scattering ambiguity in urban area, for that we propose a volume model based on the polarimetric interferometric similarity parameter (PISP) . The new model is more adaptive and fits better with both forest and oriented built-up areas. Thereby, a new model-based polarimetric decomposition scheme is developed. To test the performance of the proposed method ESAR PolInSAR L bande data of Oberpfaffenhofen, Germany is used. Comparison experiments show that the proposed method gives good results, since all the oriented built-up areas are well discriminated as double or odd bounce structures.
1. INTRODUCTION
Polarimetric target decomposition is a useful technique for better understanding the scattering mechanisms for polarimetric SAR (PolSAR) image (Lee, 2009). The main purpose of target decomposition is to divide the polaremetric (scattering matrix, covariance or coherency matrix) into sum of scattering mechanisms, each one corresponding to a certain physical meaning. Model-based decomposition is directly related to the physical scattering mechanisms, and commonly used (Freeman, 1998)- (Yamaguchi, 2005). However, these decomposition methods adopting fixed scattering model are not adaptive, which cause overestimation of volume component, and are not sensitive to the directional scattering features (Xu, 2013). The orientation angle affects the decomposition results because it increases the HV components which cause the overestimation of volume scattering , even when this effect is corrected some urban areas still behave like vegetation area. Recently Polarimetric SAR Interferometry (PolInSAR) data is used to overcome this problem, since it is difficult to discriminate between vegetation and oriented urban using PolSAR. PolInSAR is much more sensitive to the distribution of orientated scatterers compared to PolSAR. Chen et al (chen, 2011) (chen, 2014) proposed an adaptive volume model using the PolInSAR coherence that gave good results. A new decomposition method using a polarimetric interferometric similarity parameter (PISP), which is calculated from PolInSAR data, is proposed in (Xu, 2013) were used as criteria for chosen the volume model. In this paper we have proposed an adaptive volume model using interferometric similarity
parameter (PISP),. We have chosen this parameter because the values of PISP are high in case of Building area, and are low in vegetation area. This parameter is related directly to the urban structures,and hence a new model based decomposition scheme is proposed.
2. PALRIMETRIC INTERFEROMETRIC SIMILARITY PARAMATER
A fully polarimetric interferometric systems use two antennas to measure the same ground area with slightly different image geometry. Each antenna measure scattering matrice S1 and S2 which is defined as (Lee, 2009):
�= (ℎℎ�ℎ� ℎ��
� ���) (1)
Where i = 1, 2 represents the master and slave images, respectively.
In this work, backscattering reciprocity is assumed, i.e. hv= vh.. The scattering matrix [S] can be vectorized using two basis, the Pauli basis and the Lexicographic straightforward vectorization (Lee, 2009):
� �=√ [ℎℎ�+ ��� ℎℎ�− ��� ℎ��] (2)
��= [ℎℎ� √ ℎ�� ���] (3)
Where the subscript p and l denote Pauli and Lexicographic basis respectively. The covariance matrices of the two basis are defined as:
The International Archives of the Photogrammetry, Remote Sensing and Spatial Information Sciences, Volume XLI-B7, 2016
XXIII ISPRS Congress, 12–19 July 2016, Prague, Czech Republic
This contribution has been peer-reviewed.
= � . �∗ = � . �∗
(4)
Where superscript T denotes the transpose operation, and the superscript (*) denotes complex conjugate. [T] is the coherence matrix and [C] is the covariance matrix.
The similarity parameter between the two scattering matrix S1 and S2 is defined as (Yang, 2001): the absolute values of the components denotes the square sum of the absolute values of the components of the vector.
The similarity parameter is independent of the spans of the scattering matrices, and of the target orientation angle (Yang, 2001).This parameter is convenient to extract characteristics of a target using PolInSAR data.
3. MODEL BASED DECOMPOSITION BASED ON
SIMIlARITY PARAMETER
The Freeman method (Freeman, 1998) decomposed the covariance matrix C to the three scattering components: volume scattering, double bounce, and single-bounce.
[C] = f [f ] + fd[fd] + fv[fv] (6)
To calculate the volume components, several volume models have been proposed to fit with different forest structures. In this work, we have proposed a new volume model which fits with both vegetation and urban area. For that, we have used the PSIP parameter. This parameter gives high values in build up areas, so it is used to reduce the volume scattering in these areas. In the proposed method the volume scattering model is chosen adaptively using the similarity parameter r :
When r is greater or equal to 0.5, the volume scattering is not dominant. We use the proposed model based on the r, it is given by: the same steps as Freeman method (Freeman, 1998).
4. RESULTS and ANALYSIS
E-SAR L-band PolInSAR data of Oberpfaffenhofen, Germany (ESA), is used to demonstrate the performance of the proposed method. This area contains a number of typical surface features, such as roads, buildings and forest. An optical image of dataset is shown in Fig. 1. The regions surrounded with red circles represent oriented artificial structures. Results from the proposed method are compared with those from the Freeman–Durden (Freeman, 1998) and Yamaguchi (Yamaguchi,2012) decompositions.
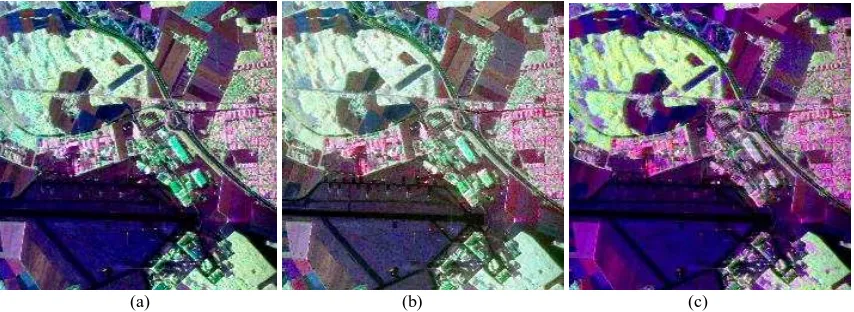
The comparison results are shown in Figure 2 . Two rectangular patches A and B in Fig. 1(a) are selected for further investigation. Patch A includes orientated buildings, while patch B contains almost pure forest. Enlarged decomposition images are shown in Figure 3.
Visually, from Figure. 2 and 3, Freeman and Yamaguchi methods give good decomposition performance for the forest areas since they are volume scattering dominate. While the oriented building which are surrounded with red circle (figure1) are decomposed as volume scattering. Oppositely, the proposed method gives better scattering mechanism discrimination for all the build-up regions which are represented as double bounce or odd bounce scattering dominant. The proposed method show her effectiveness to overcome the problem of the overestimation in the volume scattering power in case of urbain area .
The scattering power contributions of the three scattering components in patch A and B are calculated for quantitative analysis and summarized in Table 1.
The helix component is not taken into calculation. For the build-up region patch A, the double bounce pd of freeman methods is only 17,9% scattering, is underestimated. But for yamaguchi and the proposed methods Pd is increase to 24.8 % and 35.1.
The International Archives of the Photogrammetry, Remote Sensing and Spatial Information Sciences, Volume XLI-B7, 2016 XXIII ISPRS Congress, 12–19 July 2016, Prague, Czech Republic
This contribution has been peer-reviewed.
For Freeman method, the volume scattering dominant power Pv is 46.5% since most of the orientated buildings are decomposed as volume scattering. For yamaguchi and the proposed methods, P v is reduced to 33.9% and 22.1% respectively, while the surface scattering dominant power P s is increased to 41.2% and 42.6% respectively. Since there are only very small forest areas in patch A, and also the orientated buildings are isolated, the decomposition. However, for the pure forest region patch B, the Pv of yamaguchi method is 43.8% and is underestimated, while the Pv of the proposed, and Freeman methods are 57.3%, 57.2% respectively, which are more reasonable. Experiment results show that the best performance is obtained by the proposed decomposition, as the built-up regions are double or odd bounce scattering dominant while the forest regions remain volume scattering dominant.
Figure 1. E-SAR PolInSAR dataset of Oberpfaffenhofen, Germany.
(a) optical image from Google Map. (b) Master track RGB composite image with Pauli scattering Components (HH–VV, HV, and HH+VV). Three rectangular ROIs are marked
and labeled for quantitative comparison. (c ) similarity parameter.
Figure2.. Decomposition results. Processed by (a) Freeman, (b)Yamaguchi, (c) the proposed methods respectively.
Patch A
Patch B
Pd Pv Ps Pd Pv Ps
Freeman 17.9 46.5 35.4 14 57.2 28.7
Yamaguchi 24.8 33.9 41.2 21.2 43.8 34.8
Proposed method
35.1 22.1 42.6 25.7 57.3 16.8
Table 1. DOMINANT SCATTERING POWER CONTRIBUTION (%)FOR E-SAR DATA
(a) (b) (c)
(a) (b) (c)
The International Archives of the Photogrammetry, Remote Sensing and Spatial Information Sciences, Volume XLI-B7, 2016 XXIII ISPRS Congress, 12–19 July 2016, Prague, Czech Republic
This contribution has been peer-reviewed.
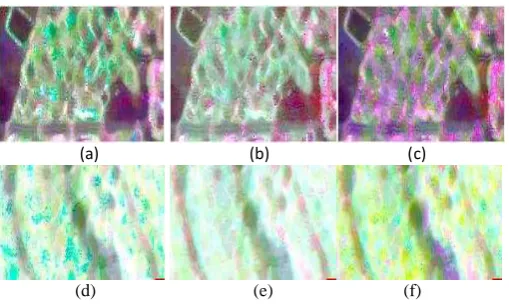
Fig. 3. Decomposition results for patches. (a)- (c) are results of Patch A, (d)-(f) are results of Patch B, processed by Freeman, Yamaguchi and the proposed methods respectively.
5. CONCLUSION
In this paper, a new volume scattering model is proposed based on the polarimetric interferometric similarity parameter (PISP). This new model has direct relationship with forest structures and can better describe the volume scattering mechanism. We have introduce the PISP condition to the three-component decomposition method of Freeman to select vegetation models adaptively. ESAR data was used to validate the proposed method and comparison experiments were carried out. The results
show that the vegetation’s overestimating problem in
urban area is solved. The proposed method identifies successfully the oriented buildings as double bounce or odd bounce.
REFERENCES
Lee, J. S., Pottier E., 2009. Polarimetric Radar Imaging: From Basics to Applications, Boca Raton, US: CRC Press..
Freeman ,A., Durden, S. L., 1998. A three-component scattering model for polarimetric SAR data. IEEE Trans. Geosci. Remote Sens., vol. 36, no. 3, pp. 963–973. Yamaguchi, Y., Moriyama, T. , Ishido, M., Yamada H.,2005. Four component scattering model for polarimetric SAR image decompostion. IEEE Trans. Geosci. Remote Sens., vol. 43, no. 8, pp. 1699–1706. Xu, L., Li, S., Yu, W. , Wang, R.,2013 Polarimetric Interferometric Similarity Parameter and Its Application in Scattering Decomposition. 2013 IEEE Radar Conference.
Chen, S.W., Sato , M.,2011 .Model Based Polarimetric Decomposition Using PolInSAR Coherence . 2011 IEEE International Geoscience and Remote Sensing Symposium.
Chen, S.W., Wang, X.S., Li, Y. Z., Sato, M. , 2014 . Adaptive Model-Based Polarimetric Decomposition Using PolInSAR Coherence. IEEE Trans. Geosci. Remote Sens, VOL. 52, NO. 3.
Yang, J., Peng, Y., Lin, S., 2001. Similarity between Two Scattering Matrices. Electron. Lett., vol. 37, no. 3, pp. 193~194.
ESA. http://earth.esa.int/polsarpro/datasets.html. Sato, A., Yamaguchi, Y., Singh, G., Park, S., 2012. Four-Component Scattering Power Decomposition with
Extended Volume Scattering Model. IEEE. GRSL, vol. 9, no. 2, pp. 166-170.
(a) (b) (c)
(d) (e) (f)
The International Archives of the Photogrammetry, Remote Sensing and Spatial Information Sciences, Volume XLI-B7, 2016 XXIII ISPRS Congress, 12–19 July 2016, Prague, Czech Republic
This contribution has been peer-reviewed.