EVALUATION OF COLOR SETTINGS IN AERIAL IMAGES
WITH THE USE OF EYE-TRACKING USER STUDY
J. Mirijovsky a*, S. Popelka a
aDepartment of Geoinformatics, Faculty of Science, Palacký University Olomouc, 77146, Olomouc, Czech Republic (jakub.mirijovsky, stanislav.popelka)@upol.cz
Commission III, WG III/5
KEY WORDS: Color settings, Eye-tracking, Spectroradiometer, User study, Reflectance, UAS
ABSTRACT:
The main aim of presented paper is to find the most realistic and preferred color settings for four different types of surfaces on the aerial images. This will be achieved through user study with the use of eye-movement recording. Aerial images taken by the unmanned aerial system were used as stimuli. From each image, squared crop area containing one of the studied types of surfaces (asphalt, concrete, water, soil, and grass) was selected. For each type of surface, the real value of reflectance was found with the use of precise spectroradiometer ASD HandHeld 2 which measures the reflectance. The device was used at the same time as aerial images were captured, so lighting conditions and state of vegetation were equal. The spectral resolution of the ASD device is better than 3.0 nm. For defining the RGB values of selected type of surface, the spectral reflectance values recorded by the device were merged into wider groups. Finally, we get three groups corresponding to RGB color system. Captured images were edited with the graphic editor Photoshop CS6. Contrast, clarity, and brightness were edited for all surface types on images. Finally, we get a set of 12 images of the same area with different color settings. These images were put into the grid and used as stimuli for the eye-tracking experiment. Eye-tracking is one of the methods of usability studies and it is considered as relatively objective. Eye-tracker SMI RED 250 with the sampling frequency 250 Hz was used in the study. As respondents, a group of 24 students of Geoinformatics and Geography was used. Their task was to select which image in the grid has the best color settings. The next task was to select which color settings they prefer. Respondents’ answers were evaluated and the most realistic and most preferable color settings were found. The advantage of the eye-tracking evaluation was that also the process of the selection of the answers was analyzed. Areas of Interest were marked around each image in the grid and the sequences of gaze movements were analyzed. Sequence chart was used for visualization and eye-tracking metrics were statistically tested. The presented paper shows the differences in the perception and preferences of aerial images with different color settings.
1. INTRODUCTION
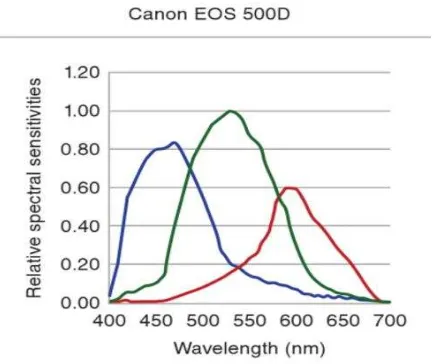
Orthophoto mosaic is composed of several aerial images which are geometrically correct. One step of the whole processing is a color adjustment. There is not only one method how to create realistic orthophoto mosaic with uniform colors. It depends on few factors. The whole problem starts during data capturing. It is clear that recent cameras have different spectral sensitivities, and D/A converter has to convert a total sum of radiance in each spectral band to a digital number for each pixel.
Kriss (2015) describes the spectral sensitivities for few cameras. The problematic of color reproduction on the digital images depends on few factors. For example ISO and exposure settings also form spectral sensitivity of the camera sensor. Results from the imaging are images which do not respect the reality.
The final step after geometric corrections is orthophoto mosaicking. During this process can be applied color corrections on the images. This process is crucial for the final product. There are two reasons for color correction. Firstly: aerial images can be acquired in different weather condition, and images can have different colors. Color corrections can remove artefacts which are caused by different exposures or sun and weather condition. Second reason for improving colors in aerial images is that the final result has to be “nice” for people. Each country and each
* Corresponding author
company which creates products from aerial images have different procedures for creating good orthophoto mosaic.
Figure 1. Spectral sensitivity of Canon EOS 500D (Kriss 2015)
Color corrections are computed based on overlap areas of the original images. Detailed information how to produce good orthophoto mosaic describes Thirsgaard Rasmussen (2010). The basic question is which color corrections are the best for aerial
images? Orthophoto mosaic should be nice for customers and also it should be natural, and it should respect the reality. We confronted few color settings with 24 users and based results from an eye-tracking experiment we discussed the results below. Dong et al. (2014) states that in the majority of eye-tracking studies, the emphasis is given to the interpretation of vector maps. The application of eye-tracking for interpreting information-dense displays like remotely sensed imagery is limited. Dong et al. (2014) performed an eye-tracking study using two variants of the aerial image - unmodified and enhanced using image processing routines common to Remote Sensing. Histogram Segmented Stretch, Co-occurrence-based Texture Filtering, and Gaussian Low-Pass Filtering were applied to enhance the image. This enhancement improved both the effectiveness of and efficiency in identifying areas of interest.
The difference between ambient (global) and focal (local) gaze behavior during observation of aerial and terrestrial scenes was investigated by Pannasch et al. (2014). The results showed that the ambient to focal strategy is preserved across both perspectives. However, it was found that for aerial views, the duration of the first fixation is prolonged showing immediate processing difficulties. Moreover, the inability to use normal scanning patterns was found for the aerial images.
Davies et al. (2006) performed an initial proof-of-concept experiment to see whether visual attention measures could distinguish anything meaningful with aerial imagery and with non-student users. The test images consisted of randomly generated samples from Ordnance Survey’s aerial photography database. The results suggest, unexpectedly, that experience with aerial imagery leads experts to be more responsive to visual saliency than novices.
2. METHODS
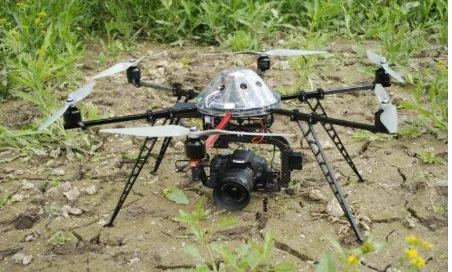
For the aerial imaging, we used the Hexacopter XL aircraft. It is a multi-rotor platform equipped with six propellers and a maximum payload of 1.5 kg. The imagery was taken using a Canon EOS 500 D camera (15 Mpx) and specially calibrated lens with a fixed focal length of 20 mm (figure 2). The height of the aerial imaging was 50 meters, and main targets were asphalt, concrete, water, soil, and grass. The camera was set to the time priority regime with 1/800 s. Aperture was added automatically based on light condition. It means that the camera decided what the correct exposure settings is. More information about aerial imaging with the unmanned aerial system can be found in Miřijovský and Langhammer (2015). We used ASD HandHeld 2 spectrometer for collecting the real electromagnetic spectra in a visible range. It can help to determine the real colors for each surface. The spectral resolution of the ASD device is better than 3.0 nm.
Figure 2. Hexakopter XL
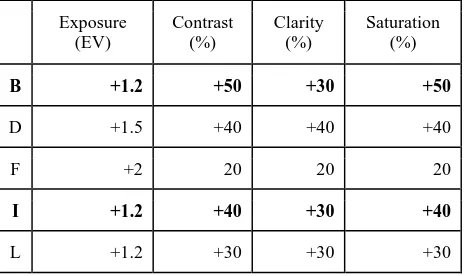
For image corrections, Adobe Photoshop Lightroom 5 and Photoshop CS6 were used. Four parameters were used for correcting images - exposure, contrast, clarity, and saturation. Exposure controls overall exposure settings. There can be added some EV (exposure value) to the image. EV can be positive or negative. Contrast is defined as the separation between the darkest and brightest areas of the image. Increasing contrast increase the separation between dark and bright, making shadows darker and highlights brighter. Clarity adds depth to an image by increasing local contrast. Saturation adjusts the saturation of image colors equally from –100 (monochrome) to +100 (double the saturation). Table 1 shows the settings which were applied to the original image. Original image from camera is identified
Table 1. Applied settings on aerial images
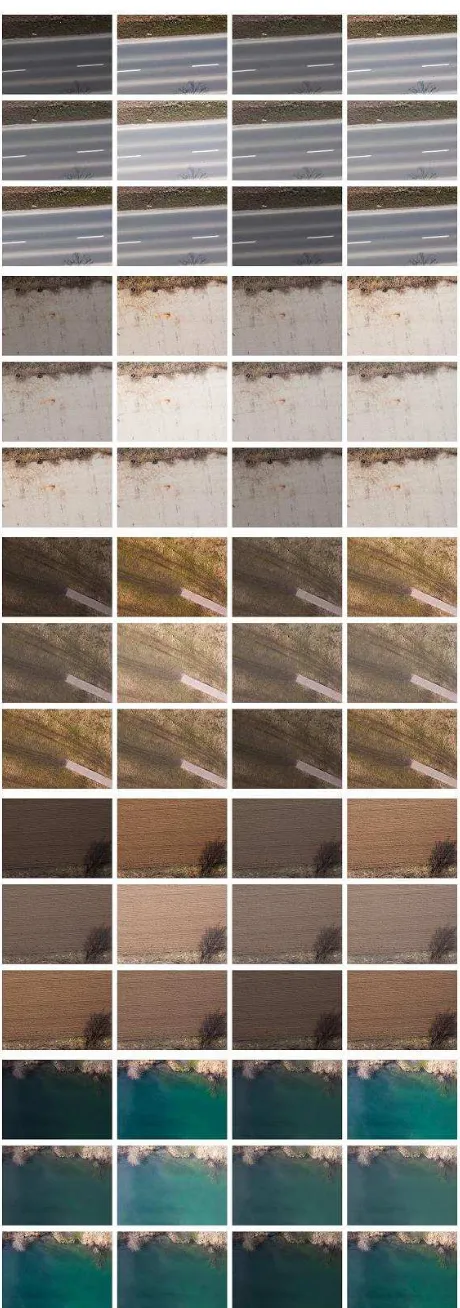
Images with one type of the surface and appropriate color settings were collected together in Photoshop CS6. Results of this preprocessing are images for each surface with 12 individual color settings. Images with individual color settings were added to the overall picture randomly (Figure 3).
The eye-tracking technology is based on the principles of tracking human eye movements while perceiving the visual scene. The measurement device most often used for measuring eye movements is commonly known as eye-tracker (Brychtova et al., 2012). Most of the modern eye-trackers measure the eye position and gaze direction using the remote method - Pupil-Corneal Reflection. The camera in the eye-tracker identifies the center of the pupil and corneal reflection of a closely situated direct infrared light source. The information is then analyzed to extract eye rotation from changes in reflections.
Figure 3. Overall image for all types of surfaces with appropriate color settings
The eyes move in a number of different ways, simultaneously responding to commands from a number of different brain areas. One of the most important types of eye movement is not really a movement at all, but rather the ability to keep the eye trained on a fixed spot in the world. This is known as fixation. Our visual experience is generally made up of a series of fixations on different objects. To get from one fixation to the next, the eyes make rapid, ballistic movements known as saccades. (Hammoud and Mulligan, 2008).
It is important to define the exact detection algorithm for eye movement analysis because different parameterizations of an algorithm might lead to different results. Plenty of algorithms exist, but mostly used for low-speed data (up to 250 Hz) is I-DT, which takes into account the close spatial proximity of the eye position points in the eye movement trace (Salvucci and Goldberg, 2000).
The algorithm defines a temporal window which moves one point at a time, and the spatial dispersion created by the points within this window is compared against the threshold. For the case study, software SMI BeGaze and OGAMA were used. In both software, ID-T algorithm was used for fixation detection. Threshold values in BeGaze were set to 80ms for “Duration threshold” and 50px for “Dispersion threshold”.
In OGAMA, most important parameters are “Maximum distance” and “Minimum number of samples”, which corresponds to dispersion and duration in BeGaze. Thresholds in OGAMA were set to 15px (distance) and 10 samples. More information about this setting is described in Popelka (2014). The eye-tracking experiment was created from the edited images. An eye-tracking device SMI RED 250 was used. Eye-tracker was situated in the eye-tracking laboratory, where windows were covered with non-transparent foil to unify the lighting conditions. Within the study, data were recorded with the frequency of 250Hz. Eye positions were recorded every 4 ms. Eye-tracker was supplemented by web camera, which records participant during the experiment. This video helped to reveal the possible cause of missing data, respondents’ reactions to the stimuli and their comments to the particular stimuli.
The experiment contained five stimuli corresponding to five types of land cover. Stimuli were presented in the random order. The experiment was created in SMI Experiment Center and was presented on the sRGB calibrated 23’’ monitor EIZO CS230 with a resolution of 1920x1080 px. At the beginning of the experiment, the purpose of the experiment was explained to the respondents. The task in the experiment was: “select which color variant in the stimuli will you choose for the orthophoto”. Total of 27 respondents participated in the experiment, but due to the bad calibration results (deviation >1° of visual angle) or low tracking ratio (<95%), three respondents were excluded from the results. Finally, we used data from 24 respondents (16 males and 8 females). The respondents were pregraduate and postgraduate students of geoinformatics. Participants were not paid for the testing.
3. RESULTS
The data were analyzed in the SMI BeGaze and open-source application OGAMA (Voßkühler et al., 2008). For the data conversion, developed tool smi2ogama (available at www.eyetracking.upol.cz/smi2ogama) was used. The advantage of OGAMA more user-friendly work with Areas of Interest (AOI). The grid of 12 AOIs corresponding to the images in the stimuli was created in OGAMA (Figure 4).
Figure 4. Created grid of Areas of Interest in the stimulus displaying 12 variants of grass. The circles in the images represents the amount of detected fixations
The number of fixations detected in each AOI was analyzed together with the number of clicks representing respondents’ answers. The information about mouse clicks was exported directly from the BeGaze application. The results are summarized in Table 2. The lowest number of fixations was detected for AOIs A,C,E,G and K. No participant select them (with a mouse click).
Table 2. The comparison of Fixation Count and Number of Clicks between 12 AOIs for all five analyzed land covers
The highest values of Fixation Count were observed for AOIs B,D,F,I and L. These values correlates with the number of recorded clicks. The similar situation was found for the eye-tracking metric Dwell Time (Figure 5). This metric shows how much time respondents spent looking in a defined Area of Interest.
Figure 5. Boxplot showing the values of eye-tracking metric Dwell Time for all stimuli together
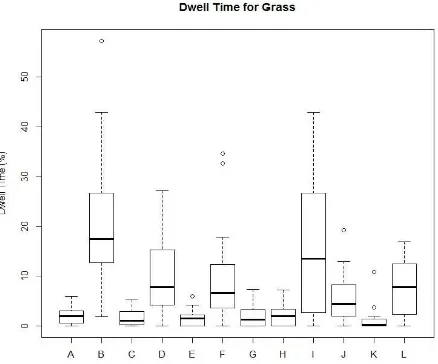
For the individual stimuli with particular land covers, the situation looks very similar. An example is in Figure 6. This figure shows the boxplot for stimulus with grass. Two AOIs with the highest Dwell Time were those that were most often chosen as the best ones (each had eight clicks).
Figure 6. Boxplot showing the values of eye-tracking metric Dwell Time for stimulus with grass
Data were statistically analyzed with the use of posthoc Nemenyi test. Statistically significant differences for Dwell Time measure were found between the pairs that are marked with bold in Table 3.
Table 3. Statistically significant (bold) Dwell Time values between AOIs of stimuli with grass
Eye-tracking data could also be visualized with the use of Sequence Chart that shows the temporal sequence of the visited Areas of Interest (Popelka, 2015). The Figure 7 shows again the stimulus with grass land cover. Areas with longer Dwell Time (AOI B,D,F,I and L - according to Figure 6) were colored in the shades of red. The rest of AOIs are yellow. Each line of the Sequence Chart represents data from one participant. The length of the line shows the duration of stimulus observation. It is evident that all participants spent the majority of time in the AOIs with selected (red) AOIs.
Figure 7. The Sequence Chart of the stimulus with grass land cover. The AOIs with longer Dwell Times are marked with the shades of red. The rest is in yellow
4. DISCUSSION
Problematics of color corrections of the aerial images and orthophoto mosaics is complex, and it is clear that the results of the experiments are subjective. Each person feels the colors differently, and thus we cannot use any exact metrics for evaluating the suitability of color settings. The eye-tracking experiment was performed to reveal the subjective attitudes of the respondents towards each color settings.
The experiment presented in this paper was focused only on the specific type of surfaces. For complex evaluation of color corrections of the aerial images it should be necessary used the specific color settings for each surface to the wider area. It is clear that optimal settings for one surface could not be optimal for another.
5. CONCLUSION
The eye-tracking experiment was conducted to find which color of the five different land covers is favorable by the 24 respondents of the experiment. The analysis of respondents answers data shows that majority of the participants chosen only between five color settings (AOI B,D,F, I and L) which correspond to settings shown in Table 4. Based on results from eye-tracking experiment, color settings B and I can be considered as the best results for all surface types.
Exposure
Table 4. Statistically significant (bold) Dwell Time values between AOIs of stimuli with grass
The same findings were detected during the analysis of eye-movement data. Fixation Count and Dwell Time metrics correlates with respondents answers. For deeper analysis, the stimulus with grass land cover was selected. Statistical analysis with the use of post hoc Nemenyi test was performed, and the data were visualized using sequence chart.
ACKNOWLEDGEMENTS
This paper was supported by projects of Operational Program Education for Competitiveness – European Social Fund (projects CZ.1.07/2.3.00/20.0170), of the Ministry of Education, Youth and Sports of the Czech Republic and the student project IGA_PrF_2016_008 of the Palacky University.
REFERENCES
Brychtova, A., Popelka, S., Vozenilek, V., 2012. The analysis of eye movement as a tool for evaluation of maps and graphical outputs from gis, in: Svobodova, H. (Ed.), Proceedings of the 19th International Conference on Geography and Geoinformatics: Challenge for Practise and Education, pp. 154-162.
Davies, C., Tompkinson, W., Donnelly, N., Gordon, L., Cave, K., 2006. Visual saliency as an aid to updating digital maps. Computers in human behavior 22, 672-684.
Dong, W., Liao, H., Roth, R.E., Wang, S., 2014. Eye tracking to explore the potential of enhanced imagery basemaps in web mapping. The Cartographic Journal 51, 313-329.
Hammoud, R.I., Mulligan, J.B., 2008. Introduction to Eye Monitoring, Passive Eye Monitoring. Springer, pp. 1-19.
Kriss, M., 2015. Color Reproduction for Digital Cameras, Handbook of Digital Imaging, p. 68.
Miřijovský, J., Langhammer, J., 2015. Multitemporal Monitoring of the Morphodynamics of a Mid-Mountain Stream Using UAS Photogrammetry. Remote Sensing 7, 8586-8609.
Pannasch, S., Helmert, J.R., Hansen, B.C., Larson, A.M., Loschky, L.C., 2014. Commonalities and differences in eye movement behavior when exploring aerial and terrestrial scenes, Cartography from pole to pole. Springer, pp. 421-430.
Popelka, S., 2014. Optimal eye fixation detection settings for cartographic purposes. 14th SGEM GeoConference on Informatics, Geoinformatics and Remote Sensing 1, 705-712 pp.
Popelka, S., 2015. Decision scheme for the selection of the most appropriate method for analyses and visualization of eye-tracking data in cartographic research, International Multidisciplinary Scientific GeoConference Surveying Geology and Mining Ecology Management, SGEM, 2 ed, pp. 803-810.
Salvucci, D.D., Goldberg, J.H., 2000. Identifying fixations and saccades in eye-tracking protocols, Proceedings of the 2000 symposium on Eye tracking research & applications. pp. 71-78.
Thirsgaard Rasmussen, A., 2010. Color adjustment of orthophotos. Technical University of Denmark, DTU, DK-2800 Kgs. Lyngby, Denmark.
Voßkühler, A., Nordmeier, V., Kuchinke, L., Jacobs, A.M., 2008. OGAMA: open-source software designed to analyze eye and mouse movements in slideshow study designs. Behavior research methods 40, 1150-1162.