Speculative Activity and Stock Market
Volatility
Arjun Chatrath, Sanjay Ramchander, and Frank Song*
This paper examines the impact of speculative futures trading on the volatility of the S&P 500 index. The empirical approach taken allows for more specific inferences regarding whether speculators ought to be targeted for regulation. There is no evidence that speculators contribute to market volatility. Although there are strong indications that futures open interest is contemporaneously related to cash market volatility, volatility and speculative are only weakly related. Further, there is an absence of causality between cash market volatility and speculative commitments. The study also distinguishes between a possible impact of contract size and number of traders. We document a positive contem-poraneous relationship between cash market volatility and the size of the commitments of large speculators. However, there is no evidence that the changes in the number of speculators or the size of their holdings result in increased levels of interday or intraday cash market volatility. Based on the findings, the proposals for further regulation directed at stock index speculation seem unwarranted. © 1998 Elsevier Science Inc.
Keywords: Volatility; Speculations
JEL classification: G1
I. Introduction
Observers of financial markets have often questioned the role of futures trading in the volatility of stock prices [see, for instance, the Brady Commission Report (1988) and the U.S. Securities and Exchange Commission (SEC) Report (1988)]. Central to their con-cerns is the steady rise in the popularity of stock index futures. The average futures open interest on the most popular S&P 500 index rose from 54,611 contracts in 1985, to over 193,400 contracts in 1995. Although much of the interest in stock index futures may be
School of Business Administration, University of Portland, Portland, Oregon Department of Finance, Insurance and Real Estate, Mankato State University, Mankato, Minnesota Department of Economics, Cleveland State University, Cleveland, Ohio and School of Economics and Finance, University of Hong Kong, Hong Kong. Address correspondence to Frank Song, Department of Economics, Cleveland State University, Euclid Avenue at East 24th Street, Cleveland, OH 44115.
attributed to the growth in the hedging activities of institutional traders, index futures have also attracted the participation of a variety of other traders, including index arbitrageurs, scalpers, and day traders.
Despite their relatively minor participation in index futures, speculators and small traders are often singled out as major contributors to volatility in stock markets. It has been argued that the leverage afforded in futures markets attracts speculators in search of short-term gains, and there are concerns that these traders may be causing or exacerbating stock market volatility. For instance, the SEC described the role of futures in the 1987 crash as follows:
“ . . . The existence of futures on stock indexes and the use of various strategies involving ‘program trading’ were a significant factor in accelerating and exacerbating the decline.” [U.S. Securities and Exchange Commission Report (1988, pp. 3–11)]
Such arguments have translated to a call for increased regulation, especially since the crash of October 1987, whereby speculators and small traders have been the target for stricter control via measures such as increased margin requirements, program trading curbs, and through the generally more active governance of the Commodity Futures Trading Commission (CFTC) [for instance, see the U.S. Securities and Exchange Com-mission Report (1988, p. 65); the Brady ComCom-mission Report (1988, p. 66)].1
This study provides further evidence on whether or not futures speculation leads to greater stock market volatility. Whereas prior studies on the impact of futures trading have generally examined the derivative trading-cash volatility relationship in the context of aggregate volume or open interest [for instance, see Bessembinder and Seguin (1993); Darrat and Rahman (1995)], this study employs disaggregated futures open interest data which allows us to make more specific inferences regarding whether speculators ought to be targeted for further regulation. We present empirical evidence on the relationship between alternate measures of cash market volatility in the S&P 500 index, and the commitment of speculators, the number of speculators, and the size of their commitments. Position limits and margin requirements in futures markets (including equity indexes) have been altered widely and often, possibly to contain speculator participation (in both, their numbers and contractual holdings), though it is far from clear that speculators have a destabilizing influence on markets.2 The examination of the relationship between volatility and speculator numbers and average contract size should go a long way to addressing this matter. The paper also evaluates the role of excessive speculation in cash market volatility, where excessive speculation is defined as the commitments of specu-lators over and above that which is required to fill hedging imbalances.
The results suggest only a weak positive contemporaneous relationship between cash volatility and the commitments of speculators. In fact, we found that speculative com-mitments have a relatively smaller influence on cash volatility as compared to other commitments. Moreover, there is little evidence to indicate that the positions of specu-lators or their numbers lead cash market volatility. Based on the findings, the proposals for further regulation directed at stock index speculation seems unwarranted.
1The surveillance powers of the CFTC are the combined product of several enactments and amendments,
including the Commodity Exchange Act (1936, 1968), the Commodity Futures Trading Commission Act of 1974, and the Futures Trading Acts of 1978, 1982. For details of the current regulatory measures and proposals, see the Committee on Banking, Finance, and Urban Affairs (1988).
2There is no evidence that suggests the effectiveness of margin requirements in reducing cash market
The remainder of the paper is organized as follows. Section II reviews the past literature on the subject of the futures index activity– cash market volatility relationship. Section III describes the data and methodology employed. Section IV presents the empirical results. Section V summarizes the findings of the study.
II. Prior Research
Opponents of speculative trading activity have generally argued that increased trading in futures leads to unnecessary price volatility in the underlying cash markets. Some researchers have suggested that the participation of speculative traders in systems which allow high degrees of leverage lowers the quality of the information in the market [Figlewski (1981); Stein (1987)]. Cox (1976), among others, noted that uninformed traders could play a destabilizing role in cash markets. Others, more generally, have questioned the role of futures markets as representing an institutional alternative for accurate price forecasting [Martin and Garcia (1981); Kolb et al. (1983)].
On the other hand, it also has been suggested that the futures markets have become an important medium of price discovery in cash markets [Schwarz and Laatsch (1988)]. Several papers have argued that trading in these markets improves the overall markets’ depth and informativeness [Powers (1970)], enhances market efficiency [Stoll and Whaley (1988)], increases market liquidity [Kwast (1986)], and compresses cash market volatility [Danthine (1978); Kyle (1985)].
Theoreticians have suggested that cash market volatility may be influenced not just by speculative trading volume, but also the number of speculators. For instance, Clark (1973) related daily price changes and the number of within-day price changes, and suggested that the variance of price changes is directly proportional to the number of traders. Tauchen and Pitts (1983) developed a model wherein the price change over an interval represents the average of the changes in the speculators’ reservation prices over the interval. The greater the number of terms in this average (i.e., the greater the number of speculators), the greater the likelihood that the effects of the changes in reservation prices will be washed out. More recently, Osler (1995) demonstrated that a rise in the number of speculators may result in lower levels of cash market volatility. Osler suggested that speculators drive a wedge between incoming information and cash market pricing, smoothing the effects of shocks to the fundamental determinants of asset prices.
III. Data and Empirical Model
Daily data on the S&P 500 cash index, which includes open, high, low and closing values, and monthly and weekly data relating to the CFTC-compiled Commitments of Traders (COT) on the S&P 500 futures index were obtained from Pinnacle Data Corporation, Webster, New York. The data spans 1/1986 –3/95 for the daily S&P 500 cash index data (2,347 observations), from 1/1986 –3/1995 for the monthly COT data (111 observations), and from 10/92–3/28/95 for the weekly COT data (131 observations).3
The COT reflects the contractual commitments of four futures trading groups, of which commercial traders, noncommercial traders, and small traders are relevant to this paper. Commercial traders are defined by the CFTC guidelines as hedgers, or those who hold positions representing a substitute for transactions to be made at a later time in the cash market. Their positions exceed the established reporting levels, i.e., the number of contracts which makes declaration of positions mandatory (300 contracts for the S&P 500 contract). Noncommercial traders are speculators, either short or long, whose holdings exceed the reporting levels. Small-trader positions do not exceed the reporting levels, and no distinction is made regarding the traders’ motives. The fourth trader group is spreaders, defined as traders who simultaneously hold positions in the cash and futures markets. The proportion of futures traders who are spreaders has been negligible for the S&P 500 index. Hence, this group was not included in the analysis of the impact speculation on cash market behavior.
Prior studies have employed a variety of variability measures for the purpose of examining the cash volatility–trading activity relationship. We deployed four accepted formulations which capture a range of cash market behaviors thought to be of interest to market observers. The first three are normal measures of volatility, while the fourth captures nonnormal or extreme variability in cash markets. The proxy of interday price variability isuPt2Pt21u/Pt21where Ptis the level of S&P 500 index at the close of day
t. This variable is a modified version of the absolute price change measure employed in
Ying (1966), among others. The standardization (by Pt21) here is intended to control for biases which may arise from trends in the price index. The proxy for intraday price variability is (Pt low, and mean price levels, respectively. The numerator of this price-range measure for intraday volatility has been considered by Rutledge (1979), among others. The standard-ization (by1⁄2(P
t H
1Pt L
), is intended to control for the trends in the level of the S&P 500 index. A third volatility measure is the adjusted price range, ADJR, employed in Garcia et al. (1986). This measure is constructed as follows: in the event that Pt
L
. Pt21, the difference Pt
L
2 Pt21 is added to the numerator of the intraday volatility formula. Similarly, if Pt
H
,Pt21, the difference Pt212Pt H
is added to the numerator of the intraday volatility measure. This adjustment is aimed at controlling for the patterns of overnight price jumps that will not otherwise be reflected in measures of intraday variation. The fourth measure, jumps or jump-volatility, is described in Becketti and Sellon (1989), and is designed to measure the frequency of jumps over an interval. Jumps are identified as the frequency of S&P 500 cash returns which are less than (RL21.5RQ), or greater than (Ru
1 1.5RQ), where returns5 (Pt 2 Pt21)/Pt21; RL and RU, represent the 25th and 75th
percentile of returns, and RQ5(RU2RL) is the interquartile range. The values for RUand
3The CFTC compiled the COT report once a month prior to 1991, bimonthly from 1/1991 to 10/1992, and
RLwere .0046 and 2.0037, respectively, so that (RL 2 1.5RQ)5 2.01615 and (RU 1
1.5RQ)5.0171. The Jumps measure captures the occasional and extreme changes in stock
prices, which are arguably of greatest concern to regulators and traders.
The volatility series derived from the daily S&P 500 index data are averaged over each month, and alternately, each week in the sample to match the monthly and weekly COT series. The commitments pertain to contracts of all expirations, March, June, September and December; thus, any concerns over a maturity effect in the level of trading are bypassed.
To examine the influence of speculative commitments relative to the open interest, we estimated the model:
where st represents alternate cash market volatility measures; SPECt represents the
commitments of large speculators; OItis the open interest, andaandeare the constant
and random error terms, respectively. The model employs the differenced SPEC and OI series due to nonstationarity in the level of commitments.4 SPEC, OI, and the other speculative measures employed in this study (numbers of speculators and average contract size) were found to be near-random walk variables.5 Thus, the differenced variables are interpreted as shocks to speculative participation (activity). The lag lengths in equation (1) were selected to satisfy the autocorrelation criterion as provided by the standard Durbin
h [Durbin (1970)] statistics.6
Following the popular models relating to the market impact of speculation, we also investigated the role of both the number of speculators, as well as their average commit-ments (size of holdings) in the volatility of the cash index. We did not attempt to distinguish between risk aversion and speculative intensity, an issue which may be intractable [see for instance, Driskill et al. (1991) and Osler (1995)]. Rather, the study relied on a joint hypothesis that the number of traders and their average holdings (risk aversion or speculative intensity) will influence spot volatility. The empirical model relating market volatility to speculator numbers and contract size is similar to equation (1) and is given by:
where Ntrepresents the number of speculators, and CSIZEtis the average size of contracts
held by speculators.7
4Traditional causal models are strictly appropriate only when the variables are stationary. For nonstationary
variables, they may be valid only approximately, or not at all [for instance, see Charemza and Deadman (1992)].
5For instance, the regression of SPEC
ton SPECt21provided a coefficient of .99, statistically
indistinguish-able from 1.
6Equation (1) was alternately estimated with changes in non-speculative commitments (the difference
betweenDOI andDSPEC) in place of changes in open interest as explanatory variables. The results from the
alternate specification were very similar.
7The model was also estimated with contemporaneous, lagged and leading changes in open interest as
An alternate measure of trading, Working’s (1960) speculation index (SPI), was also considered, to examine the impact of excessive speculation activity on cash market volatility. Specifically, SPI511NCL/(CML1CMS) if CML$CMS, and SPI511
NCS/(CML1CMS) if CML,CMS, where NCL and NCS are noncommercial long and
short contracts, respectively, and CML and CMS are the commercial long and short contracts, respectively. The index reflects speculative activity over and above that which is required to fill hedging imbalances. Following Ward and Behr (1983), we also constructed the upper and lower levels of this index. The upper level of the index, USPI, was constructed by assuming that the nonreporting small traders are speculators. The lower level, LSPI, was constructed by assuming that all small traders are hedgers. The examination of such indexes has regulatory implications, as regulators are mainly con-cerned about speculative activity which does not serve to address the imbalances in long and short hedging contracts.8
IV. Empirical Results
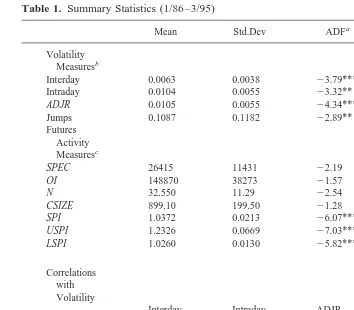
Table 1 reports monthly sample statistics and correlations pertaining to the variables employed in the regression analysis. The Augmented Dickey Fuller (ADF) test statistics presented in Panel A were consistently significant for the volatility measures and the speculative indexes, rejecting the null of nonstationarity in these series. On the other hand, the ADF statistics failed to reject the null of nonstationarity for the level SPEC (speculator commitment), OI (open interest), N (speculator number) and CSIZE (average contract size) series. The ADF statistics were significant for the first differences of these series, indicating the presence of a unit root.
The correlations reported in Panel B indicate a positive contemporaneous relationship between the change (first difference) in SPEC and OI and the four volatility measures. However, note that the correlation coefficients for DOI are much greater than those for DSPEC. These coefficients provide some preliminary indications that speculative
posi-tions are not more destabilizing than the nonspeculative posiposi-tions. The correlation coef-ficients for the remainder of the series were weak, with the exception ofDCSIZE for which
the coefficients were notable for three of four volatility measures.9
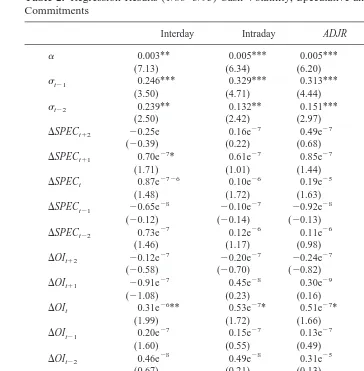
Table 2 presents the results from regression equation (1) when employing monthly data. The table also presents statistics from tests for the significance of the lagged coefficients in the regression. The results indicate that the volatility measures were positively impacted by prior levels of volatility, consistent with the popular notion of volatility clustering. Thest21coefficient was significant for all regressions, and the test statistic for the sum of the laggedsvariables was consistently significant at the 1% level. There was also evidence of a positive, contemporaneous relationship between changes in open interest and volatility. The DOIt coefficient was significant in all four volatility
equations. On the other hand, there was relatively little evidence that speculative com-mitments are positively related to stock market volatility. TheDSPEC, coefficient was
8For instance, the CFTC’s approval of the trading of any contract is contingent on its passing an economic purpose test. The test requires that the proposed contract either serve in price discovery, or be used for risk
transfer. The latter relates to the transfer of risk from hedgers to speculators [also, see Johnson (1989)].
9All measures of volatility were positively correlated, with the highest coefficient of .98 for the intraday–
significant for the intraday measure of volatility alone. Moreover, the lagged coefficients for DOI and DSPEC were consistently insignificant. Thus, there is little evidence that
price variability is any more sensitive to speculation shocks than to shocks in the position of other traders. The DSPECt11 coefficient was significant for the interday and jump measures, providing some indication that speculative positions increase following in-creased volatility.
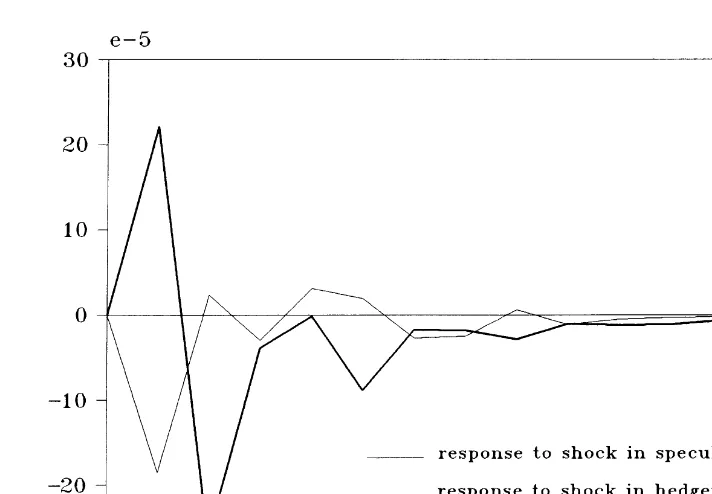
We further examined the result that volatility is no more influenced by shocks in speculative commitments than by shocks in other commitments. We traced the impulse responses of S&P 500 volatility to shocks in, alternately, the monthly number of hedging contracts and the monthly number of speculative contracts. The response functions were constructed from pairs of vector autoregressive equations with only lagged regressors (with lags of 1 and 2) permitted in the regressions. The responses, presented in Figure 1,
Table 1. Summary Statistics (1/86 –3/95)
Mean Std.Dev ADFa ADF(D)
Volatility Measuresb
Interday 0.0063 0.0038 23.79*** 2
Intraday 0.0104 0.0055 23.32** 2
ADJR 0.0105 0.0055 24.34*** 2
Jumps 0.1087 0.1182 22.89** 2
Futures Activity Measuresc
SPEC 26415 11431 22.19 24.10***
OI 148870 38273 21.57 25.31***
N 32.550 11.29 22.54 25.74***
CSIZE 899.10 199.50 21.28 26.69***
SPI 1.0372 0.0213 26.07*** 2
USPI 1.2326 0.0669 27.03*** 2
LSPI 1.0260 0.0130 25.82*** 2
Correlations
D) are the Augmented Dickey Fuller statistic (models with trend) which tests the null hypothesis of nonstationarity of the level series and first differenced series, respectively [see Engle and Granger (1987)]. The critical values are from Engle and Yoo (1987).
bInterday volatility given by the monthly average ofuP
t2Pt21u/Pt21, where Ptis the daily closing cash price; Intraday
volatility given by the monthly average of (Pt H
respectively; ADJR is the monthly average of the adjusted price range, and Jumps is the monthly frequency of price jumps.
cSPEC is the commitment of large speculators; NONSPEC is the commitments of all traders other than large speculators;
N is the monthly number of reporting speculators; CSIZE is the monthly average number of contracts held by speculators; SPI represents Working’s (1960) speculative index, and USPI represents the upper and lower levels of this index as formulated in Ward and Behr (1983).
indicate the prolonged influence on volatility to relatively major increments in commit-ments. As the responses were similar for all volatility measures, only the responses for intraday volatility are presented. The response functions suggest that the reaction of the S&P 500 index to speculation shocks is smaller than to hedging shocks. Moreover, the responses to hedging shocks persist for longer periods of time relative to speculative
Table 2. Regression Results (1/86 –3/95) Cash Volatility, Speculative and Non-Speculative
Commitments
Laggeds1 0.485*** 0.461*** 0.465*** 0.718***
(8.45) (6.84) (6.33) (5.31)
Durbin h 0.11 0.34 0.24 0.19
The coefficients and statistics relate to the regression:
st5a 1
O
high price and low price, respectively; 3) ADJR, which is the monthly average of the adjusted price range; and 4) Jumps, which is the monthly frequency of price jumps; SPECtand OItare the commitment of speculators and open interest in month t,
shocks. These findings are consistent with the notion that speculation activity is, in relative terms, not a destabilizing agent for cash markets.
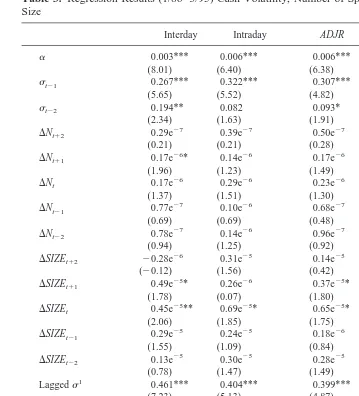
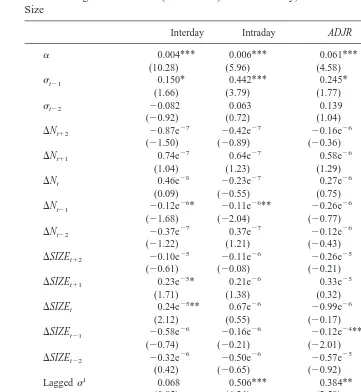
Table 3 reports the results from the solution to regression equation (2). The leadingDN
coefficient was significant for the interday volatility measure alone. However, the leading DSIZE coefficients were positive for three of four regressions, providing some evidence
that speculative interest increases (declines) following rising (falling) volatility. TheDNt
coefficient was insignificant for all regressions, indicating a lack of contemporaneous relationship between cash market volatility and the change in the number of speculators in index futures. However, theDSIZEtcoefficient was positive and significant for all but
the jumps measure of volatility. Thus, there seems to be a positive contemporaneous relationship between the average size of speculator holdings and normal cash market volatility. On the other hand, the laggedDN coefficients and the laggedDSIZE coefficients
were insignificant for all but the jumps variable. Further, the sum of the laggedDN and
sum of the laggedDSIZE coefficients, as well as the joint sums of these coefficients, were
insignificant for all but the jumps variable. In other words, as inferred from Table 2, there seems to be no causal influence running from speculative activity to normal cash market volatility. However, there seems a positive bi-directional influence running from specu-lation to the frequency of jumps in the cash market.
coefficients were consistently nonpositive. In fact, there were instances when these coefficients were significantly negative (the regressions involving interday and ADJR measures of volatility). The DNt coefficients were consistently insignificant, and the
DSIZEtcoefficients were significant for only two of four regressions. It is also notable that Table 3. Regression Results (1/86 –3/95) Cash Volatility, Number of Speculators, and Contract
Size
Laggeds1 0.461*** 0.404*** 0.399*** 0.694***
(7.23) (5.13) (4.87) (5.29)
The coefficients and statistics relate to the regression:
st5a 1
O
high price and low price, respectively; 3) ADJR, which is the monthly average of the adjusted price range; and 4) Jumps, which is the monthly frequency of price jumps; Ntand HSIZEtrepresent the number of speculators and the number of contracts held
the coefficients for lagged volatility were strikingly weaker for the more recent period. This result suggests lesser volatility clustering for the more recent interval.
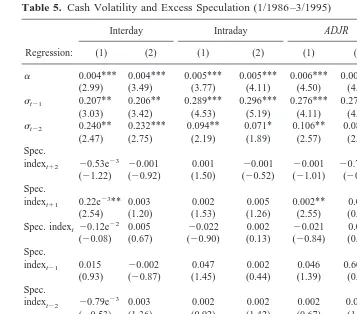
Table 5 reports the regression results that involve the speculative indexes. Given that the results pertaining to the weekly data are similar to that for the monthly data, only the results for the monthly data are presented. Further, given that the results involving SPI are almost identical to those involving LSPI, we only report the results for regressions involving SPI and USPI. The results continue to support a positive relationship between past and contemporaneous levels of volatility. However, there is little evidence of a positive and contemporaneous relationship between the measures of volatility and level of speculation, as was indicated in Tables 2, 3 and 4. Moreover, neither the lagged (U)SPI coefficients, nor the sum of these coefficients were significant. Thus, the level of excess speculation does not seem to have had a causal influence on the variability of cash markets, measured either in terms of normal volatility, or in terms if nonnormal (jump) volatility. This finding is especially important to regulators, since their concerns are directed more to speculation which does not serve to fill hedging imbalances. In other words, there are indications that the positive influence of speculation on jumps found in Table 3 arises mainly due to the interaction of large speculators and hedgers.
Over all, the regression results in Tables 2–5, and Figure 1 can be summarized as follows. First, the evidence suggests autoregressive patterns in the volatility measures. Second, there is weak evidence of a positive, contemporaneous relationship between the commitments of speculators and cash market volatility. Third, there is no evidence to indicate that the number and average holdings of speculators increase interday, intraday, or ADJR spot market volatility. Furthermore, there is no evidence that excessive specu-lation causes cash market volatility, however measured. Fourth, speculative positions tend to increase following increased volatility. In other words, speculators may be reacting to volatility, rather than causing it. Finally, the impulse responses indicated that speculative contracts have a smaller and less lasting influence on spot volatility than hedging contracts.10
V. Conclusions
Market observers often argue that speculators are major contributors to cash market volatility. Such arguments have translated to increased regulation via measures such as margin requirements and program trading curbs. This paper has examined whether speculators have the implied influence on cash market volatility. We evaluated the relationship between cash market volatility in the S&P 500 index, and speculative futures commitments, the number of futures speculators, and the size of their holdings over the interval 1/1986 –3/1995.
We found no evidence that speculators contribute to market volatility. Although there were strong indications that futures open interest is contemporaneously related to cash market volatility, volatility and speculative were only weakly related. Further, there was an absence of causality between cash market volatility and speculative commitments. The study also distinguished between a possible impact of contract size and number of traders. There was no evidence to indicate that changes in the number of traders and in the size
10The volatility-futures trading activity relationship was also tested in the context of open interest. The
of their holdings lead interday or intraday cash market volatility. There was some evidence that the level of speculation does cause a rise in the frequency of jumps in cash markets. However, this causality cannot be attributed to the level of speculation in excess of hedging imbalances; an index reflecting speculator and small-trader participation over and
Table 4. Regression Results (10/92–3/95) Cash Volatility, Number of Speculators, and Contract
Size
Laggeds1 0.068 0.506*** 0.384** 0.038
(0.85) (6.24) (2.58) (0.41)
The coefficients and statistics relate to the regression:
st5a 1
O
and low price, respectively; 3) ADJR, which is the weekly average of the adjusted price range; and 4) Jumps, which is the weekly frequency of price jumps; Ntand HSIZEtrepresent the number of speculators and the number of contracts held by speculators
above the levels required to fill hedger imbalances was found to have no association with cash market volatility. The findings are consistent to a host of studies which have analyzed aggregated data for financial and commodity futures, and the results are not consistent with the notion that the positions of speculators and small traders are especially prone to contributing towards cash market volatility.
In conclusion, it appears that speculators are not to be blamed for stock market volatility, and further regulation directed at these traders seems unwarranted. This con-clusion is consistent with prior research which also supports the notion that further
Table 5. Cash Volatility and Excess Speculation (1/1986 –3/1995)
Regression:
Interday Intraday ADJR Jumps
(1) (2) (1) (2) (1) (2) (1) (2)
a 0.004*** 0.004*** 0.005*** 0.005*** 0.006*** 0.005*** 0.032** 0.029** (2.99) (3.49) (3.77) (4.11) (4.50) (4.24) (2.17) (1.99)
st21 0.207** 0.206** 0.289*** 0.296*** 0.276*** 0.276*** 0.399*** 0.398***
(3.03) (3.42) (4.53) (5.19) (4.11) (4.26) (4.22) (4.02)
st22 0.240** 0.232*** 0.094** 0.071* 0.106** 0.087** 0.277** 0.276**
(2.47) (2.75) (2.19) (1.89) (2.57) (2.22) (2.32) (2.27) Spec.
3** 0.003 0.002 0.005 0.002** 0.003 0.021 0.057
(2.54) (1.20) (1.53) (1.26) (2.55) (0.62) (0.90) (0.93) Spec. indext 20.12e2
2 0.005
20.022 0.002 20.021 0.004 0.043 0.158 (20.08) (0.67) (20.90) (0.13) (20.84) (0.37) (0.10) (0.88)
3 0.003 0.002 0.002 0.002 0.003* 0.024 0.038
(20.53) (1.36) (0.92) (1.42) (0.67) (1.83) (0.60) (0.82) Laggeds 0.448*** 0.438*** 0.382*** 0.367*** 0.382*** 0.363*** 0.677*** 0.675***
(6.97) (7.44) (5.28) (5.51) (4.86) (4.99) (4.75) (4.54) Lagged
spec. index 0.014 0.75e23 0.049 0.41e22 0.048 0.004 0.483 0.042
(0.83) (0.36) (1.44) (0.98) (1.52) (0.85) (1.00) (0.82)
Adjusted R2 .08 .08 .08 .08 .07 .06 .32 .33
Durbin h 20.37 20.15 20.37 20.19 20.41 20.27 0.65 0.38
The coefficients and statistics relate to the regressions:
st5a 1
O
wheresis alternately: interday volatility given by the monthly average ofuPt2Pt21u/Pt21; intraday volatility given by the monthly average of (PH2PL)/1⁄2(PH1Pt); ADJR is the monthly average of the adjusted price range, and Jumps is the monthly
regulation would not contribute to the stability of the stock market. There remains the question as to whether the evidence generated for the stock market can be generalized to commodity markets and to other financial markets.
The authors thank the reviewers for their valuable comments. All remaining errors are ours.
References
Becketti, S., and Sellon, G. H., Jr. Has market volatility increased? 1989. Federal Reserve Bank of
Kansas City, Economic Review 74:17–30.
Bessembinder, H., and Seguin, P. J. Dec. 1992. Futures trading activity and stock price volatility.
Journal of Finance 47(5):2015–2034.
Bessembinder, H., and Seguin, P. J. 1993. Price volatility, trading volume and market depth: Evidence from futures markets. Journal of Financial and Quantitative Analysis 28(1):21–39. Brady Commission Report. Jan. 1998. Report of the Presidential Task Force on Market
Mecha-nisms.
Charemza, W. W., and Deadman, D. F. 1992. New Directions in Economic Practice. London: Edward Elgar Publishing.
Chatrath, A., Ramchander, S., and Song, F. 1995. Does options trading lead to greater cash market volatility? Journal of Futures Markets 15(7):785–803.
Choi, H. and Subrahmanyam, A. 1994. Using Intraday data to test for Effects of Index Futures on the underlying stock markets. Journal of Futures Markets 14(3):293–322.
Clark, P. K. Jan. 1973. A subordinated stochastic process model with finite variance for speculative prices. Econometrica 41(1):135–155.
Committee on Banking, Finance and Urban Affairs. May 1988. US House of Representatives. Cox, C. C. 1976. Futures Trading and Market Information. Journal of Political Economy 84:1215–
1237.
Danthine, J. 1978. Information, Futures Prices, and Stabilizing Speculation. Journal of Economic Theory 17:79–98.
Darrat, A. F., and Rahman, S. 1995. Has futures trading activity caused stock price volatility?
Journal of Futures Markets 15(5):537–557.
Durbin, J. 1970. Testing for serial correlation in least-squares regression when some of the regressors are lagged dependent variables. Econometrica 38:410–421.
Driskill, R., McCafferty, S., and Sheffrin, S. M. 1991. Speculative intensity and spot and futures price variability. Economic Inquiry 29:737–751.
Edwards, F. R. 1988. Futures trading and cash market volatility: Stock index and interest rate futures. Journal of Futures Markets 8(4):421–439.
Engle, R. F., and Granger, C.W.J. March 1987. Co-integration and error correction: Representation, estimation, and testing. Econometrica 55(2):251–276.
Engle, R. F., and Yoo, B. S. 1987. Forecasting and testing in co-integrated systems. Journal of
Econometrics 35:143–159.
Figlewski, S. 1981. Futures Trading and Volatility in the GNMA Futures. Journal of Finance 36(2):445–456.
Garcia, P., Leuthold, R. M., and Zapata, H. 1986. Lead-lag relationships between trading volume and price variability: New evidence. Journal of Futures Markets 6(1):1–10.
Kolb, R. G., Gay, G., and Jordan, J. 1983. Futures prices and expected future spot prices. Review
of Research in Futures Markets 2:110–123.
Kyle, A. S. Nov. 1985. Continuous auction and insider trading. Econometrica 53(6):1315–1335. Kwast, M. L. 1986. Futures markets and transaction costs. In Financial Futures and Options in the
U.S. Economy (M. L. Kwast, ed.). Washington, D.C.: Federal Reserve Board of Governors, pp
1–38.
Martin, L., and Garcia, P. 1981. The price-forecasting performance of futures markets for live cattle & hogs: A disaggregated analysis. American Journal of Agricultural Economic 63:209–215. Osler, C. L. July 1995. Short-term speculators and the origins of near-random-walk exchange rate
behavior. Federal Reserve Bank of New York Staff Reports 3:1–66.
Powers, M. J. 1970. Does futures trading reduce price fluctuations in cash markets? American
Economic Review 60(3):460–464.
Rutledge, D.J.S. 1979. Trading volume and price variability: New evidence of the price effects of speculation. In International Futures Trading Seminar. Chicago: Chicago Board of Trade, pp. 160–174.
Santoni, G. J. 1987. Has programmed trading made stock prices more volatile? Federal Reserve
Bank of St. Louis, Economic Review 69:18–29.
Schwert, W. 1990. Stock market volatility. Financial Analysts Journal 46(3):23–34.
Schwarz, T. V., and Laatsch, F. 1988. Price discovery and risk transfer in stock index cash and futures markets. Review of Futures Markets 7(2):272–289.
Seguin, P. J., and Jarrel, G. A. Sept. 1993. The irrelevance of margin: Evidence from the crash of ’87. The Journal of Finance 48(4):1457–1473
Skinner, D. J. 1989. Option Markets and Stock Return Volatility. Journal of Financial Economics 23(1)61–78.
Stein, J. C. Dec. 1987. Information Externalities and Welfare-Reducing Speculation. Journal of Political Economy 95(6):1123–1145.
Stoll, H. R., and Whaley, R. E. 1988. Volatility and futures: Message versus messenger. Journal of
Portfolio Management 14(2):20–22.
Tauchen, G. E., and Pitts, M. March 1983. The price variability-volume relationship on speculative markets. Econometrica 51(2):485–505.
U.S. Securities and Exchange Commission (SEC). Feb. 1988. The October 1987 Market Break. Ward, R. W., and Behr, R. M. 1983. Futures trading liquidity: An application of a futures trading
model. Journal of Futures Markets 3(2):207–224.