Genetic Diversity of Indonesian Physic Nut (
J. curcas
) Based on Molecular Marker
Darmawan Saptadi1), Rr. Sri Hartati2), Asep Setiawan3), Bambang Heliyanto4) and Sudarsono3*)
1)Faculty of Agriculture University of Brawijaya
Jl. Veteran Malang 65145 East Java Indonesia
2) Indonesian Centre for Estate Crops Research and Development (ICERD)
3) Plant Molecular Biology Laboratory Department of Agronomy and Horticulture Faculty of Agriculture
Bogor Agricultural University
4) Indonesian Sweetener and Fibre Crops Research Institute (ISFRI)
*) Corresponding author E-mail: [email protected]
Received: October 20, 2015 /Accepted: March 9, 2017
ABSTRACT
Various reports of molecular genetic diversity evaluation of physic nut (J. curcas) have given inconsistent results. Part of the reasons were because of the used of unrealiable markers. This study was conducted to evaluate genetic diversity of Indonesian physic nut germplasm using four types of molecular markers (RAPD, ISSR, SSR and SCAR markers). Twenty four J. curcas accessions planted in Pakuwon, Sukabumi, with various phenotypes were evaluated. Twenty eight SSR marker loci yielded monomorphic allele pattern and indicated that the evaluated accessions probably were all genetically homogeneous for the respective loci. Eight RAPD and 4 ISSR primers out of the total 31 tested primers produced scoreable markers and some (i.e. UBC 873, OPG 17, OPP 03 and OPQ 11 primers) generated polymorphics markers. Genetic similarity coeficiens among evaluated accessions ranged from 0.6 to 1.0 with a population mean of 0.9 indicating low diversity and narrow genetic background among accessions in all populations. Therefore, breeding program utilizing such population would only result in low genetic gain. Based on the evaluated SCAR markers, all accessions belonged to the non-toxic Mexican type of physic nut. This information is important inputs for designing future physic nut breeding strategies in Indonesia.
Keywords: germplasm characterization; molecular analysis; SSR markers
INTRODUCTION
One of the limiting factors in the cultivation and commercialization of J. curcas as the biofuel
producer was the unavailability of high yielding and high oil content varieties (Surwenshi, Kumar, Shanwad, & Jalageri, 2011). Availability of germplasm with high genetic diversity is the basic requirement for J. curcas genetic improvement. Information on genetic diversity is useful for selecting parents for breeding programs and germplasm management. Results of genetic diversity analysis could be used as the decision making tool to avoid duplicate collections. Therefore, availability of reliable methods for assessing J. curcas genetic diversity is essential. As in many different plants (Kustanto, Basuki, Sugiharto, & Kasno, 2012; Zulhermana, Sudarsono, Asmono, & Yulismawati, 2010; Saptadi, Hartati, Setiawan, Heliyanto, & Sudarsono, 2011; Ajambang, Sudarsono, Asmono, & Toruan, 2012; Sutanto, Hermanto, Sukma, & Sudarsono, 2013), molecular marker could potentially be used to asses
J. curcas genetic diversity.
Collection and phenotype diversity analysis of J. curcas germplasm have been done in various countries, such as in India, China, Brazil and Indonesia (Ou, Wang, & Li, 2009; Tatikonda et al., 2009; Hartati, Setiawan, Heliyanto, Pranowo, & Sudarsono, 2009). The presence of high variation in morphological characters has also been noted by several researchers (Kaushik, N., Kumar, K., Kumar, S., Kaushik, N, & Roy, 2007; Kumar & Sharma, 2008). Moreover, Makkar, Becker, Sporer, & Wink (1997) reported the existence of high phenotype diversities among J. curcas accessions are from West and East Africa, North and Central America and Asia.
Indonesian Center for Estate Crop Research and Development (ICERD) maintains a collection of
J. curcas germplasm from all regions in Indonesia.
Cite this as: Saptadi, D., Hartati, R. S., Setiawan, A., Heliyanto, B., & Sudarsono. (2017). Genetic diversity of Indo-nesian physic nut (J . curcas) based on molecular marker. AGRIVITA Journal of Agricultural Science, 39(2), 160–171. http://doi.org/10.17503/agrivita.v39i2.694
There were high phenotype diversities among the accessions, such as for plant height, stem diameter, branching type, lowering dates, inlorescence, fruit bunch, fruit, and seed number per plant and seed oil content (Hartati, 2008; Hartati, Setiawan, Heliyanto, Pranowo, & Sudarsono, 2009; Sudarmo, Heliyanto, Suwarso, & Sudarmadji, 2007). However, not all of those phenotype diversities could be attributed to actual genetic diversities since previous studies indicated that there wasa large genotype by environment effects for those characters in J. curcas (Heller, 1996; Makkar, Becker, Sporer, & Wink, 1997; Kaushik, N., Kumar, K., Kumar, S., Kaushik, N, & Roy, 2007).
Evaluation of China and Indian collections of
J. curcas genetic diversity using molecular markers has been done previously (Zhang, Guo, Liu, Tang, & Chen, 2011). Unfortunately, the results were inconsistent. Basha & Sujatha (2007) reported that there were moderate diversities among 42 Indian J. curcas accessions. Ranade, Srivastava, A. P., Rana, Srivastava, J., & Tuli (2008) reported that wild, semi-wild and accessions of J. curcas
have been naturalized and therefore they showed suficient genetic diversities based on the SPAR marker analysis. Using AFLP markers, Tatikonda et al. (2009) reported that there was a wide genetic diversity among Indian J. curcas accessions. On the other hand, evaluation of 38 worldwide accessions of J. curcas using RAPD and AFLP markers by Popluechai et al. (2009) resulted in a low genetic diversity. Cai, Sun, Wu, & Peng (2010) reported, there was a high genetic diversity among 219 accessions J. curcas from China, while Sun, Li, L. F., Li, Y., Wu, & Ge (2008) reported China’s
J. curcas accessions exhibited a very low genetic diversity. The most comprehensive evaluation was conducted by Montes et al. (2008) on 225 J. curcas
accessions from 30 countries of Latin America, Africa and Asia using AFLP markers. Result of these studies indicated that J. curcas accessions from Africa and India had a low genetic diversity while those from Latin America showed a high diversity.
High phenotypic diversity in Indonesian J. curcas (Hartati, 2008; Hartati, Setiawan, Heliyanto, Pranowo, & Sudarsono, 2009) needs to be evaluated further to prove that it is representing the genetic diversity. Unfortunately, there are no available information indicating such association between phenotype and genetic diversity. Therefore,
the objectives of this study were to evaluate genetic diversity of ICERD’s J. curcas germplasm collections from various places in Indonesia using SSR, SCAR, RAPD and ISSR markers.
MATERIALS AND METHODS
The research was done at Bogor Agricultural University from July to December 2011.The plant materials were taken from Pakuwon, Sukabumi East Java owned by ICERD. The molecular marker analysis was done in the Plant Molecular Biology Laboratory (PMB Lab.), Department of Agronomy and Horticulture, Faculty of Agriculture, Bogor Agricultural University (IPB), Bogor, Indonesia.
Plant Materials
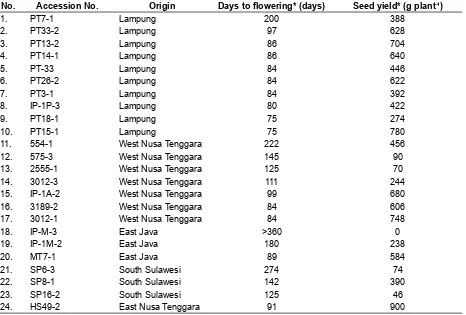
Twenty four accessions of J. curcas were evaluated. The accessions were the offsprings of the original provenances collected from various regions in Indonesia (Table 1). The samples were chosen using purposive random sampling and the samples representing each area of origin and exhibiting different morphological characters, such as contrasting days of lowering and seed yield. The sampled provenances were grown in the same ield and they were about two years old during the sample collection.
DNA Extraction
A total of 0.1 g of young leaves was collected from each sample and total nucleid acid was extracted using modiied CTAB procedure as described by Pamidimarri, Meenakshi, Sarkar, Boricha, & Reddy (2009). The isolated DNA was quantiied using UV spectrophotometer (Shimadzu UV - 1800) at λ 260 nm and its purity was determined by calculating absorbance ratio at λ 260 and 280 nm (Sambrook, Fritsch, & Maniatis, 1989).
Molecular Marker Analysis
In this research, 28 SSR loci that have been previously evaluated (Saptadi, Hartati, Setiawan, Heliyanto, & Sudarsono, 2011) and the additional 10 SSR loci derived from genomic data bases of Manihot esculenta (Wen et al., 2010; Table 2) were evaluated. Moreover, 22 RAPD primers, 9 ISSR primers, and 2 SCAR primers were also evaluated. The SCAR primers were speciically used to identify Indian type (toxic) and the Mexican type (non-toxic) of J. curcas
Table 1. Accession numbers, the progenitor origin, days of lowering and seed yield of the evaluated J. curcas accessions
No. Accession No. Origin Days to lowering* (days) Seed yield* (g plant-1)
1. PT7-1 Lampung 200 388
2. PT33-2 Lampung 97 628
3. PT13-2 Lampung 86 704
4. PT14-1 Lampung 86 640
5. PT-33 Lampung 84 446
6. PT26-2 Lampung 84 622
7. PT3-1 Lampung 84 392
8. IP-1P-3 Lampung 80 422
9. PT18-1 Lampung 75 274
10. PT15-1 Lampung 75 780
11. 554-1 West Nusa Tenggara 222 456
12. 575-3 West Nusa Tenggara 145 90
13. 2555-1 West Nusa Tenggara 125 70
14. 3012-3 West Nusa Tenggara 111 244
15. IP-1A-2 West Nusa Tenggara 99 680
16. 3189-2 West Nusa Tenggara 84 606
17. 3012-1 West Nusa Tenggara 84 748
18. IP-M-3 East Java >360 0
19. IP-1M-2 East Java 180 238
20. MT7-1 East Java 89 584
21. SP6-3 South Sulawesi 274 74
22. SP8-1 South Sulawesi 142 390
23. SP16-2 South Sulawesi 125 46
24. HS49-2 East Nusa Tenggara 91 900
Remarks: * = source: Hartati, Setiawan, Heliyanto, Pranowo, & Sudarsono (2009); one-year observation period Table 2. List of additional primers used to generate markers at 10 SSR loci for genetic diversity analysis of
J. curcas. These SSR primers were developed from available genomic database of M. esculenta
as described in Wen et al. (2010)
No. Accession No. Primer Sequences
Forward Reverse
1. JESR-083 ACAGCCTCGTCATTTCACT TAATGAATGGTTCGTAGCCT 2. JESR-086 TCCCTCTCCTTCAGATTAAA ATGATAGCCAAACAGCAACT
3. JESR-088 CCCTCCCTTTGGTTTCTG GGAGGAAAGGAGAGGAAATA
Polymerase chain reaction (PCR) was performed in a total volume of 25 µL, consisting of 0.2 μM primers, 1.25 U TaqDNA polymerase (Real Biotech Corporation), 2.5 µL 10x PCR buffer, 0.1 ΜmdNTPs (10 mM mix), 1 µL DNA template, and ddH2O as needed. The steps for PCR cycles used to amplily SSR markers were one cycle of denaturation at 95 °C for 5 minutes; 36 cycles consisting of denaturation at 94 °C for 30 seconds, primer annealing at the appropriate temperature for each primer for 30 seconds, and primer extension at 72 °C for 1 minute; and onecycle of inal extension at 72 °C for 5 minutes. PCR cycles to generate RAPD markers were one cycle of denaturation at 94 °C for 3 minutes; 45 cycles consisting of denaturation at 94 °C for 45 seconds, primer annealing at 36 °C for 30 seconds, and primer extension at 72 °C for 2 minutes; and one cycle of inal extension at 72°C for 7 minutes, whereas the PCR cycles to generate ISSR markers were one cycle of denaturation at 94°C for 4 minutes; 35 cycles consisting of denaturation at 92°C for 30 seconds, primer annealing was set at temperature according to the appropriate Ta for each primer for 1 minute, and primer extension at
72°C for 2 minutes; and one cycle of inal extension at 72°C for 7 min. PCR ampliication to generate SCAR markers were conducted as follow, one cycle of denaturation at 94°C for 4 minutes; 35 cycles consisting of denaturation at 94°C for 30 seconds, primer annealing at 56°C (ISPJ1 primers) and 54°C (ISPJ2 primers) for 15 seconds, and primer extension at 72°C for 1 minutes; and one cycle of inal extension at 72°C for 7 minutes. All PCR ampliications were done using Perkin Elmer DNA thermal cycler model PE2400.
The PCR ampliied DNA fragments of RAPD, ISSR and SCAR markers were fractionated using 1 % horizontal agarose gel electrophoresis and visualized using 1 % ethidium bromide staining. The stained DNA fragments were visualized on UV transluminescent and photographed using digital camera for records. Size control of 1 Kb DNA ladder was used to estimate the size of ampliied DNA fragments. The PCR ampliied DNA fragments of SSR markers were fractionated using vertical 6 % polyacrylamide gel electrophoresis (PAGE) on a Dedicated Height Manual Sequencer (Cole-Parmer) using 1x TBE buffer at a constant voltage of 1,100 V for 3 hours.
Table 3. List of primers used to generate RAPD markers for genetic diversity analysis of J. curcas
No Primer Name Primer Sequences No Primer Name Primer Sequences
1. OPC 10 TGTCTGGGTG 12. OPP 03 GTGGTCCGCA
2. OPC 14 TGCGTGCTTG 13. OPP 09 GGAGTGCCTC
3. OPC 18 TGAGTGGGTG 14. OPQ 11 TCTCCGCAAC
4. OPE 05 TCAGGGAGGT 15. OPQ 19 CCCCCTATCA
5. OPF 16 GGAGTACTGG 16. OPT 14 AATGCCGCAG
6. OPG 17 ACGACCGACA 17. OPU 10 ACCTCGGCAC
7. OPG 18 GGCTCATGTG 18. OPU 19 GTCAGTGCGG
8. OPH 14 ACCAGGTTGG 19. OPV 08 GGACGGCGTT
9. OPJ 15 TGTAGCAGGG 20. OPV 14 AGATCCCGCC
10. OPK 01 CATTCGAGCC 21. OPV 17 ACCGGCTTGT
11. OPK 12 TGGCCCTCAC 22. OPW 17 GTCCTGGGTT
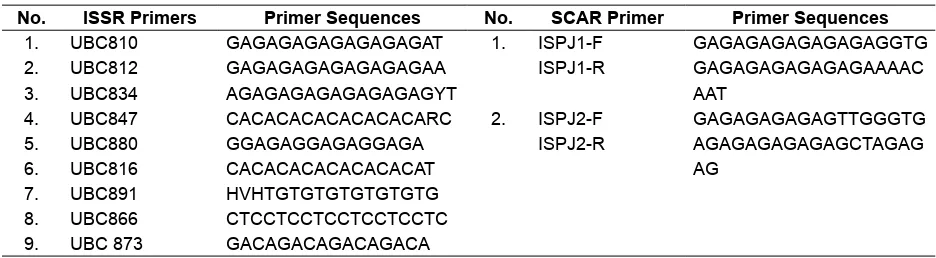
Table 4. List of primers used to generate ISSR and SCAR markers for genetic diversity analysis of J. curcas
No. ISSR Primers Primer Sequences No. SCAR Primer Primer Sequences 1. UBC810 GAGAGAGAGAGAGAGAT 1. ISPJ1-F GAGAGAGAGAGAGAGGTG
2. UBC812 GAGAGAGAGAGAGAGAA ISPJ1-R GAGAGAGAGAGAGAAAAC
3. UBC834 AGAGAGAGAGAGAGAGYT AAT
4. UBC847 CACACACACACACACARC 2. ISPJ2-F GAGAGAGAGAGTTGGGTG
5. UBC880 GGAGAGGAGAGGAGA ISPJ2-R AGAGAGAGAGAGCTAGAG
6. UBC816 CACACACACACACACAT AG
The loaded volume of the PCR product for each sample was 1.8 µL and there are 60 loaded samples per gel. The SSR markers were visualized using silver staining and 100 bp DNA ladders were used to estimate the ampliied PCR products. Data Analysis
Allele scoring for each of the generated SSR locus was conducted for the most obvious bands and the alleles were recorded based on their PCR product sizes. Scoring for RAPD and ISSR markers were carried out based on the presence or absence of PCR ampliied products. The markers will be scored ‘1’ if certain size of scorable PCR ampliied product is presence and ‘0’ if absence.
All of the generated marker data was tabulated for all evaluated individuals and primers and they were used to generate dissimilarity matrixfrom single data. Dissimilarity matric was generated using Dice as the dissimilarity index. Statistical analysis was also performed on the binary data to generate genetic similarity value (Nei & Li, 1979) using the following equation: Sij = 2a / (2a + b + c), in which: Sij is genetic similarity between individual i and j; a is number of generated PCR products for the i and the j individuals, b is number of generated PCR products appearing only in the i individuals, and c is that appearing only in j individuals. Genetic similarity was calculated using NTSys software version 2.0 (Rohlf, 1998). The percentage of polymorphism (PP) was calculated based on the ratio of total number of polymorphic loci to the total number of loci.
Principal Coordinate analysis to produce graphical representations on Euclidean plans and tree construction using weighted Neighbor Joining methods were done using previously generated dissimilarity index as the genetic distance. Boostrap analysis used 10,000 iterations. Dissimilarity index calculation, bootstap analysis, principal coordinate analysis, and tree construction were done using DARWIN Software version 6.0.13 (Perrier & Jacquemoud-Collet, 2006).
RESULTS AND DISCUSSION
SSR Marker Analysis in J. curcas
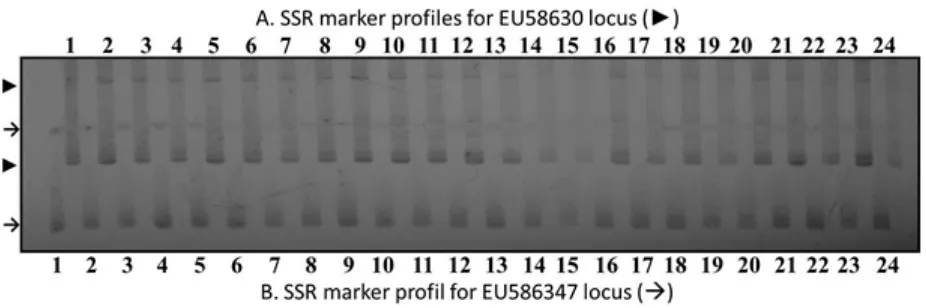
All SSR primers evaluated in this study could yield PCR products from all accessions of J. curcas genomic DNA. Nineteen primers evaluated yielded two alleles per locus while the remaining 19 yielded only one band per locus. The evaluated J. curcas speciic SSR markers (28 loci) generated
a total of 47 alleles. However, the 24 accessions of J. curcas evaluated in this study produced the same pattern of SSR allele (monomorphic pattern). Similarly, the ten SSR loci developed based on M. esculenta genome could also generate ampliied
product using J. curcas, indicating the SSR primers cross-amplify the J. curcas genome. Moreover, the generated SSR alleles using M. esculenta SSR primers were also monomorphic in all accessions of J. curcas. Example of allele patterns generated using two SSR primers in 24 accessionsof J. curcas
are presented in Fig. 1.
Previous report has indicated SSR marker analysis using accessions of J. curcas generated either one or two PCR products and the pattern of ampliied products were monomorphics across accessions (Saptadi, Hartati, Setiawan, Heliyanto, & Sudarsono, 2011). Further analysis on the progenies derived from crosses of accessions indicated the two generated PCR products were not allelic and probably from two different locis since there was no segregation between the two bands in the progenies (Saptadi, Hartati, Setiawan, Heliyanto, & Sudarsono, 2011).
Results of the current evaluation using 24 different J. curcas accessions from diverse origin in Indonesia also generated the same results as previously described in Saptadi, Hartati, Setiawan, Heliyanto, & Sudarsono (2011). All of the evaluated accessions show monomorphic banding pattern for the evaluated 28 SSR loci (Fig. 1). These results were surprising since J. curcas was a cross-pollinated plant. However, this result was similar to those of Rosado et al. (2010) which reported low level of genetic diversity among J. curcas germplasm from Brazil.
The low levels of marker polymorphisms among 28 SSR loci might be possible because of two hypotheses; it might indicate the evaluated SSR marker loci are originated from highly conserved regions of the J. curcas genome or it indicated actual low level of genetic diversity among the evaluated germplasm. The irst hypothesis could not be conirmed since there were no supporting data for the genome of the evaluated J. curcas accessions. The second hypothesis is more acceptable since SSR is a hyper variable sequences and it changes frequently in generations. Therefore, unless the low diversity of the accessions, it should detect some degrees of allele diversity among the J. curcas speciic - 28 SSR
loci evaluated. Furthermore, evaluation of additional 10 SSR loci, randomly chosen from the genome of M. esculenta (member of the same family as J. curcas), resulted in cross ampliication using genome
of J. curcas. However, there was no allele diversity among 24 accessions of J. curcas for the cross ampliied marker loci. More than 300 SSR primer pairs have been identiied to generate SSR loci from the genome of M. esculenta. No further evaluation for the SSR loci originated from M. esculenta was attempted.
The same 28 SSR loci have been used to evaluate accessions of J. curcas in China and
they have successfully been used to differentiate genotypes of the accessions (Wen et al., 2010). Therefore, since there is almost no polymorphism among Indonesian accessions of J. curcas for the 38 SSR loci evaluated, those results strongly indicated the diversity of J.curcas in Indonesia is low. Sun, Li, L. F., Li, Y., Wu, & Ge (2008) has evaluated different sets of J. curcas accessions from China and found low diversities among accessions. Furthermore, Rosado et al. (2010) also evaluated 192 accessions of J. curcas germplasm from various regions in Brazil using SSR markers. They found only one out of six loci evaluated generating polymorphic alleles.
To validate the researh inding, the DNA from additional six accessions of J. curcas from Aceh Besar, Medan, Lombok, Bima, Sumba and Papua were evaluated using the same sets of 38 SSR loci. The results also indicated thatthere was no allele polymorphism among the six accessions (data not presented). These validation results further indicating the possibility of either the low genetic diversity among J. curcas accessions from Indonesia or at least a low diversity of the genome regions where the SSR loci resided.
RAPD and ISSR Marker Analysis in J. curcas
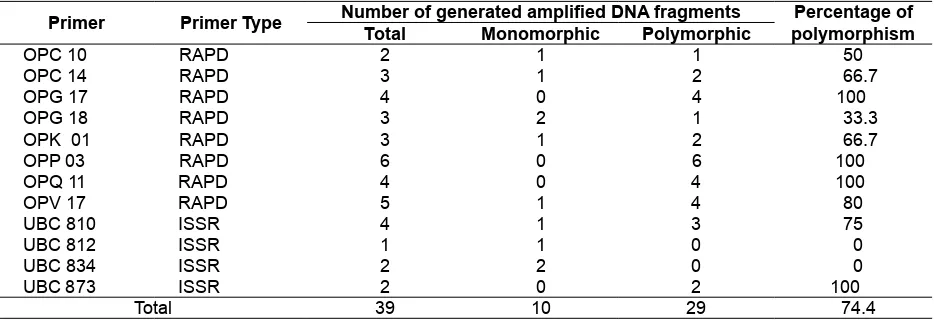
The evaluated primers have previously been reported to generate polymorphic markers for J. curcas (Basha & Sujatha, 2007). Out of the total RAPD and ISSR primers evaluated, 8 RAPD and 4 ISSR primers generated a number of scorable markers. The total numbers of PCR ampliied products was 39 fragments and 29 out of 39 fragments (74.36 %) were polymorphic. The number of generated DNA fragments ranged from 1 to 6 (Fig. 2 and Fig. 3). The UBC812 primer generated the least number and OPP33 primer generated the highest number of ampliied DNA fragments. DNA fragments ampliied using UBC873, OPG17, OPP03 dan OPQ11 primers are all polymorphics (Table 5).
no. 554-1 and HS49-2. The verage of the percentage of polymorphism was 15.9 %. There were two unique PCR ampliied DNA fragments in accession no. HS49-2 by using OPV 17 primer and in accession no. PT7-1 by using OPG 17 primers (Fig. 2 and Fig. 3).
Results of the principal coordinate analysis using 12 axis indicated that only ive axis contribute a signiicant amount of variabilities and it accounted for 85 % of variabilities among the evaluated individuals in the population. Distribution of individuals using axis 1 and 2 is presented in Fig. 4.
Table 5. Number of total ampliied DNA fragments, monomorphic and polymorphic fragments, and percentage of polymorphisms generated using the evaluated RAPD and ISSR primers
Primer Primer Type Number of generated ampliied DNA fragments Percentage of polymorphism Total Monomorphic Polymorphic
OPC 10 RAPD 2 1 1 50
OPC 14 RAPD 3 1 2 66.7
OPG 17 RAPD 4 0 4 100
OPG 18 RAPD 3 2 1 33.3
OPK 01 RAPD 3 1 2 66.7
OPP 03 RAPD 6 0 6 100
OPQ 11 RAPD 4 0 4 100
OPV 17 RAPD 5 1 4 80
UBC 810 ISSR 4 1 3 75
UBC 812 ISSR 1 1 0 0
UBC 834 ISSR 2 2 0 0
UBC 873 ISSR 2 0 2 100
Total 39 10 29 74.4
Fig. 2. Electrophoregram of RAPD marker proiles of 24 J. curcas accessions (1 – 24) ampliied using
random primer OPV 17; M = 1 Kb ladder DNA control sizes. Only accession no. 7 (HS49-2) generated unique proiles of DNA fragments while the rest are the same.
Fig. 3. Electrophoregram of RAPD marker proiles of 24 J. curcas accessions (1 – 24) ampliied using
Three outlier accessions are presented in the Fig. 4 and they are HS49-2 – an accession from East Nusa Tenggara, IP-1M-2 – from East Java, and PT14-1 – an accession from Lampung. All other accessions are distributed to form a single population mixture (Fig. 4).
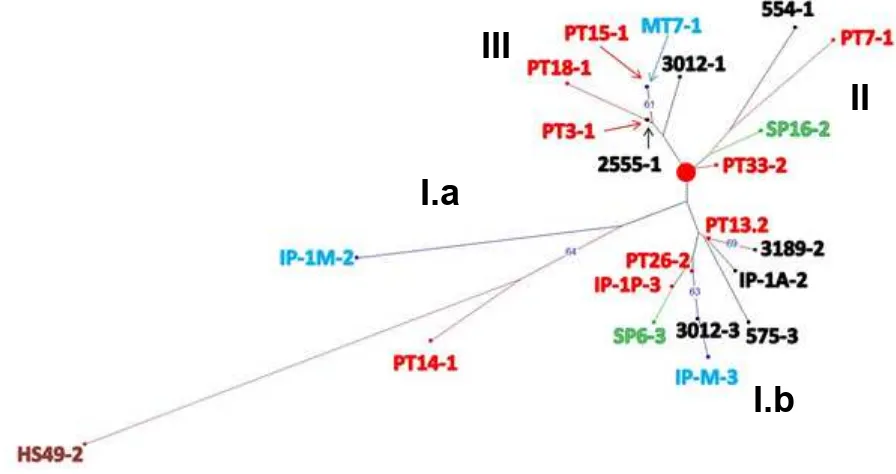
In line with the results obtained using SSR markers, evaluation of the J. curcas accessions originated from various places in Indonesia using RAPD and ISSR markers also showed a low diversity with polymorphisms percentage of only 15.87 %. Based on the constructed weighted Neighbor Joining (NJ) tree using dissimilarity matric, the J. curcas
accessions from various places in Indonesia are grouped into three clusters (cluster I.a and I.b, cluster II, and cluster III, Fig. 5). The cluster I.a consisted of three accessions, such as HS49-2, originated from Ende, East Nusa Tenggara, IP-1M-2, from East Java and PT14-1, from Lampung while cluster I.b consisted of nine accessions, PT 13-2, PT26-2, and IP-IP-3, originated from Lampung, SP6-3 – from South Sulawesi, M-3 – from East Java, and IP-1A-2, 575-3, 3012-3, and 3189-2 – from West Nusa Tenggara (Fig. 5, Table 1). The cluster II consisted
of four accessions, the 554-1 from West Nusa Tenggara; the PT7-1 and PT33-2 from Lampung and SP16-2 from South Sulawesi while the cluster III consisted of six accessions, the 2555-1 and 3012-1 from West Nusa Tenggara, the MT7-1 from East Java, and PT3-1, PT18-1, and PT15-1 from Lampung (Fig. 5, Table 1). However, the clustering of the J. curcas accessions from Indonesia do not follow the geographical patterns, indicating they form a single population with probably a number genetic background.
SCAR Marker Analysis in J. curcas
The SCAR marker ISPJ1 speciically developed to identify the toxic Indian type while ISPJ2 identify the non-toxic Mexican type of J. curcas
(Basha & Sujatha, 2007). These primers were used in this research to identify the type of the evaluated J. curcas accessions from various places in Indonesia. PCR ampliication of all accessions using ISPJ1 primer pairs did not yield any PCR product. On the other hand, PCR ampliication of all accessionsusing ISPJ2 primer pairs yield the expected size of PCR product (Fig. 6), indicates all of the J. curcas
accessions are non-toxic Mexican type descendant. Fig. 4. Principal component analysis for the 24 J. curcas accessions from various locations in Indonesia
Previous researcher proposes the spread of J. curcas from its center of origin in Mexico and South America was possibly brought by Portuguese explorers through Cape Verde Island and Guinea Bissau towards Africa and Asia (Heller, 1996). Zhang, Guo, Liu, Tang, & Chen (2011) and Sun, Li, L. F., Li, Y., Wu, & Ge (2008) hypothesized J. curcas came to China from India as the irst area
visited by Portuguese explorers through Southeast
Asia. Based on these hypotheses, the Indonesian J. curcas is most likely to come from India. However, the results obtained from evaluation of the SCAR markers to J. curcas accessions from various places in Indonesia indicated all of the evaluated accessions belong to the non-toxic Mexican-type. Therefore, the origin of J. curcas in various places in Indonesia is unlikely to come from India.
III
II
I.a
I.b
Fig. 5. Constructed Neighbor Joining tree for the 24 J.curcas accessions from various locations in Indonesia based on the generated RAPD and ISSR marker data. Red dot in the middle of the tree indicates the root position. Colors indicate origins of the progenitors: red is from Lampung, black – from West Nusa Tenggara, blue – from East Java, green – from South Sulawesi, and brown – from East Nusa Tenggara, respectively. Bootstrap analysis was conducted using 10,000 iterations and branching with bootstrap values higher than 60 are indicated in the igure.
The narrow of genetic diversity among J. curcas accessions in Indonesia is likely caused by the limited number of the original introduced materials from the center of origin and to the vegetative propagation nature of the plants, as previously proposed by Basha & Sujatha (2007), Sun, Li, L. F., Li, Y., Wu, & Ge (2008) and Zhang, Guo, Liu, Tang, & Chen (2011). The introduction of
J. curcas to the regions by Portuguese explorers was probably happened about 5 centuries ago (Heller, 1996). Therefore, if the original introduced
J. curcas genotypes are limited, the period between the times this plant was introduced up to now was not long enough to generate genetic diversity from limited genetic background of the initial materials (Zhang, Guo, Liu, Tang, & Chen, 2011). The current indings indicate that there are only limited genetic backgrounds among J. curcas accessions from various places in Indonesia, they are not grouped according to geographical distribution, and they most probably form a single population. Such indings supported previous results about the limited variabilities of the J. curcas accessions in the regions (Sun, Li, L. F., Li, Y., Wu, & Ge, 2008, Zhang, Guo, Liu, Tang, & Chen, 2011).
Although the evaluated populations tend to indicate low genetic diversity, they exhibit phenotype diversity (Table 1). Therefore, the investigation of breeding value of the selected population through heritability studies (Hartati & Sudarsono, 2013), through inbreeding and outbreeding depression measurement (Hartati & Sudarsono, 2014) and combining ability and heterosis determination (Hartati & Sudarsono, 2015) for various vegetative characters and seed yield of J. curcas have previously been conducted. It remains to be seen whether these breeding activities will eventually generate new superior J. curcas varieties or not.
CONCLUSION AND SUGGESTION
Evaluation on 24 J. curcas accessions having diverse phenotypes originated from various places in Indonesia was conducted. The accessions were genetically evaluated using 28 pairs SSR speciic, 22 RAPD, 9 ISSR and 2 SCAR primers. All of the evaluated SSR primers yield monomorphic banding pattern and indicated that they were all genetically homozygous for the respective SSR loci. As many as 8 RAPD and 4 ISSR primers out of the total 31 tested primers produced scoreable markers and some (i.e. UBC 873, OPG 17, OPP 03 and OPQ 11 primers)
were polymorphics. Genetic similarity coeficiens among evaluated accessions ranged from 0.6 to 1.0 with a population mean of 0.9 indicating low diversity and narrow genetic background among accessions in all populations. Therefore, breeding program utilizing such population would only result in low genetic gain. Based on the evaluated SCAR markers, all accessions belonged to the non-toxic Mexican type of physic nut. This information is important inputs for designing future physic nut breeding strategies in Indonesia.
REFERENCES
Ajambang, W., Sudarsono, Asmono, D., & Toruan, N. (2012). Microsatellite markers reveal Cameroon’s wild oil palm population as a possible solution to broaden the genetic base in the Indonesia-Malaysia oil palm breeding programs. African Journal of Biotechnology, 11(69), 13244-13249. http:// doi.org/10.5897/AJB11.3897
Basha, S. D., & Sujatha, M. (2007). Inter and intra-population variability of J. curcas (L.) characterized by RAPD and ISSR markers and development of population-speciic SCAR markers. Euphytica, 156(3), 375– 386. http://doi.org/10.1007/s10681-007-93 87-5
Cai, Y., Sun, D., Wu, G., & Peng, J. (2010). ISSR-based genetic diversity of J. curcas
germplasm in China. Biomass and Bioenergy, 34(12), 1739–1750. http://doi. org/10.1016/j.biombioe.2010.07.001
Hartati, Rr. S., (2008).Variasi tanaman jarak pagar dari satu sumber benih satu genotipe [Variation of physic nut from one seed source one genotype]. InfoTek Jarak Pagar,
3(1), 1.
Hartati, Rr. S., & Sudarsono. (2013). Pewarisan sifat hermaprodit dan kontribusinya terhadap daya hasil pada jarak pagar (J. curcas L.) [Inheritance of hermaphrodite character and its contribution to the yield of physic nut (J. curcas L.)]. Jurnal Penelitian Tanaman Industri, 19(3), 117-129. http:// doi.org/10.21082/littri.v19n3.2013.117%20 -%20129
curcas L.) [Inbreeding depression in selfed and outbreeding depression in crossed progeny arrays of physic nut (J. curcas L.)].
Jurnal Penelitian Tanaman Industri, 20(2), 65-76. http://doi.org/10.21082/littri.v20n2. 2014.65%20-%2076
Hartati, Rr. S., & Sudarsono. (2015). Daya gabung dan heterosis karakter vegetatif, generatif, dan daya hasil jarak pagar (J. curcas L.) menggunakan analisis dialel [Combining ability and heterosis of vegetative, generative, and yield potential characters of physic nut (J. curcas L.) using diallel analysis]. Jurnal Penelitian Tanaman Industri, 21(1), 9-16. http://doi.org/10.21082 /littri.v21n1.2015.9-16
Hartati, Rr. S., Setiawan, A., Heliyanto, B., Pranowo, D., & Sudarsono. (2009). Keragaan morfologi dan hasil 60 individu jarak pagar (J. curcas L.) terpilih di kebun percobaan Pakuwon Sukabumi [Morphological and yield character of 60 selected individuals of J. curcas L. in the experimental ield, Pakuwon Sukabumi]. Jurnal Penelitian Tanaman Industri, 15(4), 152-161. http:// doi.org/10.21082/littri.v15n 4.2009.%25p Heller, J. (1996). Physic nut: J. curcas L. Promoting
the conservation and use of underutilized and neglected crops. 1. Rome, IT: International Plant Genetic Resources Institute.
Kaushik, N., Kumar, K., Kumar, S., Kaushik, N., & Roy, S. (2007). Genetic variability and divergence studies in seed traits and oil content of Jatropha (J. curcas L.) accessions. Biomass and Bioenergy, 31(7), 497-502. http://doi.org/10.1016/j.biombioe. 2007.01.021
Kumar, A., & Sharma, S. (2008). An evaluation of multipurpose oil seed crop for industrial uses (J. curcas L.): A review. Industrial Crops and Products, 28(1), 1–10. http://doi. org/10.1016/j.indcrop.2008.01.001
Kustanto, H., Basuki, N., Sugiharto, A. N., & Kasno, A. (2012). Genetic diversities in the sixth - generation of selection (S6) of some inbred lines of maize based on the phenotypic characters and SSR. AGRIVITA Journal of Agricultural Science, 34(2), 127-135. http://doi.org/10.17503/Agrivita-2012-34-2-p127-135
Makkar, H. P. S., Becker, K., Sporer, F., & Wink, M. (1997). Studies on nutritive potential and toxic constituents of different provenances of J. curcas. Journal of Agricultural and Food Chemistry, 45(8), 3152–3157. http:// doi.org/10.1021/Jf970036j
Montes, L. R., Azurdia, C., Jongschaap, R. E. E., van Loo, E. N., Barillas, E., Visser, R., & Mejia, L. (2008). Global evaluation of genetic variability in J. curcas. Wageningen, NL: Wageningen UR Plant Breeding. Retrieved from https://www.researchgate.net/publica tion/40801683_Global_Evaluation_of_ genetic_variability_in_Jatropha_curcas Nei, M., & Li, W. H. (1979). Mathematical model
for studying genetic variation in terms of restriction endonucleases. Proceedings of the National Academy of Sciences of the United States of America, 76(10), 5269– 5273. Retrieved from https://www.ncbi. nlm.nih.gov/pmc/articles/PMC413122/pdf/ pnas00010-0529.pdf
Ou, W. J., Wang, W. Q., & Li, K. M. (2009). Molecular genetic diversity analysis of 120 accessions of J. curcas L. germplasm. Chinese Journal of Tropical Crops, 30, 284-292.
Pamidimarri, D. V. N. S., Meenakshi, Sarkar, R., Boricha, G., & Reddy, M. P. (2009). A simpliied method for extraction of high quality genomic DNA from J. curcas for genetic diversity and molecular marker studies. Indian Journal of Biotechnology,
8(2), 187–192. Retrieved from http://nopr. niscair.res.in/bitstream/123456789/3881/1/ IJBT 8%282%29 187-192.pdf
Perrier, X., & Jacquemoud-Collet, J. P. (2006). DARwin software. Retrieved from http:// darwin.cirad.fr/
Popluechai, S., Breviario, D., Mulpuri, S., Makkar, H. P. S., Raorane, M., Reddy, A. R., … Kohli, A. (2009). Narrow genetic and apparent phenetic diversity in J. curcas: Initial success with generating low phorbol ester interspeciic hybrids. Nature Precedings, 1–44. Retrieved from http://precedings. nature.com/documents/2782/version/1/ iles/npre20092782-1.pdf
reaction (SPAR) methods. Biomass and Bioenergy, 32(6), 533–540. http://doi.org/10 .1016/j.biombioe.2007.11.006
Rohlf, F. J. (1998). NTSYSpc Numerical taxonomy and multivariate analysis system: version 2.0 user guide. New York, USA: Applied Biostatistics Inc.
Rosado, T. B., Laviola, B. G., Faria, D. A., Pappas, M. R., Bhering, L. L., Quirino, B., & Grattapaglia, D. (2010). Molecular markers reveal limited genetic diversity in a large germplasm collection of the biofuel crop J. curcas L. in Brazil. Crop Science, 50,
2372–2382. http://doi.org/10.2135/cropsci 2010.02.0112
Sambrook, J., Fritsch, E. F., & Maniatis, T. (1989).
Molecular cloning: A laboratory manual. New York, USA: Cold Spring Harbor Laboratory Press.
Saptadi, D., Hartati, R. R. S., Setiawan, A., Heliyanto, B., & Sudarsono. (2011). Pengembangan marka simple sequence repeat untuk Jatropha spp. [Development of simple sequence repeat markers for Jatropha spp.]. Jurnal Penelitian Tanaman Industri, 17(4), 140-149. http://doi.org/10.21082/littri. v17n4.2011.140%20-%20149
Sudarmo, H., Heliyanto, B., Suwarso, & Sudarmadji. (2007). Aksesi potensial jarak pagar (J. curcas L.) [Potential accessions of physic nut (J. curcas L)]. In Jatropha technology status. Paper presented at the National Workshop II, Bogor, 29 November 2006 (pp. 111-114). Bogor, ID: Indonesian Center for Estate Crops Research and Development. Sun, Q. B., Li, L. F., Li, Y., Wu, G. J., & Ge, X. J.
(2008). SSR and AFLP markers reveal low genetic diversity in the biofuel plant J. curcas
in China. Crop Science, 48(5), 1865–1871. http://doi.org/10.2135/cropsci2008.02.0074 Surwenshi, A., Kumar, V., Shanwad, U. K., &
Jalageri, B. R. (2011). Critical review of diversity in J. curcas for crop improvement: A candidate biodiesel crop. Research Journal of Agricultural Sciences, 2(2), 193-198.
Retrieved from https://www.researchgate. n e t / p u b l i c a t i o n / 2 6 6 4 8 9 3 1 5 _ C r i t i c a l _ Review_of_Diversity_in_Jatropha_curcas_ for_Crop_Improvement_A_Candidate_ Biodiesel_Crop
Sutanto, A., Hermanto, C., Sukma, D., & Sudarsono. (2013). Pengembangan marka SNAP berbasis resistance gene analogue pada tanaman pisang (Musa spp.) [Development of SNAP marker based on resistance gene analogue genimic sequences in banana (Musa spp.)]. Jurnal Hortikultura, 23(4), 300-309. http://doi.org/10.21082/jhort.v23n 4.2013.p300-309
Tatikonda, L., Wani, S. P., Kannan, S., Beerelli, N., Sreedevi, T. K., Hoisington, D. A., … Varshney, R. K. (2009). AFLP-based molecular characterization of an elite germplasm collection of J. curcas L., a biofuel plant. Plant Science, 176(4), 505– 513. http://doi.org/10.1016/j.plantsci.2009.0 1.006
Wen, M., Wang, H., Xia, Z., Zou, M., Lu, C., & Wang, W. (2010). Developmenrt of EST-SSR and genomic-SSR markers to assess genetic diversity in J. curcas L. BMC Research Notes, 3, 1–8. http://doi.org/10.1186/1756-0500-3-42
Zhang, Z. Y., Guo, X. L., Liu, B. Y., Tang, L., & Chen, F. (2011). Genetic diversity and genetic relationship of J. curcas between China and Southeast Asian revealed by ampliied fragment length polymorphisms. African Journal of Biotechnology, 10(15), 2825– 2832. http://doi.org/10.5897/AJB10.838 Zulhermana, Sudarsono, Asmono, D., & Yulismawati.
(2010). Intra- and inter-population genetic diversity of oil palm (Elaeis guineensis