Statistik Peternakan dan Kesehatan Hewan 2012
STATISTIK PETERNAKAN DAN KESEHATAN HEWAN 2012
Livestock and Animal Health Statistics 2012
ISBN : 978-979-628-025-4
Ukuran Buku : 21 x 29,7 cm
Jumlah Halaman : 228 Halaman
Penerbit :
Direktorat Jenderal Peternakan dan Kesehatan Hewan
Kementerian Pertanian RI
Dicetak :
i
Statistik Peternakan dan Kesehatan Hewan 2012
KATA PENGANTAR
Sesuai amanat Undang-Undang Nomor 25 Tahun 2004 Tentang Sistem Perencanaan Pembangunan Nasional,
perencanaan merupakan suatu proses untuk menentukan tindakan masa depan yang tepat melalui urutan pilihan,
dengan memperhitungkan sumberdaya yang tersedia. Perencanaan pembangunan didasarkan pada data dan
informasi yang akurat dan dapat dipertanggungjawabkan. Ketersediaan data merupakan komponen penting
dalam proses penyelenggaraan pembangunan, karena akan mendukung dalam pengambilan kebijakan/
keputusan, alat kontrol untuk mencegah terjadinya kesalahan serta mendukung penyelenggaraan pemerintahan
yang transparan, akuntabel dan partisipatif.
Penyusunan Buku Statistik Peternakan dan Kesehaan Hewan Tahun 2012 ini merupakan komitmen Direktorat
Jenderal Peternakan dan Kesehatan Hewan dalam rangka meningkatkan kinerja pembangunan peternakan dan
kesehatan hewan melalui penyajian data dan informasi yang dapat digunakan oleh seluruh pemangku
kepentingan. Dalam buku ini disajikan data terkini terkait dengan pembangunan peternakan dan kesehatan
hewan, mencakup populasi, produksi, pengeluaran dan pemasukan ternak, pemotongan ternak, serta data
lainnya yang terkait dengan pembangunan peternakan.
Ucapan terima kasih disampaikan kepada semua pihak yang telah terlibat dalam penyusunan Buku Statistik
Peternakan dan Kesehaan Hewan Tahun 2012. Kami menyadari, tidak tertutup kemungkinan adanya berbagai
ketidaksempurnaan dalam penyajian. Oleh karena itu kritik dan saran dari semua pihak sangat diharapkan dalam
rangka perbaikan Buku Statistik Peternakan di tahun yang akan datang. Semoga data dan informasi yang tersaji
dalam buku ini dapat memberikan manfaat dan memenuhi harapan para pengguna.
Jakarta, November 2012
DIREKTUR JENDERAL PETERNAKAN DAN
KESEHATAN HEWAN
ii
Statistik Peternakan dan Kesehatan Hewan 2012
PREFACE
As mandated by Law Number 25 of 2004 On National Development Planning System, a planning is a process to
determine future proper actions through a sequence of choices, by taking into account the available resources.
Development planning is based on accurate and accountable data and information. Data availability is an
important component in the development implementation process, because it will support in policy/decision
making, serve as a control tool to prevent errors from occurring and support transparent, accountable and
participative governance.
Compilation of this Statistic Book on Livestock and Animal Health of 2012 is a commitment of the Directorate
General of Livestock and Animal Health Services in order to improve the performance of livestock and animal
health through presentation of data and information that can be used by all stakeholders. This book presents the
latest data relating to livestock and animal health development, including population, production, export and
import of livestock, livestock slaughtering, and other data related to the livestock development.
We grateful thank to all parties for their involvement in compilation of this Statistic Book on Livestock and Animal
Health of 2012. We realize, there certainly be possibilities for many imperfections in presentation. Therefore, we
will appreciate any criticisms and advices from all parties for improvement of the Statistic Book on Livestock in the
years to come. Hopefully the data and information presented in this book may be useful and meeting expectation
of the users.
Jakarta, November 2012
THE DIRECTOR GENERAL OF LIVESTOCK AND
ANIMAL HEALTH SERVICES
iii
Statistik Peternakan dan Kesehatan Hewan 2012
DAFTAR ISI
Table Of Content
Halaman
Page
Kata Pengantar ...
i
Preface
Daftar Isi ...
iii
Table Of Content
Daftar Grafik ...
iv
List Of Graph
Daftar Tabel ...
v
List Of Tables
1.
PRODUK DOMESTIK BRUTO (PDB) ...
3
GROSS DOMESTIC PRODUCT (GDP)
2.
INVESTASI ... 23
INVESMENT
3.
NILAI TUKAR PETANI PETERNAKAN (NTPP) ... 33
ANIMAL HUSBANDRY FARMERS TERMS OF TRADE (NTPP)
4.
EKSPOR—IMPOR ... 47
EXPORT—IMPORT
5.
POPULASI ... 57
POPULATION
6.
PENGELUARAN DAN PEMASUKAN TERNAK ... 79
LIVESTOCK EXPORT AND IMPORT
7.
KONSUMSI ... 109
COMSUPTION
8.
PEMOTONGAN TERNAK TERCATAT ... 117
RECORDED LIVESTOCK SLAUGHTERING
9.
PRODUKSI ... 127
PRODUCTION
10. PARAMETER ... 153
PARAMETERS
11. TENAGA KERJA ... 171
LABORS
12. DAFTAR ALAMAT ... 183
iv
Statistik Peternakan dan Kesehatan Hewan 2012
DAFTAR GRAFIK
List Of Graph
Halaman
Page
GRAFIK
1.1 NILAI PDB (Rp MILYAR) DAN SHARE PDB (%) SEKTOR PERTANIAN
TAHUN 2011** ATAS DASAR HARGA BERLAKU ... 11
GRAFIK
1.2 NILAI PDB (Rp MILYAR) DAN SHARE PDB (%) SEKTOR PERTANIAN
TAHUN 2011** ATAS DASAR HARGA KONSTAN... 11
GRAFIK
1.3 PDB PETERNAKAN ATAS DASAR HARGA BERLAKU DAN
HARGA KONSTAN TAHUN 2007-2011** ( MILYAR RP) ... 11
GRAFIK
2.1 NILAI INVESTASI PMDN PETERNAKAN 2007-2011 (Rp Juta) ... 25
GRAFIK
2.2 NILAI INVESTASI PMA PETERNAKAN 2007-2011 (US$ ribu) ... 25
GRAFIK
3.1 INDEKS HARGA YANG DITERIMA PETANI (IT), INDEKS HARGA YANG
DIBAYAR PETANI (IB), DAN NILAI TUKAR PETANI PETERNAKAN (NTPT)
TAHUN 2009-2011 (2007=100) ... 37
GRAFIK
4.1 NILAI EKSPOR DAN IMPOR SUB SEKTOR PETERNAKAN TAHUN 2009-2011 ... 49
GRAFIK
4.2 NILAI EKSPOR SUB SEKTOR PETERNAKAN TAHUN 2011 (%) ... 49
GRAFIK
4.3 NILAI IMPOR SUB SEKTOR PETERNAKAN TAHUN 2011 (%) ... 49
GRAFIK
5.1 POPULASI TERNAK RUMINANSIA (000 EKOR) ... 59
GRAFIK
5.2 POPULASI TERNAK NON RUMINANSIA (000 EKOR
)... 59
GRAFIK
5.3 POPULASI TERNAK UNGGAS (000 EKOR) ... 59
GRAFIK
9.1 PRODUKSI DAGING (000 TON) ... 129
xi
Statistik Peternakan dan Kesehatan Hewan 2012
12.3
DAFTAR ALAMAT KEPALA PUSAT DAN KEPALA BALAI UNIT PELAYANAN TEKNIS
(UPT) LINGKUP DIREKTORAT JENDERAL PETERNAKAN DAN KESEHATAN HEWAN ... 187
ADDRESSES OF OFFICIAL CENTRES IN DIRECTORATE GENERAL OF LIVESTOCK
AND ANIMAL HEALTH SERVICES
12.4
ALAMAT DINAS PETERNAKAN/YANG MELAKSANAKAN FUNGSI PEMBANGUNAN
PETERNAKAN DAN KESEHATAN HEWAN KABUPATEN/KOTA ... 190
ADDRESS OF OFFICE DISTRIC LIVESTOCK AND ANIMAL HEALATH SERVICES
12.5
ALAMAT FAKULTAS KEDOKTERAN HEWAN DI INDONESIA ... 202
ADDRESSES OF VETERINARY MEDICINE FACULTY IN INDONESIA
12.6
ALAMAT FAKULTAS PETERNAKAN DI INDONESIA ... 203
ADDRESSES OF FACULTY OF ANIMAL HUSBANDRY IN INDONESIA
12.7
ALAMAT ASOSIASI BIDANG PETERNAKAN ... 208
1
PRODUK DOMESTIK BRUTO (PDB)
3
Produk domestik bruto per kapita atas harga konstan terjadi peningkatan pada tahun 2009 dibandingkan dengan
memberikan kontribusi terbesar adalah provinsi DKI Jakarta yaitu sekitar 17,9 persen sedangkan provinsi yang
terendah yaitu Maluku Utara yaitu sebesar 0,09 persen. Distribusi PDRB tahun 2008 (Angka Tetap) atas dasar
adalah Sulawesi Barat yaitu sebesar 12,1 persen sedangkan provinsi yang minus laju pertumbuhannya hanya
pada Provinsi Papua yaitu -1,4 persen.
PDRB Perkapita
Peternakan, Kehutanan dan Perikanan bila dibandingkan dengan sektor lain memberi peran sebesar 15,31%
(tahun 2010*) dan menurun menjadi 14,72% (tahun 2011**).
6
Statistik Peternakan dan Kesehatan Hewan 2012
Tabama (Tanaman Bahan Makanan) berkisar 49 persen; Perikanan berkisar 19-21 persen; Tanaman
Perkebunan berkisar 13-15 persen; Peternakan dan Hasil-hasilnya berkisar 12 persen dan Kehutanan berkisar
5-6 persen.
PDRB PETERNAKAN
PDRB Sub sektor peternakan tahun 2008 (Angka Tetap) atas dasar harga berlaku di 33 Provinsi Seluruh
Indonesia yang mempunyai PDRB terbesar adalah provinsi Jawa Timur yaitu sebesar Rp.19,1 Triliun dari jumlah
total di 33 Propinsi sebesar Rp 75,0 Triliun. Peranan PDRB sub sektor peternakan Provinsi Jawa Timur terhadap
PDRB sub sektor peternakan di 33 Provinsi memberikan kontribusi yang cukup besar yaitu mencapai
25,45 persen. Provinsi yang mempunyai PDRB sub sektor peternakan terendah adalah Provinsi DKI Jakarta
yaitu sebesar Rp.0,04 Triliun. Peranan PDRB sub sektor peternakan Provinsi DKI Jakarta terhadap PDRB sub
sektor peternakan di 33 Provinsi memberikan kontribusi yang cukup rendah, sebesar 0,06 persen.
PDRB Sub sektor peternakan tahun 2008 (Angka Tetap) atas dasar harga konstan di 33 Provinsi Seluruh
Indonesia yang mempunyai PDRB terbesar adalah Provinsi Jawa Timur yaitu sebesar Rp. 8,0 triliun dari jumlah
total di 33 provinsi sebesar Rp. 35,7 triliun. Disamping itu juga peranan PDRB sub sektor peternakan Provinsi
Jawa Timur terhadap PDRB sub sektor peternakan di 33 Provinsi memberikan kontribusi yang cukup besar yaitu
mencapai 22,49 persen. Provinsi yang mempunyai PDRB sub sektor peternakan terendah adalah Provinsi DKI
Jakarta yaitu sebesar Rp.0,02 Triliun. Peranan PDRB sub sektor peternakan Provinsi DKI Jakarta terhadap
PDRB sub sektor peternakan di 33 Provinsi memberikan kontribusi yang cukup rendah 0,06 persen.
PENJELASAN TEKNIS
1.
Data PDB dan PDRB diperoleh dari Badan Pusat Statistik.
2.
Perhitungan statistik neraca nasional yang digunakan mengikuti buku petunjuk yang diterbitkan oleh
Perserikatan Bangsa Bangsa dikenal dengan ”Sistem Neraca Nasional”.
3.
Produk Domestik Bruto (PDB) pada tingkat nasional serta Produk Domestik Regional Bruto (PDRB) pada
tingkat regional (provinsi) yang menggambarkan kemampuan suatu wilayah untuk menciptakan output (nilai
tambah) pada waktu tertentu.
4.
PDB disajikan dalam dua versi penilaian, yaitu atas dasar ”harga berlaku” dan atas dasar ”harga konstan”.
Disebut sebagai harga berlaku karena seluruh agregat dinilai dengan menggunakan harga pada tahun
berjalan. Sedangkan harga konstan penilaiannya berdasarkan pada harga suatu tahun dasar tertentu.
5.
Pendapatan nasional merupakan produk nasional neto atas dasar biaya faktor produksi.
6.
Pendapatan nasional per kapita adalah pendapatan nasional dibagi dengan jumlah penduduk pertengahan
tahun.
10
Statistik Peternakan dan Kesehatan Hewan 2012
TECHNICAL EXPLANATION
1.
GDP and GRDP data have been obtained from the Central Bureau of Statistics.
2.
The calculation of national account statistic was used to follow the manual issued by the United Nations,
known as the "System of National Accounts".
3.
Gross Domestic Product (GDP) at the national level and Gross Regional Domestic Product (GRDP) at the
regional (provincial) level, that depict the ability of a region to create output (value added) at any given time.
4.
GDP is presented in two assessment versions, namely, one is based on "current prices" and the other one is
based on "constant prices". It is called as current price because all of the aggregates are assessed by using
the prices in current year. Whereas, the assessment of constant prices is based on price of a certain base
year.
5.
National income is a net national product based on the production factor cost.
6.
National income per capita is national income divided by total population in mid-year.
11
Statistik Peternakan dan Kesehatan Hewan 2012
GRAFIK 1.1
NILAI PDB (Rp MILYAR) DAN SHARE PDB (%) SEKTOR PERTANIAN TAHUN 2011** ATAS DASAR
HARGA BERLAKU
GRAFIK 1.2
NILAI PDB (Rp MILYAR) DAN SHARE PDB (%) SEKTOR PERTANIAN TAHUN 2011** ATAS DASAR
HARGA KONSTAN
GRAFIK 1.3
2
INVESTASI
23
Statistik Peternakan dan Kesehatan Hewan 2012
INVESTASI
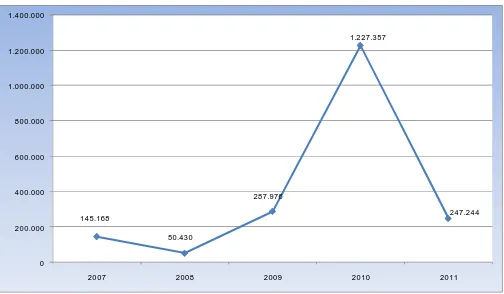
Realisasi investasi PMDN (Penanaman Modal Dalam Negeri) Tahun 2010 sebanyak 872 proyek dengan nilai
investasi sebesar Rp 60,63 trilyun (Tabel 2.1). Tahun 2011 jumlah proyek investasi PMDN meningkat menjadi
Realisasi investasi PMA (Penanaman Modal Asing) Tahun 2010 sebanyak 3.076 proyek dengan nilai investasi
sebesar US$ 16,21 milyar (Tabel 2.2). Tahun 2011 jumlah proyek investasi PMDN meningkat menjadi 3.743
25
Statistik Peternakan dan Kesehatan Hewan 2012
145.168
50.430
287.976
1.227.357
247.244
0 200.000 400.000 600.000 800.000 1.000.000 1.200.000 1.400.000
2007 2008 2009 2010 2011
45685,1
4541,7
2533,6
25026,7
21135,6
0 5000 10000 15000 20000 25000 30000 35000 40000 45000 50000
2007 2008 2009 2010 2011
GRAFIK 2.1
NILAI INVESTASI PMDN PETERNAKAN 2007-2011 (Rp Juta)
GRAFIK 2.2
2
Jika pada realisasi 2007-2009 terdapat data proyek 0, berarti proyek memiliki beberapa bidang usaha. Untuk menghindari perhitungan ganda, nilai proyek digabung pada bidang usaha atau lokasi dengan nilai investasi terbesar. Pada realisasi 2010-2012, terdapat realisasi proyek, namun tanpa nilai investasi, disebabkan karena proyek yang melaporkan ke BKPM tidak memiliki tambahan investasi
2
Jika pada realisasi 2007-2009 terdapat data proyek 0, berarti proyek memiliki beberapa bidang usaha. Untuk menghindari perhitungan ganda, nilai proyek digabung pada bidang usaha atau lokasi dengan nilai investasi terbesar.
2
2
Pada realisasi 2007-2009 terdapat data proyek 0, berarti proyek memiliki beberapa bidang usaha. Untuk menghindari perhitungan ganda, nilai proyek digabung pada bidang usaha atau lokasi dengan nilai investasi terbesar.
3
NILAI TUKAR PETANI PETERNAKAN
(NTPP)
NILAI TUKAR PETANI PETERNAKAN (NTPP)
34
Statistik Peternakan dan Kesehatan Hewan 2012
3.
Dari Indeks Harga Yang Diterima Petani (IT), dapat dilihat fluktuasi harga barang-barang yang dihasilkan
petani. Indeks ini digunakan juga sebagai data penunjang dalam penghitungan pendapatan sektor
pertanian.
4.
Dari Indeks Harga Yang Dibayar Petani (IB), dapat dilihat fluktuasi harga barang-barang yang dikonsumsi
oleh petani yang merupakan bagian terbesar dari masyarakat di pedesaan, serta fluktuasi harga barang
yang diperlukan untuk memproduksi hasil pertanian. Perkembangan Ib juga dapat menggambarkan
perkembangan inflasi di pedesaan.
36
Statistik Peternakan dan Kesehatan Hewan 2012
4.
From the Index of Prices Paid by Farmers (IB), the fluctuation of prices of goods consumed by the farmers,
who are the largest part of the rural communities, and the fluctuation of prices of goods required to produce
the agricultural products can be seen. The Ib developments can also depict the development of inflation in
the rural.
124,1975
129,6108333 131,5975
118,5091667 124,5108333
130,0158333
104,7908333
104,1
101,2166667
0 20 40 60 80 100 120 140
2009 2010 2011
INDEKS HARGA YANG DITERIM A PETANI (IT) INDEKS HARGA YANG DIBAYAR PETANI (IB)
NILAI TUKAR PETANI PETERNAKAN (NTPT)
GRAFIK 3.1
INDEKS HARGA YANG DITERIMA PETANI (IT), INDEKS HARGA YANG DIBAYAR PETANI (IB), DAN NILAI
TUKAR PETANI PETERNAKAN (NTPT) TAHUN 2009-2011 (2007=100)
3
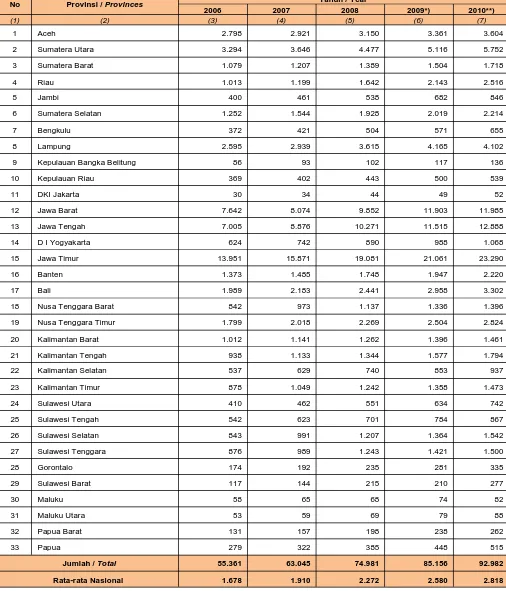
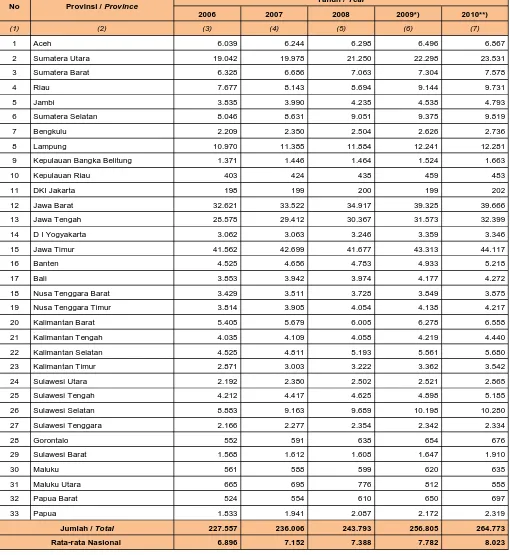
Provinsi Januari Februari Maret April Mei Juni Juli Agustus September Oktober November Desember Rata-Rata
4
INDEKS HARGA YANG DITERIMA PETANI (IT), INDEKS HARGA YANG DIBAYAR PETANI (IB), DAN NILAI TUKAR PETANI PETERNAKAN (NTPT ) MENURUT PROVINSI TAHUN 2010 (2007=100)
4
INDEKS HARGA YANG DITERIMA PETANI (IT), INDEKS HARGA YANG DIBAYAR PETANI (IB), DAN NILAI TUKAR PETANI PETERNAKAN (NTPT ) MENURUT PROVINSI TAHUN 2011 (2007=100)
4
EKSPOR - IMPOR
47
Statistik Peternakan dan Kesehatan Hewan 2012
EKSPOR - IMPOR
Pada tahun 2011 nilai ekspor produk peternakan sebesar US$ 1.599,07 juta (Tabel 4.2), atau mengalami
kenaikan sebesar 68,03% dibandingkan ekspor tahun 2010 yang bernilai US$ 951,66 juta (Tabel 4.1).
Peningkatan tersebut sebagian besar berasal dari ekspor hasil ternak dengan kontribusi sebesar US$ 1,16 milyar
atau sekitar 72,62% dari total ekspor peternakan Indonesia tahun 2011. Jenis ekspor lainnya yang memberikan
kontribusi terbesar adalah produk hewani non pangan (bulu dan kulit) yang memberikan kontribusi sebesar US$
143,71 juta (8,99%).
Dari sisi volume, ekspor peternakan tahun 2011 sebanyak 906.997 ton, atau mengalami peningkatan sebesar
83,53% dari volume ekspor tahun 2010 yang sebesar 494.186 ton. Peningkatan tersebut diantaranya disebabkan
peningkatan ekspor hasil ternak sebesar 90,59% dari 449.689 ton pada tahun 2010 menjadi 857.076 ton pada
tahun 2011.
Pada tahun 2011 nilai impor produk peternakan senilai US$ 3.044,80 juta (Tabel 4.2) atau mengalami kenaikan
sebesar 9,99% dibandingkan impor tahun 2010 yang bernilai US$ 2.768,34 juta (Tabel 4.1).
Peningkatan tersebut sebagian besar berasal dari impor hasil ternak yang meningkat sebesar 10,83% dari US$
1.723,33 juta pada tahun 2010 menjadi US$1.909.96 juta pada tahun 2011. Jenis impor lainnya yang mengalami
peningkatan yang cukup besar adalah produk hewani non pangan yang mengalami peningkatan sebesar 36,08%
dari US$ 436,46 juta pada tahun 2010 menjadi US$ 593,93 juta pada tahun 2011.
Dari sisi volume, impor peternakan pada tahun 2011 sebanyak 1,19 juta ton, atau mengalami penurunan sebesar
3,32% dibanding volume impor tahun 2010 sebesar 1,23 juta ton. Penurunan ini diantaranya disebabkan
penurunan impor ternak sebesar 41,87% dari 210.682 ton menjadi 122.462 ton, dan penurunan impor obat
hewan sebesar 57,89% dari 4.382 ton pada tahun 2010 menjadi 1.845 ton pada tahun 2011.
Neraca ekspor–impor peternakan pada tahun 2010-2011 masih mengalami defisit (nilai impor lebih besar
daripada nilai ekspor). Namun demikian defisit neraca ekspor–impor peternakan dalam kurun waktu 2010-2011
mengalami penurunan sebesar 20,42% dari defisit sebesar US$ 1.816,68 juta US$ pada tahun 2010 menjadi
defisit sebesar US$ 1.445,73 juta. Jika pada tahun 2010 rasio ekspor terhadap impor senilai 1 : 2,91, maka pada
tahun 2011 rasionya menurun menjadi 1: 1,90.
PENJELASAN TEKNIS
1.
Data ekspor – impor diperoleh dari hasil pengolahan data ekspor – impor yang dikeluarkan oleh Badan Pusat
Statistik (BPS).
48
Statistik Peternakan dan Kesehatan Hewan 2012
EXPORT – IMPORT
In 2011, export value of livestock products was US$ 1,599.07 million (Table 4.2), or increasing by 68.03%
compared to the 2010 export value that was US$ 951.66 million (Table 4.1). Such an increase mostly derived
from the export of livestock products contributing US$ 1.16 billion, or about 72.62% of the total Indonesian
livestock exports in 2011. Another type of export that gave the largest contribution was non-food animal products
(furs and leathers) which contributed US$ 143.71 million (8.99%).
In term of volume, the livestock export in 2011 was 906,997 tons, or increasing by 83.53% from the export volume
in 2010 that was 494,186 tons. Such an increase was partly due to an increase in the livestock product export by
90.59% from 449,689 tons in 2010 to 857,076 tons in 2011.
In 2011 the value of livestock product imports was US$ 3,044.80 million (Table 4.2) or increasing by 9.99%
compared to the 2010 imports value amounting to US$ 2,768.34 million (Table 4.1).
Such an increase was mainly derived from import of livestock products increased which increased by 10.83%
from US$ 1,723.33 million in 2010 to US$ 1,909.96 million in 2011. Another type of imports that experienced a
significant increase was non-food animal products that increased by 36.08% from US$ 436.46 million in 2010 to
US$ 593.93 million in 2011.
In term of volume, the livestock export in 2011 was 1.19 million tons, or decreasing by 3.32% compared to the
import volume in 2010 that was 1.23 million tons. Such an decrease was partly due to an decrease of livestock
imports by 41,87% from 210,682 tons to 122,462 tons, and decrease in veterinarian medicine import by 57.89%
from 4,382 tons in 2010 to 1,845 tons in 2011.
The Balance sheet of livestock exports and imports in 2010-2011 were still deficit (import value is greater than
export value). However, the import-export livestock deficit in the period 2010-2011 has decreased by 20.42% from
a deficit amounting to US$ 1,816.68 million US$ in 2010 to a deficit amounting to US$ 1,445.73 million. If, in 2010,
the export to import ratio was 1: 2.91, then in 2011 its ratio decreased to 1: 1.90.
TECHNICAL EXPLANATION
1.
The export - import data were obtained from the processing of import - export data issued by the Central
Bureau of Statistics (BPS).
49
Statistik Peternakan dan Kesehatan Hewan 2012
4%
73% 9%
1% 13%
TERNAK HASIL TERNAK
PRODUK HEW ANI NON PANGAN OBAT HEW AN
LAIN - LAIN
11%
63% 20%
2% 5%
TERNAK HASIL TERNAK
PRODUK HEW ANI NON PANGAN OBAT HEW AN LAIN - LAIN
0 500.000.000 1.000.000.000 1.500.000.000 2.000.000.000 2.500.000.000 3.000.000.000 3.500.000.000
2009 2010 2011
EKSPOR IM POR
GRAFIK 4.1
NILAI EKSPOR DAN IMPOR SUB SEKTOR PETERNAKAN TAHUN 2009-2011
GRAFIK 4.2
NILAI EKSPOR SUB SEKTOR PETERNAKAN TAHUN 2011 (%)
GRAFIK 4.3
53
Statistik Peternakan dan Kesehatan Hewan 2012
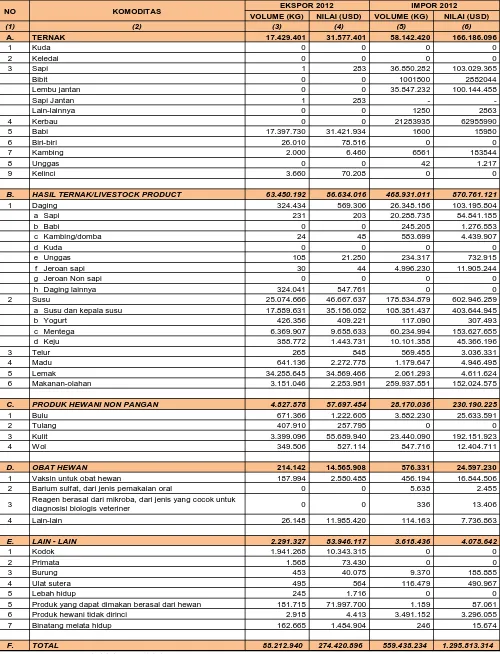
Tabel
4.4
Table
NERACA EKSPOR DAN IMPOR SUB SEKTOR PETERNAKAN TAHUN 2010-2012
BALANCE OF EXPORT AND IMPORT OF LIVESTOCK SUB SECTOR YEAR 2010-2012
dalam US$
NO KOMODITI
TAHUN
2010 2011 2012*)
(1) (2) (3) (4) (5)
1. EKSPOR 951.661.900 1.599.071.072 274.420.896
A TERNAK 50.554.481 61.818.585 31.577.401
B HASIL TERNAK 585.117.577 1.161.287.963 86.634.016
C PRODUK HEWANI NON PANGAN 129.496.149 143.708.725 57.697.454
D OBAT HEWAN 5.346.775 22.446.611 14.565.908
E LAIN - LAIN 181.146.918 209.809.188 83.946.117
2. IMPOR 2.768.339.096 3.044.800.932 1.295.813.314
A TERNAK 450.478.663 328.509.198 166.186.096
B HASIL TERNAK 1.723.325.607 1.909.965.938 870.761.121
C PRODUK HEWANI NON PANGAN 436.459.152 593.927.458 230.190.225
D OBAT HEWAN 46.465.313 47.744.727 24.597.230
E LAIN - LAIN 111.610.361 164.653.611 4.078.642
3. TOTAL (EKSPOR - IMPOR) (1.816.677.196) (1.445.729.860) (1.021.392.418)
Sumber/ Source : Badan Pusat Statistik / BPS-Statistic Indonesia
Keterangan/ Note : *) Angka sementara/ Preliminary figures
5
POPULASI
57
Statistik Peternakan dan Kesehatan Hewan 2012
POPULASI
Berdasarkan jenisnya ternak dikelompokkan menjadi ternak besar (sapi potong, sapi perah, kerbau, kuda), ternak
kecil (kambing, domba, babi), ternak unggas (ayam buras, ayam ras petelur, ayam ras pedaging, itik) dan aneka
ternak (kelinci, burung puyuh, merpati). Berdasarkan data yang diperoleh dari 33 Provinsi, dapat dilihat bahwa
sebaran populasi ternak sebagian besar terkonsentrasi di pulau Jawa. Untuk ternak sapi potong, sapi perah, dan
ayam ras petelur populasi terbanyak berada di Provinsi Jawa Timur. Sementara untuk ternak domba, ayam ras
pedaging dan itik populasi terbanyak berada di Provinsi Jawa Barat. Sedangkan ternak kambing, ayam buras,
kelinci, burung puyuh dan merpati populasi terbanyak berada di Provinsi Jawa tengah. Untuk ternak kerbau dan
babi populasi terbanyak di Provinsi Nusa Tenggara Timur dan ternak kuda populasi terbanyak berada di Provinsi
Sulawesi Selatan.
Pada tahun 2011 secara nasional populasi ternak besar mengalami variasi peningkatan dan penurunan jumlah
populasi bila dibandingkan dengan populasi pada tahun 2010 dengan rincian sebagai berikut : sapi potong 14,82
juta ekor (peningkatan 3,77%), sapi perah 0,59 juta ekor (peningkatan 22,27%), kerbau 1,31 juta ekor (penurunan
34,73%) dan kuda 0.41 juta ekor (penurunan 2,38%). Sedangkan untuk populasi ternak kecil secara nasional
pada tahun 2011 mengalami peningkatan bila dibandingkan dengan populasi pada tahun 2010 yaitu: kambing
16,95 juta ekor (peningkatan 1,97%), domba 11,79 juta ekor (peningkatan 9,93%), babi 7,52 juta ekor
(peningkatan 0,64%).
Sama halnya dengan jumlah populasi pada ternak besar, ternak unggas secara nasional pada tahun 2011
mengalami variasi peningkatan dan penurunan jumlah populasi bila dibandingkan dengan populasi pada tahun
2010 yaitu: ayam buras 264,34 juta ekor (peningkatan 2,64% ), ayam ras petelur 124,64 juta ekor (peningkatan
18,46%), ayam ras pedaging 1.117,85 juta ekor (peningkatan 19,35%) dan itik 43,49 juta ekor (penurunan
1,84%). Sedangkan untuk populasi aneka ternak pada tahun 2011 secara umum juga mengalami peningkatan
dan penurunan jumlah populasi apabila dibandingkan dengan populasi pada tahun 2011 yaitu: kelinci 0,76 juta
ekor (penurunan 8,82%), burung puyuh 7,36 juta ekor (peningkatan 4,30%) dan merpati 1,21 juta ekor
(peningkatan 146,67%).
PENJELASAN TEKNIS
1.
Populasi ternak adalah kumpulan atau jumlah ternak yang hidup pada wilayah dan waktu tertentu.
58
Statistik Peternakan dan Kesehatan Hewan 2012
POPULATION
Based on its types, livestock are grouped into large livestock (beef cows, dairy cows, buffalos, horses), small
livestock (goats, sheep, pigs), poultries (free-range chickens, laying hens, broilers, ducks) and various livestock
(rabbits, quails, pigeons). Based on data that were obtained from 33 Provinces, it can be seen that distribution of
livestock population is mostly concentrated in Java. For beef cows, dairy cows, laying hens and broilers, the
largest population is in East Java province. Whilst for sheep, broilers and ducks, the highest populations is in
West Java province. Whereas, the goats, chicken, rabbits, quails and pigeons, the largest population is in Central
Java province. For buffaloes and pigs, the largest population is in East Nusa Tenggara province and the largest
population of horses is in South Sulawesi province.
In 2011, nationally, population of large livestock experienced a variation of increase and decrease in total
population if compared to the population in 2010, with the following break-down: beef cows 14.82 million
(increasing 3.77%), dairy cows 0.59 million (increasing 22.27%), buffalos 1.31 million (decreasing 34.73%) and
horses 0.41 million (decreasing 2.38%). Whereas, for national population of small livestock in 2011 has increased
compared to the population in 2010, namely: goats 16.95 million (increasing 1.97%), 11.79 million head of sheep
(increasing 9.93%), pigs 7.52 million (increasing 0.64%).
Similar to total population in large livestock, the poultry livestock nationally in 2011 experienced a variation of
increase and decrease in total population if compared to the population in 2010, namely: free-range chickens
264.34 million (increasing by 2.64%), laying chickens 124.64 million (increasing by 18.46%), broilers 1,117.85
million (increasing by 19.35%) and ducks 43.49 million (decreasing by 1.84%). As for population of various
livestock in 2011 in general also experienced increase and decrease in total population if compared to population
in 2011, namely: rabbits 0.76 million (decreasing by 8.82%), quails 7.36 million (increasing by 4.30%) and pigeons
1.21 million (increasing by 146.67%).
TECHNICAL EXPLANATION
1.
The livestock population is a collection or number of livestock living in a certain area and time.
59
Statistik Peternakan dan Kesehatan Hewan 2012
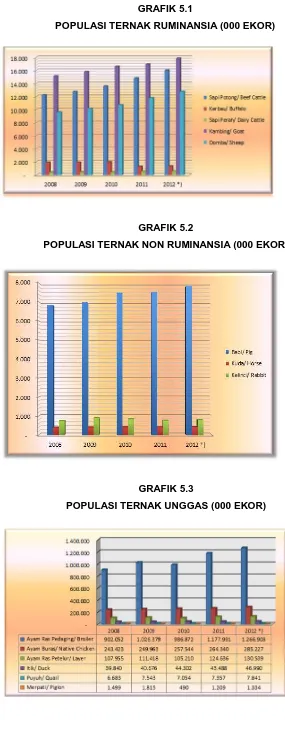
GRAFIK 5.1
POPULASI TERNAK RUMINANSIA (000 EKOR)
GRAFIK 5.2
POPULASI TERNAK NON RUMINANSIA (000 EKOR
)GRAFIK 5.3
63
Statistik Peternakan dan Kesehatan Hewan 2012
Tabel
5.4
Table
POPULASI TERNAK TAHUN 2008 - 2012 (INDONESIA)
LIVESTOCK POPULATION 2008 - 2012 (INDONESIA)
(000 ekor/ head)
No Jenis / Species Tahun / Year
2008 2009 2010 2011 2012 *)
(1) (2) (3) (4) (5) (6) (7)
I RUMINANSIA/ RUMINANT
1 Sapi Potong/ Beef Cattle 12.257 12.760 13.582 14.824 16.034 2 Sapi Perah/ Dairy Cattle 458 475 488 597 622 3 Kerbau/ Buffalo 1.931 1.933 2.000 1.305 1.378 4 Kambing/ Goat 15.147 15.815 16.620 16.946 17.862 5 Domba/ Sheep 9.605 10.199 10.725 11.791 12.768
II NON RUMINANSIA/ NON RUMINANT
1 Babi/ Pig 6.838 6.975 7.477 7.525 7.831 2 Kuda/ Horse 393 399 419 409 422 3 Kelinci/ Rabbit 748 887 834 760 794
III
1 Ayam Buras/ Native Chicken 243.423 249.963 257.544 264.340 285.227 2 Ayam Ras Petelur/ Layer 107.955 111.418 105.210 124.636 130.539 3 Ayam Ras Pedaging/ Broiler 902.052 1.026.379 986.872 1.177.991 1.266.903 4 Itik/ Duck 39.840 40.676 44.302 43.488 46.990 5 Puyuh/ Quail 6.683 7.543 7.054 7.357 7.841 6 Merpati/ Pigeon 1.499 1.815 490 1.209 1.334
Keterangan/ Note : *) Angka sementara / Preliminary figures