199
Can Payment for Environmental Services Promote Socioeconomic
Development in Indonesia? An Empirical Analysis
Danang Desta Yudha
Faculty of Economic and Business, University of Indonesia, Indonesia Email: [email protected]
Abstract
In this research paper, I attempt to investigate the impact of Payment for Environmental Services (PES) on the socioeconomic status of local livelihood. The socioeconomic status that I examine is total household expenditure to capture the nutritional well-being of people who live in an area where the PES project is implemented. Not only total household spending, but I also examine the poverty status of each household in the area of PES project. The area of PES project that I analyze are villages in the vicinity of Meru Betiri National Park, East Java and Segara Basin, Lombok. I use Indonesian Social Economy National Surveys (SUSENAS) by Central Bureau of Statistics Republic of Indonesia (BPS), before and following the implementation of two PES implementation projects to examine the effect of PES in each location and both locations combined. To discuss the impact of PES, I use Difference-in-Difference method and also incorporate Propensity Score Matching to have a better result. I find that statistically, PES project has little significant impact on the socioeconomic status of local livelihood. However, if I look at the magnitude of the coefficient of the effect, the evidence show that PES has affected local livelihood positively. Furthermore, the effect of PES project differs between each location.
Keywords: Environmental Services, Socioeconomics, Propensity Score Matching
INTRODUCTION
Sustainable development has become the major discourse in the development area. Since 1992, in the Rio de Janeiro, the sustainable development emerged as to draw up the attention of international community. The actions and strategies formed in an attempt to start the development towards the more sustainable pattern. Within which, countries and organization which presented civil society investigate the key works of development that bring harm to environment. The notion of harming the environment bring about the development unsustain if it is left unchecked. Sustainable development itself has been known to the international community in 1972 at UN conference in Stockholm. The notion of sustainable development in its early announcement referred that development and environment is two separate issues which can be mutually coexist.
200
describes PES as a voluntary transaction between ES providers and ES buyers on the well-defined ES. In which, ES providers have to secure ES provision. PES formed a valuation of opportunity benefit of natural resources-based incentive (Arriagada 2008, Fisher and Turner 2008). By giving these incentives, it is hoped that the community will be more motivated in keeping forest cover intact, and the less inclined of other change of land uses.
There are four environmental services (ES) that are currently stand out: carbon sequestration and storage, and landscape beauty, watershed protection, biodiversity protection, (Wunder 2005). For instance, watershed protection ES is a payment from downstream water users to the upstream farmer to adopt land uses that limit soil erosion, deforestation, and flooding risk. Secondly, biodiversity protection ES is payment for local people to maintain or restoring areas to create a biological corridor. Thirdly, carbon sequestration and storage ES is payment to farmers that reside near a forest from donor(s) to maintain forest cover or plant new trees. Lastly, landscape beauty ES is payment for the local community for not to hunt and preserve the forest to be used as a tourist attraction.
The program is mainly concerned with local communities within the natural ecosystem – with its nature in which compensating communities that highly dependent on natural resources. Since the community highly depends on the natural resources to obtain income, PES would have to make out conservation that financially viable for the community to maintain their earnings. Thus, the compensation that is provided by the program has to be able to elevate the standard of living of its recipients while improving environmental quality.
It is challenging to pursue an objective that is meeting two goals at the same time in PES program – improving environmental quality and livelihood of people. The effect could be negative or positive to the social and economic outcomes (Zilberman et al. 2006). For instance, we can assume that PES will bring to the improvement of livelihood of the participants if the participants of this program are those below the poverty line and the compensation is large. However, if the benefits are small and received by those who are not poor, we can expect that the improvement of livelihood would be insignificant. Therefore, if the settlement is large but it highly restricts the change of land for agricultural activities, it will lead to the increase in poverty (Robalino 2007).
However, according to many researchers, PES can potentially address poverty issues as a conditional cash transfer, reducing or eliminating the tradeoff. The program may increase the income of the recipient, and it also may contribute to the reduction of poverty of local poor people because the program transfers money to residents (Landell-Mills and Porras 2002, Engel et al. 2008, Pagiola et al. 2005, Ferraro and Simpson 2002, Persson and Alpizar 2011).
The dilemma between the two objectives of PES has to be the primary consideration of government and agencies who is participating in PES project. The most common underlying problem are the restriction of land uses in the location where PES project implemented. The limitation of land uses can reduce income for the local community. Therefore, another problem will occur when the amount compensation is less than the revenue that local people compensated.
201
socioeconomic outcome of PES project using national household survey. Pfaff and Robalino (2012) argued that the national household survey data can be used to control for individual and locality characteristics that affect the impact of the program.
My study has several limitations. A major weak point of this paper is data availability because this paper relies on secondary data. This problematic since the targeted scope of this study is looking at household’s activities at household level in PES projects in Indonesia. Thus, the required data should be at the household level and cover many categories of household’s socioeconomics development that are related to the PES program, and it tends to have missing data. Moreover, using the difference in difference methods has its limitation which is I have to find an area which has a baseline data and its follow-up. After countering such problem, I finally try to exercise the data from two PES projects which is watershed protection program in Lombok, West Nusa Tenggara and forest protection program in Meru Betiri, East Java.
LITERATURE REVIEW
Natural resources provide plethora benefit for a human being. For instance, Forest is essential to life on Earth. It produces oxygen, and also it can be sequestrated carbon that can reduce the greenhouse effect. In addition to that, the forest also retains rainfall, filtering water and releasing it gradually. However, this hydrological services may not be noticed until deforestation takes a negative effect on human livelihoods, greatly, such as flood and degradation of water quality.
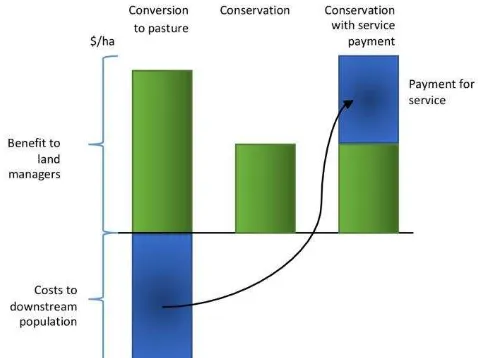
In regards to that problem and the failure of the past approaches, society has considered the more effective and low cost by paying land users for their environmental services which give incentive to land users who lives near the natural resources. It has led to the development of Payment for Environmental Services (PES). It is an approach where the environmental services should be compensated (Pagiola and Platais 2016). The simple diagram of logical in PES can be seen in figure 1. The main idea of PES is that those who provide environmental services should be compensated, and those who receive the benefit should pay for the provision.
202
By linking the ES program to sustainable development, the majority of researchers argued that there are strong links between ES and sustainable development, particularly development efforts that aim to reduce rural poverty (Kaimowitz and Sheils 2007, Karaeva and Marvier 2007, Sachs and Reid 2006, Tallis et al. 2008). According to Tallis et al. (2008), there are two ways to obtain the benefits of ES program which not only contribute to the conservation of natural environment but also give good value to sustainable development. First, we have to have a better understanding of how and at what rates environment produce these services can catch the attention of beneficiaries to pay for the conservation. When the benefits of the natural environment are explicitly quantified, those benefits are more valued both by the people who live in the vicinity of natural resources and the governmental or other agencies that would have to pay for a substitute source of income. Second, a focus on the conservation of ES may improve the success of projects that attempt to both goals of nurturing nature and local poor people by making markets for local people to sell their goods and services that are extracted from the ecosystem.
Payment for Environmental Services in Meru Betiri, East Java, Indonesia
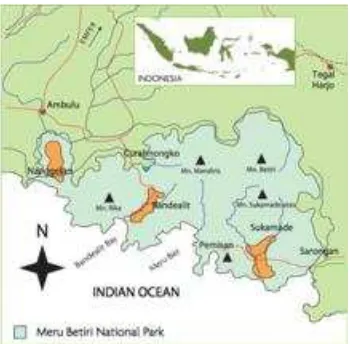
Meru Betiri National Park in East Java, Indonesia, is acclaimed to have wealth biodiversity (TN. Meru Betiri 2012, ITTO 2009 as cited in Harada et al. 2015). During the Dutch Colonial Government in 1931, the forest was first assigned as a protected area, largely intending to protecting the Javan Tiger (now considered extinct). The forest is home to an abundance of protected animals, including 180 species of birds and 29 species of mammals (TN. Meru Betiri 2012), and graduate to national park status in 1997. Despite the attempt to conserve the forest biological resources through the establishment of national parks, during the late 1990s to early 2000s, the deforestation of the forest was alarming (Casson et al. 2007). It lost approximately 2,500 hectares due to the excessive land usage by companies and small-scale farmers who competed for remaining forestland.
203
However, due to the unprecedented deforestation, several agencies take the initiative to lessen the destruction of the forest. Took place in the buffer zone of the park, in 1994, Natural Tropical Institute, Lembaga Alam Tropika, (LATIN) and the Forest Department of Bogor Agricultural University set up a seven-hectare demonstration plot to promote agroforestry practices (Aliadi 2005). The demonstration plots allegedly remained intact even though the high rate of deforestation at that time.
After the initial success of the demonstration plot and to control deforestation rate of the forest, authorities approach LATIN to repeat the same program on additional plots throughout the park. It was then the extra plots of land being established in 2001. Around 3,500 households from five villages in the vicinity of the forest, namely Curahnongko, Andongrejo, Sanenrejo, Wonoasri, and Curahtakir, were involved in the forest rehabilitation program. Furthermore, some 2,250 hectares of land had undergone reforestation by 2005. More than one hundred community forestry farmer groups with the assistance of local NGO, Sustainable Nature Conservation of Indonesia (KAIL) were engaged in the program of planting an initial 23,027 seedlings (Aliadi 2005). The fund that is provided to plant the tree by the organizer of the project is Rp3,000.00 per seed. The delivery of fund comprises of two stages. The first stage delivery is Rp1,000.00 when the planting is commencing. The remaining Rp2,000.00 given after two months of verification of seed planting (Samdhana 2015). The initiative not only benefits the forest, reestablished forest, but also produce secondary benefits to local villagers. It improves the livelihood of the villagers who are highly dependent on the forest, and it generates substantial opportunities of income for local people from the sale of forest products and medicinal plants.
Payment for Environmental Services in Segara River, Lombok, West Nusa Tenggara, Indonesia
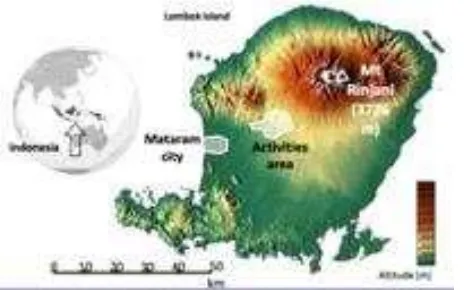
Lombok island is located east of Bali island. It is one of the driest Indonesian islands. Most of the population resides in the South West of the islands with around 400,000 inhabitants where the capital city Mataram is located. Jong Plan ka spring is used by Tanjung Regional Drinking Water Company (PDAM Tanjung). However, at the end of the 1990s, almost 50% of the springs dried up after the deforestation took place. Most people assumed that the fact of the dried springs connected with the deforestation (Munawir et al. 2003).
Figure 3. Map of Location of PES Project in Lombok, West Nusa Tenggara, Indonesia
204
Therefore, to diminish the effect of deforestation, several agencies started the development of Payments for Environmental Services (PES). For instance, PDAM Tanjung, in 2001, donating an annual fee of 2 million rupiahs to Bentek Village. PDAM also provides land compensation of about Rp500,000.00 per ha, for a 20-year concession. The company also agrees to cover the land tax owed by affected farmers for 30 years (Munawir et al. 2003). Another financial and technical support of international agencies, namely USAID, UNDP, and Ford Foundation, also initiated a program to reforesting Rinjani Mountain hills and adopting local practices.
The water service payments in Segara Basin, Lombok comprises of several packages (Munawir et al. 2003). The first package mainly for contribution to village development. The first package contributed by Lombok Inter Rafting Company, the rafting company which uses Segara river as its primary location. The company pays Rp600,000.00 per village per year to the local council. The second package is from Regional Drinking Water Company to upstream community groups. The payments are Rp2,000,000.00 in 2001 and Rp5,000,000.00 from 2002 onward.
METHOD Data Collection
The introduction of PES concept which leads to the implementation of PES pilot projects in 2001 was established by two institutions, namely the Institute of Research, Information, and Education of Social and Economic Affairs (LP3ES) and the International Institute for Environment and Development (IIED) (Budhi et al. 2008). The initial pilot projects of PES were implemented in three locations: Cidanau (Banten Province), Brantas (East Java), and West Lombok Regency (West Nusa Tenggara). Another PES like the project was established in Meru Betiri (East Java), Sumber Jaya (Lampung), Kuningan (West Java), and in other location.
This study implements the cross section/time series data set based on household units located in villages located in West Lombok Regency and Meru Betiri National Park. The two cross section data collected under the Indonesian Social Economy National Surveys (SUSENAS) by Central Statistics Bureau of Indonesia (BPS), before and following the implementation of two PES implementation projects. Specific indicators are given by some assumptions to measure rural household’s expenditures in individual villages that are affected by the implementation of PES projects. These locations are chosen because they are among the first areas in which PES project implemented, where West Lombok Regency pertain with its watershed project (Munawir et al. 2003) while Meru Betiri concern with forest conservation (Aliadi 2005). Both of them were initiated during the same period.
205
reside in the same province as the treatment group. The selection of treatment group based on the household who lives in the village where PES is implemented. I selected the control group by the district with the assumption that the characteristics of each household in the same district are indifferent.
Model Specification
The control group is households located near the location where PES is implemented. The baseline data is collected before the PES is implemented. The collection of data at this stage mainly on outcomes and it determinants both before and after the PES implemented.
Suppose the total expenditure or poverty classifications of the ��ℎ households in period � are expressed by ��, and then follow a simple OLS estimation:
�� = �+ � � + � ��+ ��� … .
where � is the parameter (intercepts), � �� represents dummy variable for implementation of PES, represents the impact of PES, �� represents a vector of characteristics of each household. We will also find some purely random error term that influences the impact of PES on socioeconomic development. it is represented in ���, which are the serially uncorrelated transitory component that are not in our observation.
Difference-in-Difference
To find out the impact of PES implementation on socioeconomic development, we should compare the dependent variables of treatment group with the dependent variables of the control group in which the PES project is not implemented. The triple forms of basic treatment evaluation, �, �, �, � =
, … , �, within the framework of a potential outcome model (POM) which assumes the treatment is potentially exposed in every element of the target population are assumed (Arriagada 2008). In this paper, the variable � which is the treatment variable, denoted by � �, represents the treatment and control group, takes the value of 1 if there is a PES project and 0 otherwise. � represents the dependent variables for household � in the PES project and � represents the dependent variables for household � in which PES project is not implemented. Inline with the aforementioned model (3.1), each household has characteristics, referred to as covariates.
In each project, the collection of data will consist of two periods, t=0,1. Where 0 indicates a time before the treatment group receives the intervention (the year 2000), called ‘pre-intervention’ and 1 means a time after the treatment group receives the intervention (the year 2008), which called ‘post-intervention.' Each household is indexed by � = , … . , �.
206
To have a better understanding of the equation of Difference-in-Difference, according to Greene (2003), the form of DD estimation in this paper can become:
�� = + � �+ �+ � �. �+ ��� … .
where � � is a dummy variable that is one for treated group and zero for untreated group. � is dummy variable of pre-intervention and post-intervention, 0 and 1 respectively. The change in the outcome variable for the treated group will be:
� |� = − � |� = = + + + − +
= + … .
for the controls:
� |� = − � |� = = + − = … .
the DD effect will be:
[ |PES = − Y |PES = ] − [ Y |PES = − Y |PES = ]
= … .
In order the DD estimator is interpreted correctly, the assumption of error term is uncorrelated must be held:
Cov εt, T =
Cov εt, t =
Cov εt, T t =
The assumption is known as the ‘parallel-trend’ assumption. It means “unobserved characteristics affecting program participation do not vary over time with treatment status” (Khandker et al. 2010:73).
Propensity Score Matching
In this paper, I use the combination of DD method and PSM. I use this method because I face the problem which is the identification of the unobservable outcome which is the counterfactual outcome. The problem occurs since I want to estimate the difference outcome of household in the treated and untreated group of intervention.
After the PES project is implemented, we can calculate the individual gain from PES implementation which is measured by τ = Y − Y . However, the evaluation problem occurs in this step because in each household i, only one of the potential outcomes is observed (Arriagada 2008:73).
Due to the problem mention above, there will be no confidence in estimating individual program impacts upon socioeconomic development. However, there still be a way out to overcome that problem which is the population average of gains from PES projects. The population averages of the frequency distributions of Y and Y can be estimated for treated and untreated group (Frondel and Schmidt 2005:519). The population average treatment effect (ATE) can measure the average causal effect of treated group (PES = relative to untreated group (PES = :
207
where E[Y − Y |PES ] represents the mean of all households that is affected by the implementation of PES. The average treatment effect on the treated (ATT) is defined by the following equation:
τA t = E[Y − Y |PES = ] … .
The ATT will be threatened by several complications when the observational data is compiled under nonrandom treatment assignment. “The possible complications are a possible correlation between the outcomes and treatment, omitted variables, and endogeneity of the treatment variable” (Cameron and Trivedi 2005:34).
Rosenbaum and Rubin (1983:54) suggest that to focus on adjusting for differences in the propensity score – the conditional probability of receiving the treatment – when the problem above occurs. They also recommend using the balancing score had the dimensionality problem occurs. They show that if potential outcomes are independent of treatment conditional on covariates, they are also independent of treatment conditional on a balancing score. A possible balancing score is the propensity score,
Pr PES = |X = e X .
If we have strong ignitability and the assumption of unconfoundedness and the overlapping holds, the propensity score matching estimator for ATT can be written in general as:
τP MA = EP X |PE = {E[Y |PES = , e X ] − E[Y |PES = , e X ]} … .
According to Arriagada (2008), “the propensity score matching estimator is simply the mean difference in outcomes over the common support, appropriately weighted by the propensity score distribution of participants.” The matching in PSM is based on the unobservable characteristics between treatment and control group.
In this study, I use a logit model to estimate the outcomes or PSM approach. According to Hirano et al. (2003:1175), the overlap observation which is crucial in this method is denser than any other model. Furthermore, Ravallion (2001:125) suggest that “the error term in the outcome equation has a logistic distribution and estimate that the parameter consistent with the assumption by the maximum likelihood.”
Therefore, this paper exercises the DD estimation by comparing the change of outcomes for the treated and control group in the period before and after the implementation of PES project. Because the treatment group is the same in the pre and post implementation, we can take the difference between them:
208
Furthermore, I can adjust propensity score in the DD regression to estimate the impact of the implementation of PES project on the socioeconomic activities with match observation:
DD = [Y − Y ] − ∑ ω i, j [Y − Y
= ] … .
where ω i, j is the weight (calculated using PSM approach) given to the post-treatment, jt , households in control group, and matched with households in treatment group (Khandker et al. 2010:80). A weighted least square regression using the PSM will generate an efficient estimator in the matching of control group observation (Hirano et al. 2003:1175).
RESULT AND DISCUSSION Pre-regression
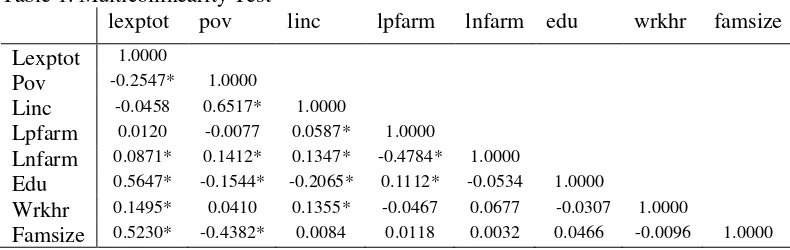
To avoid miss-estimation of the model, I do pre-regression procedures using a diagnostic test. Similar information about the dependent variable more likely appears where there are continuous variables. To avoid the miss-estimation, multicollinearity test should be attempted. Table 5 shows that there are no correlations among variables that is used in this study.
Table 1. Multicollinearity Test
lexptot pov linc lpfarm lnfarm edu wrkhr famsize
Lexptot 1.0000
Pov -0.2547* 1.0000
Linc -0.0458 0.6517* 1.0000
Lpfarm 0.0120 -0.0077 0.0587* 1.0000
Lnfarm 0.0871* 0.1412* 0.1347* -0.4784* 1.0000
Edu 0.5647* -0.1544* -0.2065* 0.1112* -0.0534 1.0000
Wrkhr 0.1495* 0.0410 0.1355* -0.0467 0.0677 -0.0307 1.0000
Famsize 0.5230* -0.4382* 0.0084 0.0118 0.0032 0.0466 -0.0096 1.0000
*Significant at 95%
Evidence from simple OLS
209 Table 2. Difference in Difference Effect of PES
Dependent Variables
All Meru Betiri Lombok
Independent (1) (2) (3) (4) (5) (6)
Variables lexptot pov lexptot pov lexptot pov
Constant 10.14*** -11.87*** 0.141** 0.148 0.00176 0.0562 (0.374) (1.217) (0.0510) (0.220) (0.0502) (0.367) Pes 0.0664 0.0615 -0.194 -1.065*** -0.361** -1.460***
(0.0447) (0.200) (0.128) (0.172) (0.139) (0.365) Year (dummy) -0.269*** -1.228*** -0.282* -0.893*** 0.0912 0.433
(0.0930) (0.185) (0.153) (0.223) (0.131) (0.485) DD interaction -0.0942 -0.385 0.141** 0.148 0.00176 0.0562 (0.117) (0.293) (0.0510) (0.220) (0.0502) (0.367) Other controls Full set Full set Full set Full set Full set Full set Observations 424 424 223 223 201 201 R-squared 0.473 0.665 0.539 0.682 0.421 0.665
Robust standard errors in parentheses *** p<0.01, ** p<0.05, * p<0.1 Source: Author
Difference-in-Difference with Propensity Score Matching
Since it is not possible to randomly assigning observations that receive the intervention or not, I use the matching technique to reduce bias. This study uses 64 observations as the treatment group, and it is composed of 11% of total observation. Based on the SUSENAS, I use household which is not affected by as control group as many 532 observations which are 89% of total observation. However, based on the propensity score, there is a restriction to capture baseline characteristic of each observation. Thus, only 44 and 324 observations for treatment and control groups respectively.
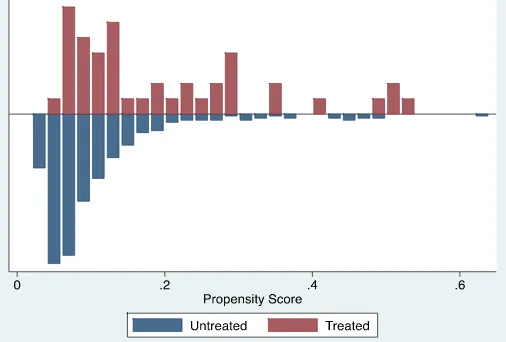
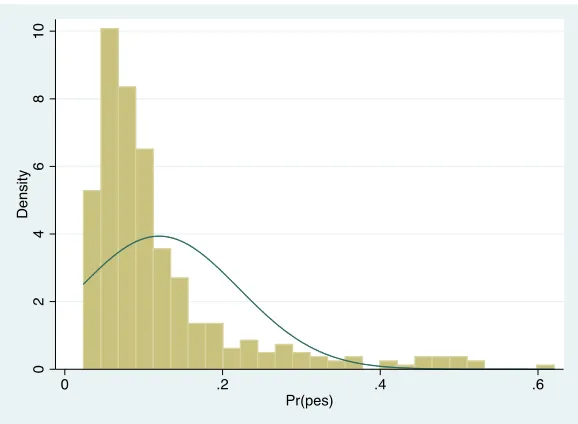
Common support test and propensity histogram should be done to prove that there is an overlap condition of observations which indicates that treatment and control group have similar characteristics. Mainly, this test purpose is to make sure that there is sufficient treatment and control group that overlaps with each other to make an acceptable comparison. Figure 5 depicts a graph of control and treatment group of the project. It shows that there is sufficient overlap observation of treatment and control group. Figure 6 shows the propensity histogram that depicts reasonable numbers of control observation to be matched with the treatment cases.
210
Figure 5. Propensity Histogram Source: Author
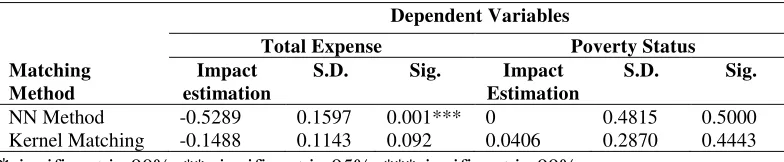
Table 3 depicts that NN matching produces greater bias than kernel matching. It can be assumed that Kernel matching gives a more appropriate estimation than NN matching.
Table 3. Bias After Matching
Total expenditure Poverty status ATT estimation ATT estimation
Matching Method n. treat
n. control
Bias Bias Redu ction
n. treat
n.
control Bias Bias Reduction
NN matching 44 324 0.1131 0.553 44 324 0.3230 0.493 Kernel Matching 44 324 0.0634 0.062 44 324 0.1719 0.044
Source: Author
The impact of PES project implementation on the total expenditure and poverty status of household is presented in Table 8. The table shows impact estimations from Nearest Neighbor and Kernel matching techniques on total household expenditure and poverty classifications as the dependent variable.
Overall, PES project implementation does not significantly affect the household’s socioeconomic status. In the presence of PES, NN matching estimates that PES project decreases household expenditure by 30%. However, NN matching has the highest bias among another method. Furthermore, using Kernel matching, I find that household’s expenditure might decrease by approximately 3% because of the implementation of PES.
For poverty classification, NN matching estimates that the implementation of PES lessens the poverty by 0.74 points. Kernel matching estimation shows that the implementation of PES only lessens poverty by 0.07 point, which means the project does not have a significant effect on the poverty alleviation.
211
matching, the project lowering the total expense by 14%. Nevertheless, using kernel matching, the program increasing total expense by 2%. Poverty status also has a different course of the result. While NN matching resulted that the project lowers it by 1.18 level, the Kernel matching shows that PES push poverty status up by 0.07 level. Only poverty status’ impact estimation using NN matching has a statistical significant result.
In Lombok, PES project has a significant effect on total expenditure using NN matching. Its effect is that it lowers total expenditure by 53%. The project lowers expenditure by 14% Using kernel matching. However, statistically, it is not significant. On the poverty status, both matchings show that the project has no statistically significant result. While kernel matching shows that the program increases the status of poverty of each household by 0.04 level, NN matching shows no estimated effect on poverty status.
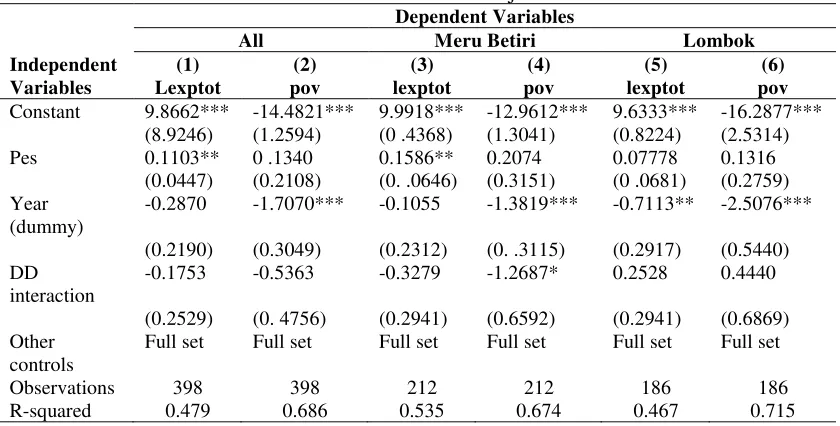
Table 4. Meru Betiri and Lombok Combined
Dependent Variables
*significant in 90%; ** significant in 95%; ***significant in 99%
Table 5. Meru Betiri
*significant in 90%; ** significant in 95%; ***significant in 99%
Table 6. Lombok
*significant in 90%; ** significant in 95%; ***significant in 99% Evidence from OLS with propensity score
212
economically, the project does not affect the treated group much. However, in Meru Betiri, the poverty status is significantly affected by the project. It is worsening the household poverty status by 1.3 level. Nevertheless, the DD estimation shows that – even though it has 32.8% of the decrease in total expense of each household – PES does not have a significant effect. In Lombok, PES is positively affecting the total expenditure by 25.3% and poverty status by 0.44 level. But, it does not have significant evidence in the calculation.
Table 7. Difference-in-Difference Estimation of PES Projects Dependent Variables
*significant in 90%; ** significant in 95%; ***significant in 99%
Discussion
Based on the evidence of difference-in-difference estimation in simple OLS regression, generally, there is no significant effect of PES project both in total expenditure and poverty status after controlling for total income, total income from farming, total income from non-farming, education attainment, working hours, and family size. The statistically significant effect of pes is in Meru Betiri on total expenditure of households. The program increase households’ total expense by 14%.
If we look at the effect of PES project between control and treatment group we find that the project, in the combined model, has very small effect between both groups. The treated household has 6% more total expenditure than the controls. In the poverty status, the treated is better by 0.06 level than the controls1. The coefficient is very small. It shows that the effect between both group is not significant. Moreover, statistically, it has no significant evidence.
After splitting the area into two, I find that the effect between treated and controls has different result. In Meru Betiri, household that are in the area of PES project has lower total expenditure than the control group by 19% - even though statistically insignificant – and they also have lower poverty status than the controls
213
by 1 level. The treated has lower expenditure than the controls by 36%. Further, PES project in Lombok also has negative result. In poverty status, after the PES project is implemented, the treated has lower poverty status than the control by 1.5 level.
In the second estimation using DD with Propensity Score Matching, the effect of PES project in combined model shows that the only significant effect is the total expenditure of each household. The project has impacted the decrease in total expenditure by 30% using Nearest Neighbor matching. On the other hand, using Kernel matching, the impact only lower the total expense by 3%. In poverty status, both matching shows no significant effect of PES. The impact only shows 0.73 and 0.06 level rise of poverty status on NN matching and Kernel matching, respectively, which is very small.
When splitting the area into two provinces, only poverty status in Meru Betiri and total expenditure in Lombok which shows the significant effect of PES project. In regard to this is important to note that only poverty status that has significant effect in Meru Betiri and total expenditure in Lombok, both using NN matching.
In Meru Betiri, PES has different impact between NN matching and Kernel Matching. While it lowers the expenditure by 14% using NN matching, Kernel matching resulted on that PES increase total expenditure by only 2%. Furthermore, the project increases the poverty status by 1.18 level – which is significant – using NN matching. On the other hand, using Kernel matching, it decreases the level of poverty status by 0.02 level.
The evidence from Lombok shows that the effect of PES is decreased total expenditure by 53% using NN matching and 15% using Kernel matching. However, poverty status shows no significant evidence. Using NN matching there is no impact, while using Kernel matching it increases the status level by 0.04.
In the third estimation, which is OLS with propensity score, PES project has no significant effect both on total expenditure and poverty status in all area. The project pushes total expenditure by 17% and poverty status by 0.54 level. However, when I split into two provinces, the result shows there is a significant effect on poverty status in Meru Betiri. It lowers the status by 1.27 level. Total expenditure in Meru Betiri has slight decrease by 33%. In Lombok, both total expenditure and poverty status has no significant effect of PES project. The project increases total expenditure by 25%. It also pull-up the poverty status by 0.44 level.
There is different result while using three different statistical methods. First, In the simple OLS, generally, PES has no significant effect on local socioeconomic status. Only when splitting the area into two areas, the evidence shows that in Meru Betiri the project has statistically significant on total expenditure. Second, using DD with PSM, in combined area, the project has a significant effect on total expenditure using NN matching. When estimating the impact while splitting the area into two, the significance of PES project is on poverty status in Meru Betiri and total expenditure in Lombok, both using NN matching. Lastly, using OLS with propensity score, in combined area, PES project has no significant effect. The insignificant effect also occurs when I estimate the effect of PES while using two provinces, except for poverty status in Meru Betiri.
214
between 9% to 53%. The biggest impact is in Lombok using NN matching which is 53%, while the lowest impact is when using simple OLS. This difference might be due to the advantages of PSM which are imposed common support and parametric (CIE). The common support compares the comparable and semi-parametric only parameterizes the participation while regression is fully semi-parametric. In poverty status, PES has two different results which are lowering the level of poverty status and upgrade the status of each household. The most significant and less bias is when I estimate using PSM – NN matching –, PES significantly improving poverty status of household by one level.
To sum up, while there is no strong significant statistical evident on PES impact, we can say that the project has the impact on socioeconomic status when we see it from the coefficient of the impact estimator. From the evidence above, PES has a positive effect on the socioeconomic status of local livelihood. Moreover, the effect of PES differs in each location of implementation.
CONCLUSION
The fact that environmental services have important value to overall human well-being is well recognized (MEA 2005). However, to have the environmental services managed and conserved, it will impose a cost which also generates benefit (West et al. 2006, Abel et al. 2008, Wunder 2005). The cost of maintaining environmental services not only to preserve the ecosystem of natural resources but also to maintain the well-being of local people who live in the vicinity of those natural resources. Both scientist and conservationists have been taken an interest in a tool to help both people and biodiversity by maintaining environmental services. A project that use environmental services to advantage both people and biodiversity simultaneously has been researched. It has led to the development of Payment for Environmental Services (PES). It is an approach which has two objectives: conserve natural resources and improve people well-being.
However, to obtain both objectives is slightly complicated. The effect of PES still been in the discourse of researchers. With dual purposes, it might be benefited one side while the other side suffer. Therefore, the best system to apply PES is still in the development process. Even though there are many PES program that has been successfully implemented and bring forth a good result. Regardless of how the PES has been successfully implemented, developing countries still are laboratories to find out the effect of implementation of this program. Indonesia is one of them. Although it has great PES and PES-like program, the empirical research about the effect of the program is still lacking.
This paper attempts to fulfill the causality gap of between people who highly dependent on the forest and implementation of PES project. This paper examines whether the PES has a positive and significant effect on socioeconomic development in the area where the project was implemented. I use two sets of data survey which assumed to have similar characteristics in the baseline period as treatment and control group. After exercise matching, the data that is used in this paper is 368 observations. The data sets consist of 1999 and 2008 surveys as baseline and follow-up data, respectively. Based on the data that I use, this study only captures a short-term impact of the implementation of PES.
215
magnitude of the coefficient, the project proofed to has effect in lowering total expenditure by 53% and improving poverty status by 1 level. Further study needs to be done to find out whether PES has reduced the total expenditure of local household.
Based on the evidence, PES affecting total expenditure positively and it also has a positive effect on poverty status. The evidence also shows that the effect of PES project differs between each location where it is implemented. However, both evidence is not strongly supported by the statistical significance.
Additional notes on PES program based on the result is that the implementation of PES programs has to be reassessed. Not only PES in Indonesia, but also as the program itself as a whole. Can the program met its core purposes to promote local livelihood and nurturing natural resources? Has it step in the early stage of being the solution of Sustainable Development?
Finally, I have some suggestion for further research on evaluating the impact of PES projects on household livelihood. First, to have the more profound result of the impact of PES implementation on household, another variable such as distance to the nearest market can be added. The reason for this is that household distance to the market can depict their economic behavior such as selling natural resources or spending money. Furthermore, deforestation rate can also be included. It can show how local people do their responsibility on nurturing forest cover. Second, in evaluating policy, a longer period of study can give more comprehension on how the policy is implemented. It also applied in PES project, evaluating the impact in a long period will have more benefit to it. Moreover, larger observations will also make the evaluation more profound. It is better if the future study can involve more extensive observations which consist of all PES project in Indonesia to capture some more generalized findings.
ACKNOWLEDGEMENT
I would first like to thank my research paper supervisor Dr. Lorenzo Pellegrini for his support and understanding throughout the making of this research paper. He consistently allowed this paper to be my own work, but direct me to the right direction whenever he thought I needed it. I would also like to thank my second reader Dr. Robert Sparrow for providing valuable comments in the process of this research paper. I would also like to thank for I Gede Gelgel Darma Putra Wirawan. His paper, The Impact of National Park Establishment on Economic Activities of Rural Households in Indonesia, inspired me to write this Research Paper.
REFERENCES
Aliadi, A., & Tropika, L. (2005). Community Forestry Supporting Resilience in Meru Betiri Park, Indonesia,
Budhi, G. S., Kuswanto, S., & Muhammad, I. (2008). Concept and Implementation of PES Program in the Cidanau Watershed: A Lesson Learned for Future Environmental Policy. Policy Analysis of Farming, 6(1), 37-55.
Cameron, A. C., & Trivedi, P. K. (2005). Microeconometrics: Methods and Applications Cambridge University Press.
216
Enforcement in Indonesia. Jakarta: WWF Indonesia, World Bank, DFID-Multistakeholder Forestry Program,
Engel, S., Pagiola, S., & Wunder, S. (2008). Designing Payments for Environmental Services in Theory and Practice: An Overview of the Issues. Ecological Economics, 65(4), 663-674.
Ferraro, P. J. (2001). Global Habitat Protection: Limitations of Development Interventions and a Role for Conservation Performance Payments. Conservation Biology, 15(4), 990-1000.
Ferraro, P. J., & Simpson, R. D. (2002). The Cost-effectiveness of Conservation Payments. Land Economics, 78(3), 339-353.
Ferraro, P. J., & Kiss, A. (2002). Ecology. Direct Payments to Conserve Biodiversity. Science (New York, N.Y.), 298(5599), 1718-1719. doi:10.1126/science.1078104 [doi]
Fisher, B., Turner, K., Zylstra, M., Brouwer, R., Groot, R., Farber, S., . . . Harlow, J. (2008). Ecosystem Services and Economic Theory: Integration for Policy‐ Relevant Research. Ecological Applications, 18(8), 2050-2067.
Frondel, M., & Schmidt, C. M. (2005). Evaluating Environmental Programs: the Perspective of Modern Evaluation Research. Ecological Economics, 55(4), 515-526.
Harada, K., Prabowo, D., Aliadi, A., Ichihara, J., & Ma, H. (2015). How Can Social Safeguards of REDD Function Effectively Conserve Forests and Improve Local Livelihoods? A Case from Meru Betiri National Park, East Java, Indonesia. Land, 4(1), 119-139.
Hirano, K., Imbens, G. W., & Ridder, G. (2003). Efficient Estimation of Average Treatment Effects Using the Estimated Propensity Score. Econometrica, 71(4), 1161-1189.
Imbens, G. W. (2004). Nonparametric Estimation of Average Treatment Effects under Exogeneity: A Review. Review of Economics and Statistics, 86(1), 4-29.
Kaimowitz, D., & Sheil, D. (2007). Conserving What and for Whom? Why Conservation Should Help Meet Basic Human Needs in the Tropics. Biotropica, 39(5), 567-574.
Khandker, S. R., Koolwal, G. B., & Samad, H. A. (2010). Handbook on Impact Evaluation: Quantitative Methods and Practices World Bank Publications. Landell-Mills, N., & Porras, I. T. (2002). Silver Bullet or Fools' Gold?: A Global
Review of Markets for Forest Environmental Services and Their Impact on the Poor International Institute for Environment and Development London. Munawir, S., Salim, S., Suyanto, A., & Vermeulen, S. (2003). Action-learning to
Develop and Test Upstream-downstream Transactions for Watershed Protection Services: A Diagnostic Report from Segara River Basin, Indonesia. Centre for Water and Land Resources Development and Studies, Jakarta and IIED, London,
217
Pagiola, S., Ramírez, E., Gobbi, J., de Haan, C., Ibrahim, M., Murgueitio, E., & Ruíz, J. P. (2007). Paying for the Environmental Services of Silvopastoral Practices in Nicaragua. Ecological Economics, 64(2), 374-385.
Persson, U. M., & Alpizar, F. (2013). Conditional Cash Transfers and Payments for Environmental Services—A Conceptual Framework for Explaining and Judging Differences in Outcomes. World Development, 43, 124-137. Ravallion, M. (2001). The Mystery of the Vanishing Benefits: An Introduction to
Impact Evaluation. The World Bank Economic Review, 15(1), 115-140. Ravallion, M. (2007). Evaluating Anti-poverty Programs. Handbook of
Development Economics, 4, 3787-3846.
Robalino, J. A. (2007). Land Conservation Policies and Income Distribution: Who Bears the Burden of Our Environmental Efforts? Environment and Development Economics, 12(04), 521-533.
Rosenbaum, P. R., & Rubin, D. B. (1983). The Central Role of the Propensity Score in Observational Studies for Causal Effects. Biometrika, 70(1), 41-55. Rubin, D. B. (2004). Multiple Imputation for Nonresponse in Surveys John Wiley
& Sons.
Sachs, J. D., & Reid, W. V. (2006). Investments Toward Sustainable Development. Science(Washington), 312(5776), 1002.
Suyanto, S., Khususiyah, N., & Leimona, B. (2007). Poverty and Environmental Services: Case Study in Way Besai Watershed, Lampung Province, Indonesia. Ecology and Society, 12(2), 13.
Tallis, H., Kareiva, P., Marvier, M., & Chang, A. (2008). An Ecosystem Services Framework to Support both Practical Conservation and Economic Development. Proceedings of the National Academy of Sciences of the
United States of America, 105(28), 9457-9464.
doi:10.1073/pnas.0705797105 [doi]
Wirawan, I Gede Gelgel Darma Putra. (2013). The Impact of National Park Establishment on Economic Activities of Rural Households in Indonesia. Working, H. (1943). Statistical Laws of Family Expenditure. Journal of the
American Statistical Association, 38(221), 43-56.
Wunder, S. (2005). Payments for Environmental Services: Some Nuts and Bolts, Wunder, S. (2007). The Efficiency of Payments for Environmental Services in
Tropical Conservation. Conservation Biology, 21(1), 48-58.
Wunder, S. (2015). Revisiting the Concept of Payments for Environmental Services. Ecological Economics, 117, 234-243.
Yin, R., Liu, C., Zhao, M., Yao, S., & Liu, H. (2014). The Implementation and Impacts of China's Largest Payment for Ecosystem Services Program as Revealed by Longitudinal Household Data. Land Use Policy, 40, 45-55. Zilberman, D., Lipper, L., & McCarthy, N. (2006). When are Payments for