LAMPIRAN 1
KUESIONER PENELITIAN
PENENTUAN FAKTOR YANG MEMPENGARUHI PRODUKTIVITAS
TENAGA KERJA DAN RANCANGAN STRATEGI PERBAIKAN
(STUDI KASUS DI PT.INTAN SUAR KARTIKA)
Kepada Yth.
Karyawan Bagian Produksi Paku PT.Intan Suar Kartika
Terima kasih atas partisipasi anda menjadi peserta survey dan secara sukarela mengisi
kuesioner ini. Nama saya Abdul Azis Syarif, mahasiswa pasca sarjana Teknik
Industri USU, pada saat ini sedang mengadakan penelitian tentang faktor yang
mempengaruhi produktivitas tenaga kerja di PT.Intan Suar Kartika. Saya sangat
menghargai kejujuran anda dalam mengisi kuesioner ini. Kami menjamin kerahasiaan
anda yang terkait dengan kuesioner. Hasil Kuesioner ini semata-mata akan digunakan
untuk tujuan penelitian dan bukan tujuan komersil.
Nama
:
Umur
:
Jenis Kelamin
:
Jabatan/bidang
:
Pendidikan
:
Petunjuk :
Berdasarkan pengalaman anda selama ini, berilah tanda (√) p
ada kolom yang telah
disediakan sesuai harapan anda dan kenyataan.
Keterangan :
SS (sangat setuju), S (setuju), N ( Netral), TS (tidak setuju)., STS (sangat Tidak
Setuju)
No
DAFTAR PERTANYAAN
SS
S
N
TS STS
KOMPETENSI
1
Prosedur kerja di perusahaan mudah dipahami oleh
karyawan
2
Arahan dari atasan mengenai pekerjaan mudah di
pahami
3
Mampu menyelesaikan permasalahan jika terjadi
masalah dalam pekerjaan,
4.
Adanya deskripsi/gambaran pekerjaan yang saya
lakukan
5.
Bisa bekerjasama dengan karyawan lain dalam
melakukan pekerjaan
6.
Perlunya ada rasa kedisiplinan dalam melaksanakan
instruksi kerja
FASILITAS KERJA
7
Adanya kemudahan penggunaan peralatan dalam
bekerja
9.
Tersedianya peralatan kerja yang memadai
10. Adanya kesesuaian peralatan kerja di tempat kerja
11.
Peralatan kerja yang ada sudah memberikan rasa aman
bagi karyawan
12.
Perlengkapan penerangan lampu dalam ruangan sudah
memadai
MOTIVASI KERJA
13.
Perusahaan memberikan kebebasan karyawan
memberikan ide-ide demi kemajuan perusahaan
14.
Adanya kesempatan yang berikan perusahaan untuk
mengembangkan kemampuan
15.
Gaji dapat memberikan dorongan untuk bekerja lebih
baik
16.
Adanya kesesuain gaji dengan beban kerja yang ada
selama ini
17.
Perusahaan memberikan sistem promosi karir yang
jelas bagi karyawan
18. Hasil kerja yang baik layak mendapat pengahargaan
PENGALAMAN KERJA
19.
Kematangan bekerja menggambarkan penguasaan
seorang karyawan terhadap suatu pekerjaan
20.
Semakin lama seorang melaksanakan pekerjaan akan
memperoleh pengalaman lebih banyak
21.
Banyaknya jenis tugas yang telah dilaksanakan akan
membuat sesorang akan bekerja lebih baik
22.
Perusahaan memberikan pengetahuan,ketrampilan
melalui pelatihan bagi karyawan
23.
Semakin lama seseorang bekerja akan membentuk
24.
Melalui pelatihan akan mampu membuat seorang
pekerja menyelesaikan tugas dengan tepat
PRODUKTIVITAS TENAGA KERJA
25.
Mampu mengerjakan tugas sesuai target yang
diinginkan
26. Hasil kerja sudah sesuai dengan diharapkan
27.
Produksi yang dihasilkan telah memenuhi sasaran
mutu yang telah ditetapkan
LAMPIRAN 2
OUTPUT VALIDITAS DAN RELIABILITAS
1.
VARIABEL X
1
VALIDITAS
Correlati ons
1 .088 .375* .357 .428* .428* .705**
.642 .041 .053 .018 .018 .000
30 30 30 30 30 30 30
.088 1 .530** .433* .403* .269 .575**
.642 .003 .017 .027 .151 .001
30 30 30 30 30 30 30
.375* .530** 1 .612** .507** .349 .741**
.041 .003 .000 .004 .059 .000
30 30 30 30 30 30 30
.357 .433* .612** 1 .440* .310 .706**
.053 .017 .000 .015 .095 .000
30 30 30 30 30 30 30
.428* .403* .507** .440* 1 .759** .818**
.018 .027 .004 .015 .000 .000
30 30 30 30 30 30 30
.428* .269 .349 .310 .759** 1 .735**
.018 .151 .059 .095 .000 .000
30 30 30 30 30 30 30
.705** .575** .741** .706** .818** .735** 1
.000 .001 .000 .000 .000 .000
30 30 30 30 30 30 30
X1.1.1 X1.1.2 X1.2.1 X1.2.2 X1.3.1 X1.3.2 X1
Correlation is signif icant at the 0.05 lev el (2-tailed). *.
2. VARIABEL X
2VALIDITAS
Case Processing Summary
30
100.0
0
.0
30
100.0
Valid
Excluded
aTotal
Cases
N
%
Listwise deletion based on all
v ariables in the procedure.
a.
Reliabi lity Statisti cs
.774
7
Cronbach's
Correlati ons
1
.088
.375*
.357
.428*
.349
.705**
.642
.041
.053
.018
.059
.000
30
30
30
30
30
30
30
.088
1
.530**
.433*
.403*
.134
.559**
.642
.003
.017
.027
.479
.001
30
30
30
30
30
30
30
.375*
.530**
1
.612**
.507**
.190
.723**
.041
.003
.000
.004
.314
.000
30
30
30
30
30
30
30
.357
.433*
.612**
1
.440*
.310
.725**
.053
.017
.000
.015
.095
.000
30
30
30
30
30
30
30
.428*
.403*
.507**
.440*
1
.639**
.811**
.018
.027
.004
.015
.000
.000
30
30
30
30
30
30
30
.349
.134
.190
.310
.639**
1
.641**
.059
.479
.314
.095
.000
.000
30
30
30
30
30
30
30
.705**
.559**
.723**
.725**
.811**
.641**
1
.000
.001
.000
.000
.000
.000
30
30
30
30
30
30
30
X2.1.1
X2.1.2
X2.2.1
X2.2.2
X2.3.1
X2.3.2
X2
Correlation is signif icant at the 0.05 lev el (2-tailed).
*.
Correlation is signif icant at the 0.01 lev el (2-tailed).
**.
Case Processing Summary
30
100.0
3.
VARIABEL X
3VALIDITAS
4. Variable X4
Validitas
Reliabi lity Statisti cs
.769
7
Cronbach's
Alpha
N of Items
Correlati ons
1 .000 .286 .288 .410* .249 .645** 1.000 .125 .123 .025 .185 .000
30 30 30 30 30 30 30
.000 1 .530** .433* .351 .095 .538** 1.000 .003 .017 .057 .617 .002
30 30 30 30 30 30 30
.286 .530** 1 .612** .465** .235 .729** .125 .003 .000 .010 .210 .000
30 30 30 30 30 30 30
.288 .433* .612** 1 .506** .247 .738** .123 .017 .000 .004 .188 .000
30 30 30 30 30 30 30
.410* .351 .465** .506** 1 .459* .796** .025 .057 .010 .004 .011 .000
30 30 30 30 30 30 30
.249 .095 .235 .247 .459* 1 .566** .185 .617 .210 .188 .011 .001
30 30 30 30 30 30 30
.645** .538** .729** .738** .796** .566** 1 .000 .002 .000 .000 .000 .001
30 30 30 30 30 30 30
X3.1.1 X3.1.2 X3.2.1 X3.2.2 X3.3.1 X3.3.2 X3
Correlation is signif icant at the 0.05 lev el (2-tailed). *.
Correlation is signif icant at the 0.01 lev el (2-tailed). **.
Reliabi lity Statisti cs
.761
7
Cronbach's
VARIABEL Y
VALIDITAS
Correlati ons
1
-.098
.232
.295
.397*
.290
.553**
.605
.218
.113
.030
.119
.002
30
30
30
30
30
30
30
-.098
1
.354
.400*
.134
.211
.495**
.605
.055
.029
.479
.263
.005
30
30
30
30
30
30
30
.232
.354
1
.354
.190
.209
.572**
.218
.055
.055
.314
.268
.001
30
30
30
30
30
30
30
.295
.400*
.354
1
.403*
.211
.697**
.113
.029
.055
.027
.263
.000
30
30
30
30
30
30
30
.397*
.134
.190
.403*
1
.465**
.562**
.030
.479
.314
.027
.010
.001
30
30
30
30
30
30
30
.290
.211
.209
.211
.465**
1
.537**
.119
.263
.268
.263
.010
.002
30
30
30
30
30
30
30
.553**
.495**
.572**
.697**
.562**
.537**
1
.002
.005
.001
.000
.001
.002
30
30
30
30
30
30
30
X4.1.1
X4.1.2
X4.2.1
X4.2.2
X4.3.1
X4.3.2
X4
Correlation is signif icant at the 0.05 lev el (2-tailed).
*.
Correlation is signif icant at the 0.01 lev el (2-tailed).
**.
Reliabi lity Statisti cs
.715
7
Cronbach's
LAMPIRAN 2
Correlations
1
-.089
.180
.113
.512**
.640
.340
.554
.004
30
30
30
30
30
-.089
1
.570**
.241
.542**
.640
.001
.200
.002
30
30
30
30
30
.180
.570**
1
.464**
.672**
.340
.001
.010
.000
30
30
30
30
30
.113
.241
.464**
1
.574**
.554
.200
.010
.001
30
30
30
30
30
.512**
.542**
.672**
.574**
1
.004
.002
.000
.001
30
30
30
30
30
Pearson Correlation
Sig. (2-tailed)
N
Pearson Correlation
Sig. (2-tailed)
N
Pearson Correlation
Sig. (2-tailed)
N
Pearson Correlation
Sig. (2-tailed)
N
Pearson Correlation
Sig. (2-tailed)
N
Y 1.1.1
Y 1.1.2
Y 1.2.1
Y 1.2.2
Y 1
Y 1.1.1
Y 1.1.2
Y 1.2.1
Y 1.2.2
Y 1
Correlation is signif icant at the 0.01 lev el (2-tailed).
**.
Reliabi lity Statisti cs
.681
5
Cronbach's
OUTPUT KORELASI
Correlations
X1
X2
X3
X4
Y
X1 Pearson Correlation
1
.800
**.372
*.797
**.414
**Sig. (2-tailed)
.000
.018
.000
.008
N
86
86
86
86
86
X2 Pearson Correlation
.800
**1
.211
.532
**.280
Sig. (2-tailed)
.000
.190
.000
.080
N
86
86
86
86
86
X3 Pearson Correlation
.372
*.211
1
.352
*.493
**Sig. (2-tailed)
.018
.190
.026
.001
N
86
86
86
86
86
X4 Pearson Correlation
.797
**.532
**.352
*1
.264
Sig. (2-tailed)
.000
.000
.026
.100
N
86
86
86
86
86
Y
Pearson Correlation
.414
**.280
.493
**.264
1
Sig. (2-tailed)
.008
.080
.001
.100
N
86
86
86
86
86
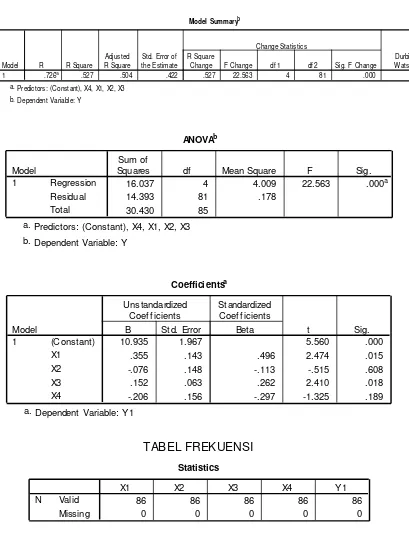
ANALISIS REGRESI LINIER BERGANDA
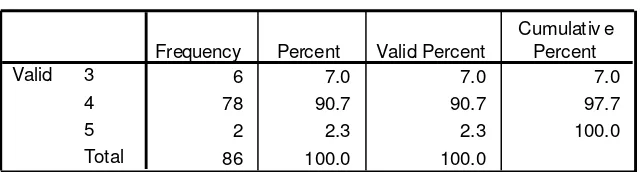
TABEL FREKUENSI
Model Summaryb
.726a .527 .504 .422 .527 22.563 4 81 .000 2.653
Std. Error of the Estimate
Predictors: (Constant), X4, X1, X2, X3 a.
Dependent Variable: Y b.
ANOVA
b16.037
4
4.009
22.563
.000
a14.393
81
.178
30.430
85
Squares
df
Mean Square
F
Sig.
Predictors: (Const ant), X4, X1, X2, X3
a.
Dependent Variable: Y
b.
Coeffi ci ents
a10.935
1.967
5.560
.000
.355
.143
.496
2.474
.015
-.076
.148
-.113
-.515
.608
.152
.063
.262
2.410
.018
-.206
.156
-.297
-1.325
.189
(Constant)
Coef f icients
Beta
St andardized
Coef f icients
t
Sig.
X1
86
100.0
100.0
18
Frequency
Percent
Valid Percent
Cumulat iv e
Percent
86
100.0
100.0
20
Frequency
Percent
Valid Percent
Cumulat iv e
Percent
86 100.0 100.0
18
Frequency Percent Valid Percent
X4
7
8.1
8.1
8.1
8
9.3
9.3
17.4
20
23.3
23.3
40.7
7
8.1
8.1
48.8
24
27.9
27.9
76.7
12
14.0
14.0
90.7
6
7.0
7.0
97.7
1
1.2
1.2
98.8
1
1.2
1.2
100.0
86
100.0
100.0
20
21
22
23
24
25
26
27
28
Total
Valid
Frequency
Percent
Valid Percent
Cumulat iv e
Percent
Y1
3
3.5
3.5
3.5
6
7.0
7.0
10.5
16
18.6
18.6
29.1
32
37.2
37.2
66.3
18
20.9
20.9
87.2
10
11.6
11.6
98.8
1
1.2
1.2
100.0
86
100.0
100.0
13
14
15
16
17
18
19
Total
Valid
Frequency
Percent
Valid Percent
LAMPIRAN 6
TABEL ANALISIS DESKRIPTIF
VARIABEL X1
X1.1. 1
18
20.9
20.9
20.9
50
58.1
58.1
79.1
18
20.9
20.9
100.0
86
100.0
100.0
3
4
5
Total
Valid
Frequency
Percent
Valid Percent
Cumulat iv e
Percent
X1.1. 2
18
20.9
20.9
20.9
58
67.4
67.4
88.4
10
11.6
11.6
100.0
86
100.0
100.0
3
4
5
Total
Valid
Frequency
Percent
Valid Percent
Cumulat iv e
Percent
X1.2. 1
6
7.0
7.0
7.0
78
90.7
90.7
97.7
2
2.3
2.3
100.0
86
100.0
100.0
3
4
5
Total
Valid
Frequency
Percent
Valid Percent
X1.2. 2
1
1.2
1.2
1.2
13
15.1
15.1
16.3
67
77.9
77.9
94.2
5
5.8
5.8
100.0
86
100.0
100.0
2
3
4
5
Total
Valid
Frequency
Percent
Valid Percent
Cumulat iv e
Percent
X1.3. 1
3
3.5
3.5
3.5
18
20.9
20.9
24.4
63
73.3
73.3
97.7
2
2.3
2.3
100.0
86
100.0
100.0
2
3
4
5
Total
Valid
Frequency
Percent
Valid Percent
Cumulat iv e
Percent
X1.3. 2
1
1.2
1.2
1.2
16
18.6
18.6
19.8
64
74.4
74.4
94.2
5
5.8
5.8
100.0
86
100.0
100.0
2
3
4
5
Total
Valid
Frequency
Percent
Valid Percent
VARIABEL X2
X1
1
1.2
1.2
1.2
5
5.8
5.8
7.0
6
7.0
7.0
14.0
18
20.9
20.9
34.9
8
9.3
9.3
44.2
27
31.4
31.4
75.6
13
15.1
15.1
90.7
7
8.1
8.1
98.8
1
1.2
1.2
100.0
86
100.0
100.0
18
20
21
22
23
24
25
26
28
Total
Valid
Frequency
Percent
Valid Percent
Cumulat iv e
Percent
X2.1. 1
13
15.1
15.1
15.1
45
52.3
52.3
67.4
28
32.6
32.6
100.0
86
100.0
100.0
3
4
5
Total
Valid
Frequency
Percent
Valid Percent
Cumulat iv e
Percent
X2.1. 2
15
17.4
17.4
17.4
58
67.4
67.4
84.9
13
15.1
15.1
100.0
86
100.0
100.0
3
4
5
Total
Valid
Frequency
Percent
Valid Percent
X2.2. 1
10
11.6
11.6
11.6
71
82.6
82.6
94.2
5
5.8
5.8
100.0
86
100.0
100.0
3
4
5
Total
Valid
Frequency
Percent
Valid Percent
Cumulat iv e
Percent
X2.2. 2
21
24.4
24.4
24.4
57
66.3
66.3
90.7
8
9.3
9.3
100.0
86
100.0
100.0
3
4
5
Total
Valid
Frequency
Percent
Valid Percent
Cumulat iv e
Percent
X2.3. 1
8
9.3
9.3
9.3
31
36.0
36.0
45.3
45
52.3
52.3
97.7
2
2.3
2.3
100.0
86
100.0
100.0
2
3
4
5
Total
Valid
Frequency
Percent
Valid Percent
Cumulat iv e
Percent
X2.3. 2
22
25.6
25.6
25.6
55
64.0
64.0
89.5
9
10.5
10.5
100.0
86
100.0
100.0
3
4
5
Total
Valid
Frequency
Percent
Valid Percent
VARIABEL X3
86
100.0
100.0
20
Frequency
Percent
Valid Percent
Cumulat iv e
Percent
X3.1. 1
10
11.6
11.6
11.6
22
25.6
25.6
37.2
43
50.0
50.0
87.2
11
12.8
12.8
100.0
86
100.0
100.0
2
Frequency
Percent
Valid Percent
Cumulat iv e
Percent
86
100.0
100.0
2
Frequency
Percent
Valid Percent
X3.2. 1
9
10.5
10.5
10.5
74
86.0
86.0
96.5
3
3.5
3.5
100.0
86
100.0
100.0
3
4
5
Total
Valid
Frequency
Percent
Valid Percent
Cumulat iv e
Percent
X3.3. 1
4
4.7
4.7
4.7
28
32.6
32.6
37.2
49
57.0
57.0
94.2
5
5.8
5.8
100.0
86
100.0
100.0
2
3
4
5
Total
Valid
Frequency
Percent
Valid Percent
Cumulat iv e
Percent
X3.3. 2
17
19.8
19.8
19.8
21
24.4
24.4
44.2
42
48.8
48.8
93.0
6
7.0
7.0
100.0
86
100.0
100.0
2
3
4
5
Total
Valid
Frequency
Percent
Valid Percent
VARIABEL X4
86
100.0
100.0
16
Frequency
Percent
Valid Percent
Cumulat iv e
Percent
X4.1. 1
1
1.2
1.2
1.2
12
14.0
14.0
15.1
41
47.7
47.7
62.8
32
37.2
37.2
100.0
86
100.0
100.0
2
Frequency
Percent
Valid Percent
Cumulat iv e
Percent
86
100.0
100.0
2
Frequency
Percent
Valid Percent
X4.2. 1
9
10.5
10.5
10.5
72
83.7
83.7
94.2
5
5.8
5.8
100.0
86
100.0
100.0
3
4
5
Total
Valid
Frequency
Percent
Valid Percent
Cumulat iv e
Percent
86
100.0
100.0
2
Frequency
Percent
Valid Percent
Cumulat iv e
Percent
86
100.0
100.0
2
Frequency
Percent
Valid Percent
Cumulat iv e
Percent
X4.3. 2
2
2.3
2.3
2.3
13
15.1
15.1
17.4
54
62.8
62.8
80.2
17
19.8
19.8
100.0
86
100.0
100.0
2
Frequency
Percent
Valid Percent
VARIABEL Y1
X4
6
7.0
7.0
7.0
9
10.5
10.5
17.4
19
22.1
22.1
39.5
8
9.3
9.3
48.8
23
26.7
26.7
75.6
13
15.1
15.1
90.7
6
7.0
7.0
97.7
1
1.2
1.2
98.8
1
1.2
1.2
100.0
86
100.0
100.0
20
21
22
23
24
25
26
27
28
Total
Valid
Frequency
Percent
Valid Percent
Cumulat iv e
Percent
Y1.1.1
4
4.7
4.7
4.7
20
23.3
23.3
27.9
40
46.5
46.5
74.4
22
25.6
25.6
100.0
86
100.0
100.0
2
3
4
5
Total
Valid
Frequency
Percent
Valid Percent
Cumulat iv e
Percent
Y1.1.2
9
10.5
10.5
10.5
69
80.2
80.2
90.7
8
9.3
9.3
100.0
86
100.0
100.0
3
4
5
Total
Valid
Frequency
Percent
Valid Percent
Y1.2.1
10
11.6
11.6
11.6
64
74.4
74.4
86.0
12
14.0
14.0
100.0
86
100.0
100.0
3
4
5
Total
Valid
Frequency
Percent
Valid Percent
Cumulat iv e
Percent
Y1.2.2
14
16.3
16.3
16.3
54
62.8
62.8
79.1
18
20.9
20.9
100.0
86
100.0
100.0
3
4
5
Total
Valid
Frequency
Percent
Valid Percent
Cumulat iv e
Percent
Y1
3
3.5
3.5
3.5
6
7.0
7.0
10.5
19
22.1
22.1
32.6
30
34.9
34.9
67.4
18
20.9
20.9
88.4
9
10.5
10.5
98.8
1
1.2
1.2
100.0
86
100.0
100.0
13
14
15
16
17
18
19
Total
Valid
Frequency
Percent
Valid Percent
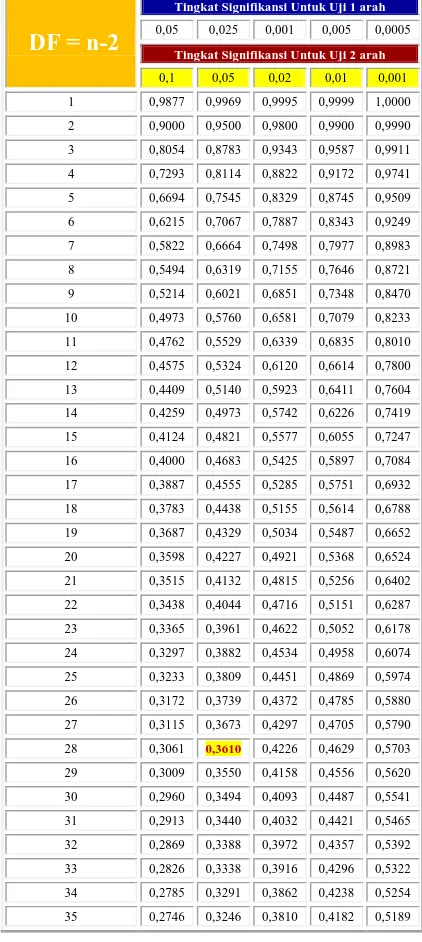
LAMPIRAN 7
Tabel R Untuk Uji Validitas
DF = n-2
Tingkat Signifikansi Untuk Uji 1 arah
0,05 0,025 0,001 0,005 0,0005
Tingkat Signifikansi Untuk Uji 2 arah
0,1 0,05 0,02 0,01 0,001
1 0,9877 0,9969 0,9995 0,9999 1,0000
2 0,9000 0,9500 0,9800 0,9900 0,9990
3 0,8054 0,8783 0,9343 0,9587 0,9911
4 0,7293 0,8114 0,8822 0,9172 0,9741
5 0,6694 0,7545 0,8329 0,8745 0,9509
6 0,6215 0,7067 0,7887 0,8343 0,9249
7 0,5822 0,6664 0,7498 0,7977 0,8983
8 0,5494 0,6319 0,7155 0,7646 0,8721
9 0,5214 0,6021 0,6851 0,7348 0,8470
10 0,4973 0,5760 0,6581 0,7079 0,8233
11 0,4762 0,5529 0,6339 0,6835 0,8010
12 0,4575 0,5324 0,6120 0,6614 0,7800
13 0,4409 0,5140 0,5923 0,6411 0,7604
14 0,4259 0,4973 0,5742 0,6226 0,7419
15 0,4124 0,4821 0,5577 0,6055 0,7247
16 0,4000 0,4683 0,5425 0,5897 0,7084
17 0,3887 0,4555 0,5285 0,5751 0,6932
18 0,3783 0,4438 0,5155 0,5614 0,6788
19 0,3687 0,4329 0,5034 0,5487 0,6652
20 0,3598 0,4227 0,4921 0,5368 0,6524
21 0,3515 0,4132 0,4815 0,5256 0,6402
22 0,3438 0,4044 0,4716 0,5151 0,6287
23 0,3365 0,3961 0,4622 0,5052 0,6178
24 0,3297 0,3882 0,4534 0,4958 0,6074
25 0,3233 0,3809 0,4451 0,4869 0,5974
26 0,3172 0,3739 0,4372 0,4785 0,5880
27 0,3115 0,3673 0,4297 0,4705 0,5790
28 0,3061 0,3610 0,4226 0,4629 0,5703
29 0,3009 0,3550 0,4158 0,4556 0,5620
30 0,2960 0,3494 0,4093 0,4487 0,5541
31 0,2913 0,3440 0,4032 0,4421 0,5465
32 0,2869 0,3388 0,3972 0,4357 0,5392
33 0,2826 0,3338 0,3916 0,4296 0,5322
34 0,2785 0,3291 0,3862 0,4238 0,5254