PAPER • OPEN ACCESS
A Spatial Approach to Identify Slum Areas in East
Wara Sub-Districts, South Sulawesi
To cite this article: W Anurogo et al 2017 IOP Conf. Ser.: Earth Environ. Sci.98 012030
View the article online for updates and enhancements.
Related content
Typology of Slum Management in Coastal Settlement as a Reference of
Neighborhood Planning in Konawe Santi, Ratna Bachrun and Kurniati Ornam
-Construction of the most suitable unbiased estimate distortions of radiation processes from remote sensing data
Iskakova Ayman
-Detecting land use dynamics, their impacts on natural hazards and vulnerability in the fast growing city of Santiago de Chile with high resolution remote sensing data and GIS
-1234567890
The 5th Geoinformation Science Symposium 2017 (GSS 2017) IOP Publishing IOP Conf. Series: Earth and Environmental Science 98 (2017) 012030 doi :10.1088/1755-1315/98/1/012030
A Spatial Approach to Identify Slum Areas in East Wara
Sub-Districts, South Sulawesi
W Anurogo
1*, M Z Lubis
1, D S Pamungkas
2, Hartono
3, F M Ibrahim
31 Geomatics Engineering, Politeknik Negeri Batam, Batam 29461, Indonesia
2 Electrical Engineering, Politeknik Negeri Batam, Batam 29461, Indonesia
3Faculty of Geography, Universitas Gadjah Mada, Sekip Utara, 55281 Yogyakarta, Indonesia
Abstract. Spatial approach is one of the main approaches of geography, its analysis emphasizes the existence of space that serves to accommodate human activities. The dynamic development of the city area brings many impacts to the urban community's own life patterns. The development of the city center which is the center of economic activity becomes the attraction for the community that can bring influence to the high flow of labor both from within the city itself and from outside the city area, thus causing the high flow of urbanization. Urbanization has caused an explosion in urban population and one implication is the occurrence of labor-clumping in major cities in Indonesia. Another impact of the high urbanization flow of cities is the problem of urban settlements. The more populations that come in the city, the worse the quality of the existing settlements in the city if not managed properly. This study aims to determine the location of slum areas in East Wara Sub-Districts using remote sensing technology tools and Geographic Information System (GIS). Parameters used to identify slum areas partially extracted using remote sensing data and for parameters that cannot be extracted using remote sensing data, information obtained from field surveys with information retrieval based on reference data. Analysis results for slum settlements taken from the parameters indicate that the East Wara Sub-District has the largest slum areas located in Pontap village. The village of Pontap has two classes of slums that are very shabby and slums. Slum classes are also in Surutangga Village. The result of the analysis shows that the slum settlement area has 46,324 Ha, which is only located in Pontap Village, whereas for the slum class are found in some villages of Pontap and Surutangga Urban Village, there are 37.797 Ha area. The class of slum settlement areas has the largest proportion of the area among other classes in East Wara Subdistrict. The class of slum settlement areas has an area of 74,481 Ha. This class is located in Kelurahan Salekoe and Kelurahan Benteng. The less grungy and quite shabby class is the rest which each has an area of 29,144 Ha and 18,228 Ha. There is quite a slum class in Kelurahan Ponjale and Less Slum Class Available in Malatunrung Urban Village.
Keywords: Spatial Approach, Remote Sensing, GIS, Slum Area
1.Introduction
Spatial approach is oneof the main approaches of geography, its analysis emphasizes the existence of space that serves to accommodate human activities [1]. The dynamic development of thecity area
brings many impacts to the urban community's own life patterns[2]The development of the city
city area, thus causing the high flow of urbanization. This is what causes the regional gap in Indonesia [4]. Urbanization has caused an explosion in urban population and one implication is the occurrence of labor-clumping in major cities in Indonesia. Another impact of the high urbanization flow of cities is the problem of urban settlements. The more populations that come in the city, the worse the quality of the existing settlements in the city if not managed properly [5]. Concentrated urbanization as described above, in addition to harming also have advantages. Some of the advantages are infrastructure equipment for the modernization of the cost becomes cheaper and faster economic development [6].
The high number of residents in the center of the city requires the fulfilment of the need for settlements that are habitable, especially to accommodate the urbanists whose work is concentrated in the trade and services sector in the commercial area in the city center. The availability of complete facilities and infrastructure in the center of the city has attracted people to settle in the area [7]. They need more shelter around the commercial area of the city, this is also possible because they approach the trading center to open a business by utilizing the crowd and crowded visitors who come to the shopping centers in the city. In addition, other reasons for the community are interested in residing in the vicinity of the downtown area as it facilitates workplace reach for those working in the city center, as well as meeting the needs of the residential communities that work in Central Business District (CBD) area of the city [8]. The availability of complete facilities and infrastructure in the city center is also the main attraction of the people to live in the area. A large number of immigrants in the area requires land to be settled [9]. The availability of available land does not match the number of people who come to the cause of the number of slums.
The urban deficiency with proper urban planning and management system, in anticipation of population growth with various motives and diversity, seems to be the main cause that triggers the emergence of settlement problems [10]. Fulfilment of the needs of infrastructure and settlement facilities both in terms of housing and neighbour-hoods affordable and decent settlement has not been fully provided by the community itself and the government. Thus, the carrying capacity of the existing settlement infrastructure and facilities begins to decline and will ultimately contribute to slum settlement.
Slum areas are defined as a residential area or non-residential area which is used as a residence whose buildings are substandard or inadequate inhabited by densely populated poor. The real area is not designated as a residential area in many large cities, by poor, low-income and non-permanent residents being resettled for residents, such as riverbanks, by railroads, the vacant land around factories or downtown, and under the bridge. Slums are inadequate settlements because they do not meet the requirements for both technical and non-technical occupancy [11]. A slum can be regarded as the embodiment of poverty, because in general in slums the poor life and many of us meet in urban areas. Poverty is one of the causes of the emergence of slums in urban areas. Basically, poverty can be overcome with high economic growth and equity, increased employment and the income of the poor and the improvement of basic services for the poor and the development of poverty reduction institutions. Improvement of basic services can be realized by increasing water supply, sanitation, provision and improvement of housing and residential environment in general [12].
Slums can be found in many major cities in the world. Slums are generally associated with high levels of poverty and unemployment. Slums can also be a source of social problems such as crime, drugs, and alcohol. In many poor countries, slums are also the center of health problems because of unhygienic conditions [13]. In slum areas, especially in poor countries, people live in very close proximity, making it very difficult to pass vehicles like ambulances and firefighters. The lack of garbage disposal services also resulted in the piles of garbage [14].
2.Methods
Research method is a step that must be done to complete the research objectives to be achieved. This research conducted to identify slums in East Wara Sub-District Palopo City. The research area in East Wara Sub-district Palopo City is geographically located between 2º53'15 "- 3º04'08" South Latitude and 120º03'10 "- 120º14'34" East Longitude. Palopo City as an autonomous region resulting from the expansion of Luwu regency, with boundaries:
1234567890
The 5th Geoinformation Science Symposium 2017 (GSS 2017) IOP Publishing IOP Conf. Series: Earth and Environmental Science 98 (2017) 012030 doi :10.1088/1755-1315/98/1/012030
b.East with the Bay of Bone
c.Southern borders with Bua District of Luwu Regency
d.West side bordering Tondon Nanggala Sub-district of Tana Toraja Regency.
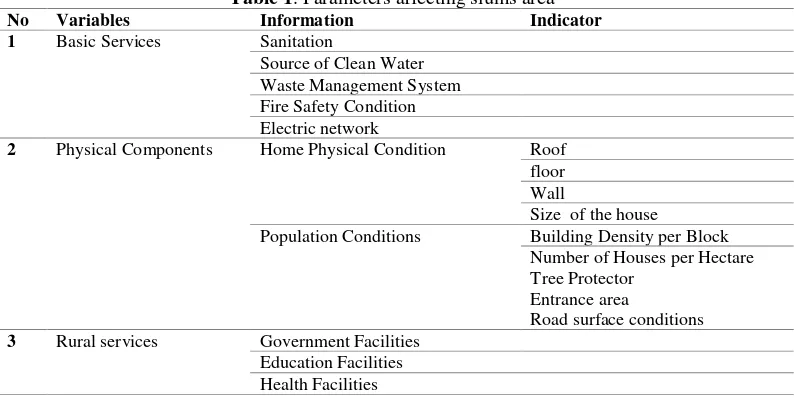
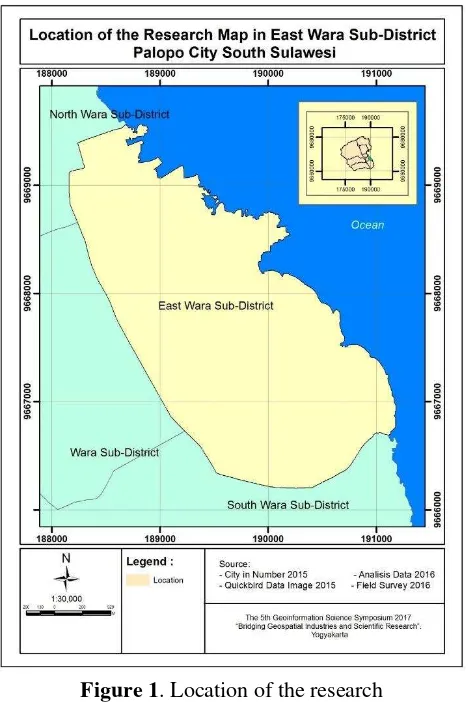
The total area of Palopo City administration is about 247.52 square kilometers or equal to 0.39% of the total area of South Sulawesi Province. Administratively Palopo City is divided into 9 districts and 48 urban villages. The Most of the East Wara Sub-District Palopo City which is the study area of research is a lowland area, in accordance with its existence as an area located on the coast. The location of the research is shown in figure 1. The method used in this study descriptive qualitative through spatial level is supported by questionnaires (learning structured and closed) to analyze the spread of slums in East Wara Sub-District Palopo City. The spatial approach will later be combined with data from relevant agencies relating to this research. In addition, it will be taken data by questionnaire by doing random sampling. Random Sampling is a sample taken from a population and each member of the population has equal opportunity to be selected as a sample [15]. This research uses remote sensing data tool to get various parameters which influence to slum settlement. Remote sensing data used in this study is the QuickBird high-resolution data. These high-resolution data are used to get parameters that affect slum settlements. The parameters affecting the slums are shown in table 1.
Table 1. Parameters affecting slums area
No Variables Information Indicator
1 Basic Services Sanitation
Source of Clean Water Waste Management System Fire Safety Condition Electric network
2 Physical Components Home Physical Condition Roof floor Wall
Size of the house
Population Conditions Building Density per Block Number of Houses per Hectare Tree Protector
Entrance area
Road surface conditions
Figure 1. Location of the research
1234567890
The 5th Geoinformation Science Symposium 2017 (GSS 2017) IOP Publishing IOP Conf. Series: Earth and Environmental Science 98 (2017) 012030 doi :10.1088/1755-1315/98/1/012030
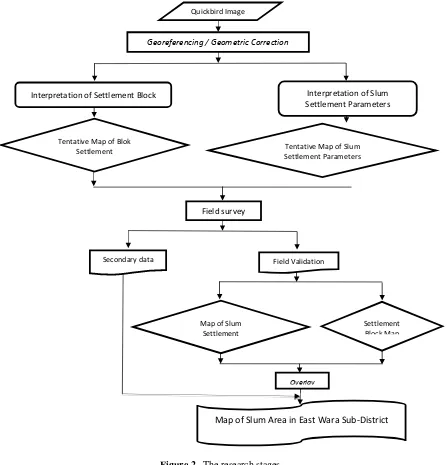
Figure 2. The research stages
In the pre-field activity consists of 3 parts, among others, data collection, reduction of land cover information and parameters that can be retrieved from the visual interpretation of visual images and the determination of samples used to retrieve information directly in the field of information that cannot be extracted from remote sensing data as well as data validation of extraction results from Quickbird images. Data collection phase consists of primary and secondary data collection process such as acquisition of google earth image, data collection of population density, education level data collection, health data collection and population economic data collection.
The phase of reduction of land cover information from google earth is done by identifying the land cover visually which will be classified into 2 classes namely settlement class and non-settlement class. The last stage is the determination of field samples. In the determination of this field sample using a random sampling method that provides equal opportunities or opportunities to all members of the population to be sampled. It is expected that the samples obtained are representative samples.
Field survey
Secondary data from government
Map of Slum Area in East Wara Sub-District Quickbird Image
Georeferencing / Geometric Correction
Interpretation of Settlement Block
Tentative Map of Blok Settlement
Interpretation of Slum Settlement Parameters
Field Validation
Tentative Map of Slum Settlement Parameters
Settlement Block Map Map of Slum
Settlement
Samples taken in this study represent the conditions of the slum settlement in the study area and the community. The research took a sample of 50 people with random sampling method.
Fieldwork is aimed at obtaining information on slum settlement parameters in the study area. Data measured during field activities provide physical conditions of the cultivation, social and economic conditions of the population. The way of data collection in the field is done by interview and questionnaire. Interviews were conducted to obtain information such as air circulation, solar lighting, health, garbage, flood frequency and drainage. While the questionnaire to obtain information in the form of education level, monthly income, work. The resulting analysis was conducted descriptively qualitatively based on the parameters of slum areas and public perception of slums. This parameter analysis is performed to identify the slum classes that exist in the study area based on predetermined parameters. The analysis of people's perceptions of slums is based on the results of the questionnaire and the interviews by comparing them with the slum-dwelling classes that had been previously produced.
A field survey was undertaken to obtain additional information to supplement the parameter data as well as to retrieve slum area information based on community perceptions. The field survey was conducted by visiting relevant agencies to obtain additional data, cross-check interpretation, and interviews or interviews with respondents.
Data collection methods in this study using a qualitative approach, by providing questionnaires to 60 respondents who are residents living in the settlement District East Wara Palopo City. Determination of the number of respondents was taken based on the interpretation of settlement blocks created as well as checks the interpretation of the settlement area. The result of the interpretation is that the residential area of Wara Timur sub-district is divided into 60 blocks of settlements with the assumption that each of the settlement blocks represents one class of area.
Additional information obtained in this field survey for additional information on physical parameters as well as for community perceptions. Additional physical information sought is information that cannot be derived from visual interpretations such as Sanitation, Clean Water Source, Waste Management System, Electricity and Fire Conditioning Conditions. Additional information will be used as additional input to determine the slum areas in the study area.
Poor environmental sanitation affects the sustainability of the existing environment. The lack of knowledge and understanding of the importance of healthy sanitation in healthy settlements is evident from the community's less friendly behaviour. This is marked by the existence of some people who do unhealthy lifestyles such as using the river as a means of toilets and clean water for the necessities of life, and the habit of disposing of household waste directly into the river that has potential as the cause of the spread of disease outbreaks.
Source of clean water is indirectly related to environmental sanitation. Poor sanitation causes the source of clean water to be poor or polluted causing the environment to become visibly shabby. People in the study area use a lot of water obtained from middlemen around "the tengkulak" or from PDAM because sanitation in their environment is bad so pollute the clean water source that is there. The emergence of slums in urban areas is a problem that is often faced by a number of major cities in Indonesia. The lack of provision of facilities and infrastructure in slums is generally dilator by the problems of the legality of settlements, resulting in the decreasing quality of the settlement environment. For example, with the unavailability of garbage facilities, the community will tend to contaminate the settlements with garbage so that waste generation will be piled up in every corner of the settlement.
Waste that is under the house, not continuously cleaned by residents or residents. Factors of altitude under the house, the physical properties of muddy soil and the back of the soil under a short time by the garbage that drifts the tide, which is the factor that inhibits the motivation of citizens to clean it up. The process of cleaning garbage under the house will generally be done if the individual or residents have sufficient time and energy, hot weather that supports and river water in certain receding conditions.
1234567890
The 5th Geoinformation Science Symposium 2017 (GSS 2017) IOP Publishing IOP Conf. Series: Earth and Environmental Science 98 (2017) 012030 doi :10.1088/1755-1315/98/1/012030
3.Results and Discussion
The data used to determine the distribution and extent of the settlement blocks that serve as the basis or mapping unit to find slum areas found in East Wara Sub-District Palopo City is Quickbird image data. The data is then done equation coordinates with coordinates that exist in the field with georeferencing process or better known as a geometric correction. Other data used in this research is public perception data about slum areas. The data is obtained from field surveys and/or data from relevant agencies in accordance with the theme of the study conducted. The geometric correction performed on this data is non-systematic geometric correction performed using a ground control point (GCP). Non-systematic geometric correction uses first-order polynomial algorithms because the physiographic conditions of the region are mostly terrain. Non-systematic geometric correction is performed by an image to image registration with reference to georeferencing image map using base map of RBI scale of 1: 25.000 which has been corrected, with Universal Transverse Mercator (UTM) projection system, WGS datum 1984. The study area included in zone 51 M. Zone M is south of the equator.
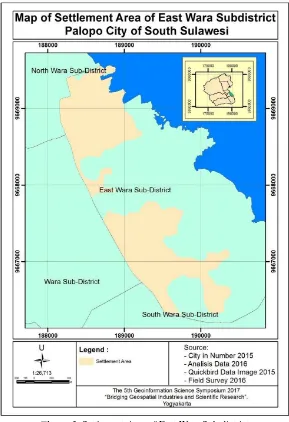
The data tapping activity is done by digitizing on the screen to restrict the existing settlement blocks in the research area. In the interpretation of the settlement block is done based on the physical appearance of the environment where the object identifier is the parameter of the quality of the settlement environment, such as the density of the building, the layout of the building, the width of the entrance, the condition of the road surface of the settlement, the road protector tree. Interpretation of each parameter is done by referring to the element or key interpretation. The location map of the settlement is obtained from the land use interpretation. The location of residential area is shown in figure 3.
Interpretation of the quality parameters of the settlement of the image is done by first doing some things as follows:
a. Determining the boundaries of settlements and non-settlement and distinguish between settlements as a residence with buildings as other functions such as offices and education. b. Mapping the boundaries of residential neighbour-hood units based on roadblocks as well as
differences in settlement characteristics that distinguish the research area.
The parameters used to assess excessive slum areas that can be extracted using high resolution remote sensing data are:
a. Density of Settlements
Figure 3. Settlement Area of East Wara Sub-district
Table 2. Classification of Weighted Density of Settlements
Criteria Classification Score
Rarely (density less than 40%) Good 3
Medium (density between 40% -60%) Medium 2
High (over 60% density) Bad 1
1234567890
The 5th Geoinformation Science Symposium 2017 (GSS 2017) IOP Publishing IOP Conf. Series: Earth and Environmental Science 98 (2017) 012030 doi :10.1088/1755-1315/98/1/012030
b. Settlement Layout Patterns
Assessment of settlement layout patterns related to slums can be seen from the regularity of the location, and the size of the building. Building settlements that have relatively the same size and its location follow a certain pattern, then the building will be grouped in units of the same settlement units. The layout of the settlement is calculated by comparing the number of structured buildings with the number of buildings in the settlement blocks. Weight classification level of settlement locations is shown in table 3.
Table 3. Weight Classification Level of Settlement Locations
Criteria Classification Score driveway on a settlement block. It also can work to reduce pollution caused by motor vehicle fumes.
Table 5.Street Shade TreesClassification
What is meant by the entrance is the road connecting the neighbour-hood road with the main road. The condition of the inlet surface is the hardening of the road surface distinguished by the hardening material based on a percentage of the asphalt roadway condition or cemented to the entire road. How to interpret it by noticing the hue on the object being observed. Classification of surface road conditions is shown in table 6.
Table 6.Classification of Surface Road Conditions
1234567890
The 5th Geoinformation Science Symposium 2017 (GSS 2017) IOP Publishing IOP Conf. Series: Earth and Environmental Science 98 (2017) 012030 doi :10.1088/1755-1315/98/1/012030
allowable outbreaks. If such a situation occurs in 35% of the area of course will give the impression of slum because of the developing area without good planning.
However, according to the public perception, the house is considered to have qualified provided that they can take shelter and can rest is considered sufficient. Especially for those who open the home industry crackers, the more residents either brothers or others who live in a house will benefit them because of their energy needed to help their business.
From the results of questionnaires conducted on the characteristics of incomes, the results obtained that this factor has a strong influence on the formation of slum conditions in East Wara Sub-District. Economically, with relatively low economic conditions, it is possible the ability of residents to realize the improvement of their residential environment is not possible. The need for sustainability, such as clothing and food, is the top priority of residents in allocating expenditures from the funding they earn.
From the results of the questionnaire analysis conducted on the status of residential ownership obtained results that this factor has a strong enough influence on the formation of slum areas. According to the community if a house with rent status most residents do not care about the conditions or conditions of occupancy that they rent. So, if there is damage to the dwelling, the residents do not care about it because it felt it was not his responsibility. The longer the occupancy is getting worse because it is not maintained. The results of field observations show that the number of immigrants in this area caused the number of residential homes that are rented, this would further increase the level of the slum area.
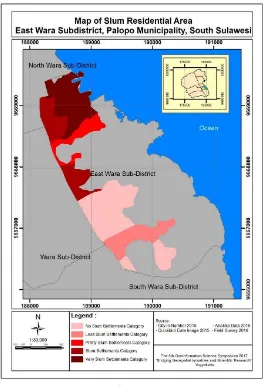
The long-lived factor is a factor that strongly affects the occurrence of slum area, this is the result of the analysis conducted on the perception of the population about the long-lived factors for residents. This is closely related to the previous factor of occupancy status factors, where many of the people living with rent status are factors that have a strong influence on slums. If those who rent a house for a long time or more than 5 years of age will not neglect their shelter maintenance, but many also rent a room for only a short time, usually their rental rate is per day. So, of course, that occupy the room or rental house is changing or not fixed. This is what causes the area to be a slum. The results of the analysis for slum settlements taken from the parameters show that the district of East Wara has the largest slum area located in Pontap village. The village of Pontap has two classes of slums: very slums and slums. Slum classes are also located in Surutangga Village. The result of the analysis shows that the slum settlement area has 46,324 Ha, which is only located in Pontap Village, while for the slum class is found in some villages of Pontap and Surutangga Subdistrict, there is 37.797 Ha area.
Figure 4. Map of Slum Residential Area
4. Conclusions
Analysis results for slum settlements taken from the parameters show that the district of East Wara has the largest slum area located in Pontap village. The village of Pontap has two classes of slums: very slums and slums. Slum classes are also located in Surutangga Village. The class of slum settlement areas has the largest proportion of the area among other classes in East Wara Subdistrict. The class of slum settlement areas has an area of 74,481 Ha. This class is located in Kelurahan Salekoe and Kelurahan Benteng. The less grungy and quite shabby class is the remainder which each has an area of 29,144 Ha and 18,228 Ha. Quite slum class is found in Kelurahan Ponjale and Less
Slum Class Available inMalatunrung Urban Village.
References
[1] Wesnawa, I. (2010). Dinamika Pemanfaatan Ruang Berbasis Kearifan Lokal di Kabupaten Buleleng Provinsi Bali.
[2] Muta'ali, L. (2002). Pola Perkembangan Karakteristik Kekotaan Pada Desa-Desa Di Propinsi Daerah Istimewa Yogyakarta. Majalah Geografi Indonesia, 16(2002).
1234567890
The 5th Geoinformation Science Symposium 2017 (GSS 2017) IOP Publishing IOP Conf. Series: Earth and Environmental Science 98 (2017) 012030 doi :10.1088/1755-1315/98/1/012030
[4] Wilonoyudho, S. (2009). Kesenjangan dalam Pembangunan Kewilayahan.
[5] Farizki, M., & Anurogo, W. (2017). Pemetaan kualitas permukiman dengan menggunakan penginderaan jauh dan SIG di kecamatan Batam kota, Batam. Majalah Geografi Indonesia, 31(1), 39-45.
[6] Atmajaya, J., & Jamli, A. (2014). Kontribusi Infrastruktur terhadap Pertumbuhan Ekonomi Sumatera Selatan (Doctoral dissertation, Universitas Gadjah Mada).
[7] Pigawati, B., & Rudiarto, I. (2011, December). Penggunaan Citra Satelit untuk Kajian Perkembangan Kawasan Permukiman Di Kota Semarang. In Forum Geografi (Vol. 25, No. 2, pp. 140-151).
[8] Anurogo, W., Lubis, M. Z., Hartono, H., Pamungkas, D. S., & Dilaga, A. P. Kajian Ketahanan Kawasan Wisata Berbasis Masyarakat Dalam Penguatan Ekonomi Lokal Serta Pelestarian Sumberdaya Kebudayaan Kawasan Kotagede Yogyakarta. Jurnal Ketahanan Nasional, 23(2), 114-136.
[9] Manning, C., & Effendi, T. N. (1985). Urbanisasi, pengangguran dan sektor informal di kota. Diterbitkan untuk Yayasan Obor Indonesia dan Pusat Penelitian dan Studi Kependudukan UGM [oleh] Gramedia.
[10] Campbell, S., & Fainstein, S. S. (2003). Readings in Planning Theory (Studies in Urban & Social Change).
[11] Berger, S. G., de Pee, S., Bloem, M. W., Halati, S., & Semba, R. D. (2008). Malnutrition and morbidity among children not reached by the national vitamin A capsule programme in urban slum areas of Indonesia. Public Health, 122(4), 371-378.
[12] Abate, G., Kogi-Makau, W., & Muroki, N. M. (2017). Child-feeding practices as predictors of nutritional status of children in a slum area in Addis Ababa, Ethiopia. The Ethiopian Journal of Health Development (EJHD), 13(3).
[13] Kanbur, R., & Sumner, A. (2012). Poor countries or poor people? Development assistance and the new geography of global poverty. Journal of International Development, 24(6), 686-695.
[14] Aziz, T. A., & Shawket, I. M. (2011). New strategy of upgrading slum areas in developing countries using vernacular trends to achieve a sustainable housing development. Energy Procedia, 6, 228-235.