IJG Vol. 49, No.2, December 2017 (118 - 124) © 2017 Faculty of Geography UGM and The Indonesian Geographers Association
Applying Remote Sensing Technology and Geographic
Information System in Batu, East Java
Rudi Hartono, and Nasikh
Received: September 2016/ Accepted: January 2017 / Published online: December 2017 © 2017 Faculty of Geography UGM and The Indonesian Geographers Association
Abstract This research is aimed to map potential landslide areas, identify types of landslide, and draw a map of
potential landslide level. This research was carried out in Batu, East Java. The research design that was used in the study was image interpretation of Landsat 7 Band 432 Satellite and primary data of the landslide causes (the data of soil and rocks, map interpretation, and variable scoring of landslide. ArcGis 9.3 and ArcView 3.2 software was used for map analysis. The researcher also analyzed the soil texture, permeability and land plasticity index, bedding, weathering level, the density of joints, the depth of weathering, the existence of springs, slopes, and slope cutting. The research findings showed that the image of Landsat 7 Bands 432 in 1:11.000 – 1:15.000 scale could be used to interpret land use and land cover. Interpreted land use included housing, bare soil, irrigated rice field, rain fed rice field, moor, nursery area, garden, slope failure, natural forest, sengon forest, pine forest, and agro forestry.
Keywords: landsat image, land units, landslide, potential landslide, map of potential landslide.
Abstrak Penelitian ini bertujuan untuk membuat peta potensi longsor lahan, mengidentifikasi tipe longsor, membuat
peta distribusi tingkat kerawanan longsor lahan. Penelitian ini dilakukan di wilayah Kota Batu, Jawa Timur. Metode penelitan yang dipilih yaitu: interpretasi digital citra satelit landsat 7 Band 432 serta data primer penyebab longsor berupa data tanah dan batuan, interpretasi peta-peta, dan pengharkatan (scoring) variabel-variabel longsor lahan. Software ArcGis 9.3 dan ArcView 3.2 digunakan dalam analisis peta. Pada penelitian survei ini dilakukan analisis terhadap: tekstur tanah, permeabilitas dan indeks plastisitas tanah, kemiringan perlapisan batuan, tingkat pelapukan, kerapatan kekar dan kedalaman pelapukan, keterdapatan mata air/ rembesan, kemiringan lereng, dan ada tidaknya pemotongan lereng. Hasil penelitian menunjukan Citra landsat 7 band 432 skala 1 : 11.000 – 1 : 15.000 dapat digunakan untuk menginterpretasi objek penggunaan lahan dan penutup lahan. Penggunaan lahan yang terinterpretasi antara lain: permukiman, tanah terbuka, sawah irigasi, sawah tadah hujan, tegalan, lahan pembititan, kebun , longsor lereng, hutan alam/campuran, hutan sengon, hutan pinus, dan hutan agroforestry.
Kata Kunci: citra landsat, satuan lahan, longsor lahan,potensi longsor, peta potensi longsor
1. Introduction
Landslide is land movement process, in which the soil moves vertically due to gravity-. The landslide can happen as the result- of heavy rain, steep slope, wea- thering,- variety of rock and geological structu-re,- and inappropriate land use [Malamud et al, 2004; Nasikh, 2016; Nasikh, 2017]. The landslide- usually occurs in the rainy season. As a result, its effect does not only happen on site, but also off site. The common effect of the landslide is huge number of sedimentation- [Serodio, 2005; Heru et al, 2014 ].
Basically, the landslide occurs as the result- of slope imbalance. The imbalance appears- as the result of internal and external forces of the slope [Chen, 2012; Anung and B.G.C.M [Bart, 2014]. External force of the
Rudi Hartono
Faculty of Social Science, Universitas Negeri Malang, Malang, Indonesia
Nasikh
Faculty of Economics, Universitas Negeri Malang, Malang, [email protected]
slope is influenced by the slope, water, and land use change. Internal force of the slope is affected by the physical characteristic of the land itself [Dwikornita et al, 2009; Amar, 2012]. Slope is an angle made by plains and hori-zontal- land which is measured in percentage or degrees. The steeper the land, the more possibility the landslide happens. Physical characteristics which influence the landslide are land contour, permeability, and soil plasticity index. Those- qualities are determined by the host rock itself [Nasikh, 2013; Sutanto, 2010; Yigang et al, 2015; Qian et al, 2015].
Potential landslide area mapping is a start to reduce the risk of landslide. Thus, the problem appearing in this study is how to map potential landslide area in Batu, East Java. This study is aimed to recognize at least four things. First, it is to identify how clear the image of
Landsat 7 Band 423 in 1:11.000 and 1:15.000 scale to
interpret the landslide variables in Batu, East Java. Second, it is to identify land unit type in Batu, East Java. Third, it is to map the landslide distribution in Batu, East Java. Last but not least, it is to identify how
ISSN 2354-9114 (online), ISSN 0024-9521 (print)
2. The Methods
This study was a descriptive survey ex-plaining-
about map interpretation process and Landsat 7 Band432
images to draw a map of potential landslide area. Labora-tory- test towards soil sample included texture,
permeability, and soil plasticity index- testing. Landsat7
Band 432 image interpretations used on-screen
interpretta-ti-ons,- in which the images were displayed- on computer screen and the manual interpretation- was carried out by analyzing- the print out. The landslide potential was scored based on the land unit and the characteristic of ten landslide variables-. Those ten landslide variables were soil texture, permeability, soil plasticity index,- bedding, weathering level, density of joints, depth of weathering, and existen-ce- of springs, slopes, and slope cuting-. The table 1-11 shows the scoring of each landslide variable.
Table 1. Soil Texture
Soil texture Score
Sand 1
Sandy loam, loamy sand 2
Loam, clay loam, sandy loam 3
Clay, sandy clay, sandy loam 4
Source: Lallianthanga, 2014
Table 2. Soil Permeability
Soil Permeability
Coefficient Category Score
(cm/ hour)
≥ 6,5 High-very high 1
2 - 6,5 Average 2
0,5 - 2,0 Low 3
< 0,5 Very low 4
Source: USDA, 1994
Table 3. Plasticity Index
Liquid Limit (%) Score
≤ 11 1
11 - ≤ 18 2
18 - ≤ 30 3
≥ 30 4
Source: Andayani et al, 2008
Table 4. Bedding
Bedding Category Score
Horizontal, straight, tilt in plain-sloped land (0-8%) Good 1
Unstructured in steep slope (20%), sloping in sloped land
Fair 2
(8-14%)
Tilt in hard and straight bedding in sloping land (8-20%) Poor 3
Tilt in soft and straight bedding in sloping land (>2 0%) Very poor 4
Source: Cranfield et al, 2006
Table 5. Weathering
Weathering Criteria Category Score
No weathering, rock crystal Fresh-unweathered 1
The weathering process occurs in the open discontinuity
Lightly weathered 2
which causes color version
Less than a half of the material decom-pos-ed- and or
disinte-Weathered 3
grated into the soil; the center of the rock is till fresh More than a half of the material decomposed- and or
Heavily weathered 4
RBI Map Landsat Slope Map Soil Texture Land Use Map
1:25.000 Band 432 Map
image
Administrative Map
Field testing
Interpreting and Overlaying
Land Unit Temporary Map
Interpretation testing sample and soil sample
Slope, slope Soil texture Bedding, weathering, Springs cutting and density of joint and
leakage
Scoring
Temporary Landslide Potential
Re-interpretation
Landslide Distribution Map
Landslide Potential Map
Figure 1. The Flowchart of Research Process
Table 6. Weathering Intensity
Depth (cm) Category Score
≤ 50 Shallow 1
50- ≤ 75 Shallow enough 2
75- ≤100 Fair 3
≥100 Deep-Very deep 4
Source: Zuidam, 1979
Table 8. Slope
Slope Category Score
0– 7% Sloped 1
8– 20% Wavy 2
20 – 55% Steep 3
≥56% Very steep 4
Source: Zuidam, 1979
Table 7. Existence of Springs
The Existence of Springs per Ha Score
No spring 1
1-2 springs 2
>2 springs 3
Leakage paths 4
Source: Holland, 1992
Table 9. Slope Cutting and Excavation
Depth and Excavation Location Score
No excavation 1
Shallow in the peak/upper slope or fair in 2 the peak
Shallow in lower slope/valley or deep in
3 the peak/upper slope
Deep in lower slope/valey 4
≤ ≤ ≤
≥ ≥
Table 10. Density of joints Distance between Joint
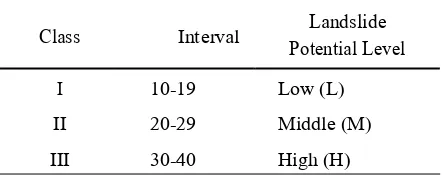
To determine the landslide potential, there are ten variables used. The lowest potential is scored 10, while the highest one is 40. The landslide potential is classified into three classes. The interval of each class is determined by using formula.
In which:
I: Class interval of landslide potential
level R: The highest – lowest landslide
potential N: The number of potential class
Based on the formula above, it is revealed that the class interval of landslide potential is:
Based on the class interval, the classification of landslide potential level is Table 11.
Table 11. Criteria of Landslide Potential Level
Class Interval Potential LevelLandslide
I 10-19 Low (L)
II 20-29 Middle (M)
III 30-40 High (H)
Source: The Researcher’s Calculation
3. Results and Discussion
The Landsat 7 Band 432 images interpretation in
the research object
As it has been mentioned above, the Landsat 7
Band 432 image interpretation was carried out on-screen
by displaying them on computer screen as well as interpreting- the print out. The interprettation- process
used eight components of interpretation. They were colors, textures, shapes, patterns, height, shadows, and object site and image association. The images- were in some varieties of scales, from 1:11.000 up to 1:15.000. The images were recorded on November
31st 2012. Thus, it could be concluded that there was a
few change in land cover up to now.
The researcher chose Band 432 combina-tion- due to
its visible appearance. It appeared- at panchromatic
spectrum, so the images’ appearances and colors were
pretty similar to the real objects.
The process of image correction used geometric- correction. It was carried out by choosing four objects in the image and seeking those particular objects in the field. After that, the coordinates of those objects were recorded and plotted in earth map in 1:25.000 scales. Therefore, the coordi-nates of the images had been attached- to the map coordinate. Those processes- were carried out by using ArcView 3.2 software in coordinate transform- register menu. In the register process, the result was appeared RMS (Root Mean Square) error. It pointed to 0.71, which meant that the image coordi-nate was allowed to be used.
Based on the Landsat 7 Band 432 image
interpretation, it was revealed that land use variable and land cover were two variables which directly seen in the images. It was concluded that those two variables were the easiest variable interpre-ted-. Another easiest variable interpreted- was relief pattern; due to its association with land use. From the relief pattern, it appeared river branch pattern. The pattern could be clearly seen because the rivers were also clearly appeared in the image. The soil color and texture were also interpreted. After that, it was delineated (making borders) in the land units. The land unit was used as the landslide potential measurement unit [Sutanto. 2010; Amar, 2012; Adewuyi. 2009].
The image interpretation was limited to object interpretation, in which it was the landslide variables themselves. These were: (1) land use and vegetation cover type, (2) slopes, (3) river pattern and flow density, (4) soil color, and (5) appearance of rock structure and land contour. Therefore, it could be concluded that from the ten variables mentioned in the re-search method, only five variables interpreted. Land texture, soil plasticity index, and land permeability were tested in laboratory. The depth of weathering and slope cutting was investigated directly in the field.
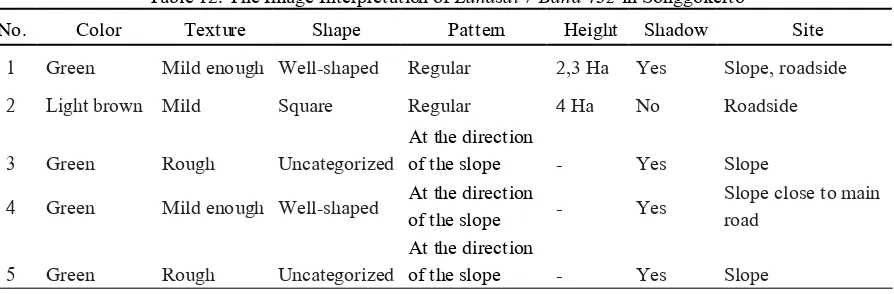
The table 12. shows the land use and land cover interpretation in Songgokerto, Batu with coordinate
665734 S and 9129209 E. According to theLandsat 7
Band 432 image interpretation, the interpreted land
use objects were: 1) housing, 2) bare soil, 3) irrigated
ricefield, 4) rain fed rice field, 5) moor, 6) nursery
Table 12. The Image Interpretation of Landsat 7 Band 432 in Songgokerto
No. Color Texture Shape Pattern Height Shadow Site
1 Green Mild enough Well-shaped Regular 2,3 Ha Yes Slope, roadside
2 Light brown Mild Square Regular 4 Ha No Roadside
3 Green Rough Uncategorized
At the direction
- Yes Slope
of the slope
4 Green Mild enough Well-shaped At the directionof the slope - Yes Slope close to mainroad
5 Green Rough Uncategorized
At the direction
- Yes Slope
of the slope Source: Result of Data Processing, 2013
The Distribution of Landslide Potential
Based on the map analysis using intersect techni-- que in the geoprocessing and layers overlay,- it was concluded that there were 46 land units from the combination of 7 land shapes- and land use. The 46 land units consisted of 9 units of volcanic slope (V7), 13 units of Fluvial plains (F5), 6 units of tuff lava deposition (V5), 7 units of plains between mountains (D6), 5 units of lower volcanic slope (V4), 4 units of middle volcanic slope (V3) and 2 units of upper volcanic slope (V2).
According to the map overlay analysis and
Landsat 7 Band 432 image interpretta-tions,- it could
be concluded that there was no rela-tionship- between land use and land shape. For example: forests were not always in V2, V3, or V4; forests could also be found in F5 and V7. Based on the scoring of the landslide variables, it was revealed that 12 units of land units were in low potency of landslide, 30 units of land units were in fair potency of landslide,- and 4 units of land units were in high potency of landslide.
High potency of landslide was in V3 that was used for rice fields, gardens, and moors as well as V2 that was used for forest area. The width of the area
was 39, 7556 Km2 or 19.97% of the width of Batu.
The middle volcanic slope’s land shape was spread in
the west part of Batu, which were west Songgokerto, Punten, Gu-- nungsari and west Tulungrejo, west Pandesari, and west Pesanggrahan. Most of the land was used as forests, but not all of the, were
well-conserved. Teras bangku became the most common
conversation- in this area. However, there were some forests cut and the land was not farmed.
According to the observation and measu-rement,- the type of landslide in Gunungsari- village was debris fall. There was no exposed host rock in the land shape, so there- were no impermeable layers which became- the slip plane. The landslide occurred in slope with 36 degree. There were no shrubs in the forest because most
of them were cut. The width of slope failure was 45 m2.
A landslide in Batu-Pujon main road occurred
slide type, in which the layers of andesite rocks under- neath the road became the slip plane. The slope was
56 degree—which was categorized- as steep slope.
The effect of this landslide- was a half of the road disappeared 9 meters.
Mud-flow was found in Bulukerto village (the village was categorized as V4). The mud-flow appeared due to heavy rain and its slope was pointed at 16 degree. There was no water in dry season. The land was used as apple and oranges garden [Andayani, et al, 2008; Heru, et al, 2014].
Mid potential landslide was 128, 7574 km2 or about 64, 68% of Batu width. The potency of landslide- was in V5-Tg, V5-Kb, D6-Pk, V4-Pk, V3-Pk, V7-Kb, V7-Sw, V7-Tg, and V2-Ht. Villages- in this area were Bumiaji, Pandanrejo, Sidomulyo, Bulukerto, Sumbergondo, Sisir, Temas, Songgokerto, Beji, Torongrejo, Giripurno, Ngaglik, Sumberejo, a little part of Oro-oro Ombo, Pesanggrahan, Junrejo, Torongrejo,- Pendem, Beji, Mojorejo, Dadaprejo, and Tlekung.
Low potential landslide occurred in D6 which was used as housing, D5 that was used as housing, moor, garden, and bare soil. Villages in this area were west Pandesari, middle Tulungrejo, and south Sidomulyo. The width of low potential landslide was
30, 5745 Km2 or 15, 35% of the width of Batu.
4. Conclusion
Acknowledgement
The researcher would like to thank to DRPM Ministry of Research, Technology and Higher Education Indonesia who support the research by allocating some funds, the Rector of Universitas Negeri Malang who has gave chance to him to accomplish the research, the Head of LP2M of Universitas Negeri Malang and all reviewers who gave feedbacks and critics, lecturers and laboratory assistants of Department of Geographic, Faculty of Social Science and Department of Economics Development, Faculty of Economics, Universitas Negeri Malang, all students of Department of Geographic and Department of Economics Development who involved in the research, and all people that he cannot possibly mentioned one by one.
References
Adewuyi Taiye Oluwafemi. (2009). Land Degradation Assessment, in the Peri-Urban Area of Kaduna Metropolis, Nigeria. Indonesian Journal of Geography. ISSN 0024 -9521 IJG Vol. 41 No 1, June 2009. Page 37-51. © 2009. Faculty of Geography UGM and The Indonesian Geographers Association.
Amar. (2012). Land Use Model for Building Based on Carrying Capacity of City Land (Case Study Palu City). Indonesian Journal of Geography. ISSN 0024 -9521 IJG Vol. 44 No 2, December 2012. Page 185-186. © 2012 Faculty of Geography UGM and The Indonesian Geographers Association Andayani, B., Dwikornita Karnawati, & Pramumijoyo,
S. (2008). Institutional frame work for community empowerment towards landslide mitigation and risk reduction in Indonesia. Proc. of the 1st
Anung Kurniawan, B.G.C.M (Bart) Krol. (2014). Spatio Temporal Analysis of Land Use Change
for Supporting Landslide Exposure Assessment.
Indonesian Journal of Geography. ISSN 0024 -9521 IJG Vol. 46 No 2, December 2014. Page 104-124. © 2014 Faculty of Geography UGM
and The Indonesian Geographers Association.
Chen, C. Y. (2012). Landslide and self-organized criticality in the Lushan hot spring area. Journal
of Mountain Science, 9 (4), 463–471.
Chen, C. Y., Yu, F. C., Lin, S. C., & Cheung, K. W. (2007). Discussion of landslide self-organized criticality and the initiation of debris flow. Earth Surface Processes and Landform, 32, 197–209.CrossRef.
Cranfield, L.C., Grayson, R.G. and Tuttle, J.S.
(compilers). (2006). Slope stability on basalt
plateaux in southeast Queensland (a series of
reports on constraints to closer development and an ARCGIS and MAPINFO GIS version), Department of Natural Resources, Mines and Water, Brisbane.
Dackombe, Roger V. and Gardiner V. (1983). Geomorphological Field Manual. Allen and
Unwin Press. London.
Dwikornita,Karnawati, T. F. Fathani, B. Andayani, P. W. Burton & I. Sudarno. (2009). Strategic program for landslide disaster risk reduction: a lesson learned from Central Java, Indonesia. WIT Transactions on The Built Environment, Vol 110. www.witpress. com, ISSN 1743-3509 (on-line). Page: 115-125.
doi:10.2495/DMAN090121WIT Press.
Heru Setiawan, Nanette C. Kingma, C.J. van Westen. (2014). Analysis Community’s Coping Strategies and Local Risk Governance Framework in Relation to Landslide. Indonesian Journal of Geography. ISSN
0024 -9521 IJG Vol. 46 No 2, December 2014. Page 143-155. © 2014 Faculty of Geography UGM and The Indonesian Geographers Association
Holland, J. H. (1992). Adaptation in Natural and Artificial Systems, 2nd ed. Cambridge, MA: MIT Press.
Lallianthanga, R.K.and F. Lalbiakmawia. (2014).
Landslide Susceptibility Zonation of Kolasib District, Mizoram, India Using Remote Sensing And GIS Techniques International Journal of Engineering Sciences & Research Technology
Vol 3 No 3 march 2014. http: // www.ijesrt.com
(C),International Journal of Engineering
Sciences & Research Technology [1402-1410] .
Malamud, B. D., Turcotte, D. L., Guzzetti, F., & Reichenbach, P. (2004). Landslide inventories and their statistical properties. Earth Surface Processes
and Landforms, 29, 687–711.CrossRef.
Nasikh, (2013). A Model of Collaborative Forest Resources Management to Improve the Prosperity of Poor Family Farmers in East Java. Indonesian Journal of Geography. ISSN 0024 -9521 IJG Vol. 45 No 1, June 2013. Page 80-89. © 2014 Faculty of Geography UGM and The
Indonesian Geographers Association.
Nasikh. (2016). Developing Ecotourism as an Attempt to Improve The Competitiveness in The Economic Globalization Era in Banyuwangi Regency, East Java Province. International Journal of Economic Research pages: 2735-2750 Volume No. 13(2016)
Issue No. 7(2016), DOI: URL:http://www.
serialsjournals.com/serialjournalmanager/pdf/
1482138461.pdf.
Nasikh. (2017). Institutional Model and Activitiesof Destitute Society Around Forest as an Attempt to Develop the Sustainable and Equitable Forest in East Java, Indonesia. Periodica Polytechnica Social and Management Sciences.Period.Polytech. Soc. Man. Sci., Vol. 25, No. 1 (2017), pp. 8-16. DOI:
10.3311/PPso.8536 URL. https://pp.bme.hu/so/
Qian Y, Tang L, Qiu Q, Xu T, Liao J. (2015). A Com- parative Analysis on Assessment of Land Carrying Capacity with Ecological Footprint Analysis and Index System Method. PLoS ONE
10(6): e0130315. https://doi.org/10.1371/journal.
pone.0130315.
Serodio, Y. (2005). Currumbin landslip, emergency
test for disaster system, Emergency Magazine
August 2005, pp. 14-17.
Sutanto. (2010). Remote Sensing Research,a User’s
Perspective. Indonesian Journal of Geography. ISSN 0024 -9521 IJG Vol. 42 No 1, June 2010. Page 129-142. © 2010 Faculty of Geography UGM and The Indonesian Geographers Association. USDA. (1994). Chapter 26 Gradation Design of Sand
and Gravel Filters Part 633 National Engineering Handbook The United States Department of Agriculture (USDA) Natural Resources
Conservation Service.
Yigang Wei, Cui Huang , Patrick T. I. Lam, Yong Sha &Yong Feng. (2015). Using Urban-Carrying Capacity as a Benchmark for Sustainable Urban Development: An Empirical Study of Beijing. Sustainability 2015, 7, 3244-3268. doi:10.3390 /su7033244. ISSN 2071-1050.
http//www.mdpi.com/journal/sustainability
Zuidam, Cancelado. (1979). Terrain Analysis and
Classification Using Aerial Photographs.