IJG Vol. 47, No.1, June 2015 (20 - 25) © 2015 Faculty of Geography UGM and he Indonesian Geographers Association
Relationships between Sea Surface Temperature (SST) and rainfall
distribution pattern in South-Central Java, Indonesia
Bayu Dwi Apri Nugroho
Received: 02 01 2015 / Accepted: 16 01 2015 / Published online: 30 07 2015 © 2015 Faculty of Geography UGM and he Indonesian Geographers Association
Abstract Although there has been a high relationship between global climate and rainfall in Indonesia, little evidence is available for relationship between Sea Surface Temperature (SST) and rainfall pattern in highland of country. his study evaluates the relationships between Sea Surface Temperature (SST) and rainfall distribution pattern in Gunungkidul dis-trict, highland of South-Central Java, Indonesia. Principal Component Analysis (PCA) approach was used to summarize the average of SSTs during rainy season (October to March) for the El Niño monitoring regions: IOBW (Indian Ocean Basin-Wide), Niño.West and Niño.3. Monthly rainfall data was collected from Agricultural Government of Gunungk-idul district. In this area, rainfall was highest in the southern and western mountainous areas, especially near the coast, and SSTs values were highly correlated with rainfall in those areas. Almost all sub districts in Gunungkidul district has signiicant correlations between PC1 SSTs and rainfall during October-November-December (OND).
Abstrak Meskipun telah ada hubungan yang tinggi antara iklim global dan curah hujan di Indonesia, sedikit bukti yang tersedia untuk hubungan antara Sea Surface Temperature (SST) dan pola curah hujan di dataran tinggi negara. Studi ini mengevaluasi hubungan antara Suhu Permukaan Laut (SST) dan pola distribusi curah hujan di Kabupaten Gunungkidul, dataran tinggi Jawa Tengah bagian selatan, Indonesia. Principal Component Analysis (PCA) pendekatan yang digunakan untuk meringkas rata-rata SPL selama musim hujan (Oktober-Maret) untuk wilayah pemantauan El Niño: IOBW (Indian Ocean Basin-lebar), Niño.West dan Niño.3. Data curah hujan bulanan dikumpulkan dari Pemerintah Pertanian Kabupat-en Gunungkidul. Di daerah ini, curah hujan tertinggi di daerah pegunungan selatan dan barat, terutama di dekat pantai, dan nilai-nilai SPL yang sangat berkorelasi dengan curah hujan di daerah tersebut. Hampir semua kecamatan di Kabupat-en Gunungkidul memiliki korelasi yang signiikan antara PC1 SST dan curah hujan selama Oktober-November-Desember (OND).
Keywords: rainfall, Gunungkidul, Sea Surface Temperatur (STT)
Kata kunci: curah hujan, Gunungkidul, Suhu Permukaan Laut
In Indonesia, rainfall distribution pattern correlates with global climate indices, such as the sea surface temperature (SST) [Saji et al., 1999]. SST luctuations are most pronounced around Indonesia and in the nearby tropical Paciic [Trenberth and Shea, 1987; Trenberth and Hoar, 1996]. Nicholls [1981, 1984] showed that surface pressure at Darwin, northern Australia and SST around Indonesia could be used to predict Indonesian climate variations and Indonesian rainfall. Kirono and Tapper [1999] found that rainfall from June to November was positively correlated with the SST from 1951 to 1997, and that the relationship was particularly strong in South-Central Java, which 70 % areas in those areas is highland areas.
Highland areas are more afected by rainfall variability because of the topographical characteristics of these areas [Haylock and McBride, 2001]. Precipitation Bayu Dwi Apri Nugroho
Department of Agricultural Engineering, Faculty of Agricultural Technology,Universitas Gadjah Mada, Indonesia.
Email: [email protected]
patterns are afected by both topography and air mass conditions on the windward side of mountains [Anders et al., 2006]. In monsoon areas, the direction of the prevailing winds may have a pronounced efect on the distribution of very high amounts of rainfall [Singh and Kumar, 1997], causing the spatial distribution of rainfall to vary seasonally. In Indonesia, investigated by Hamada et al. [2008] that rainfall and wind speed are greater on the windward side than on leeward side of the mountains of western Sumatera and suggested that surface topography plays a role in determining the rainfall distribution not only in Sumatera but also in and around the entire Indonesian archipelago.
herefore, the aim of this study was to clarify the causes of the observed rainfall distribution pattern in the highlands of South-Central Java, and to examine how rainfall was related to Sea Surface Temperature (SST) during the rainy season from 1981 to 2009.
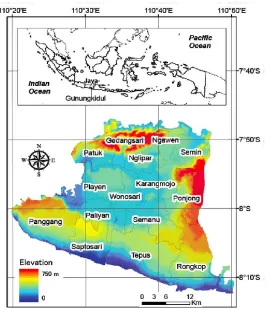
Indonesian Journal of Geography, Vol. 47 No. 1, June 2015 : 20 - 25 7°09’S, 110°21’–110°50’E), a highland area in
South-Central Java, bordering the Indian Ocean. his area of 1485.36 km2 is divided into 18 subdistricts and includes 144 villages (www.gunungkidulkab.go.id; accessed 5 December 2011). he district can be divided into three areas according to elevation: the northern part ranges between 200 and 700 m above sea level (a.s.l.); the central lowland area is at 150–200 m a.s.l.; and the southern area is hilly with elevations from 0 to 300 m a.s.l. (Figure .1). he mean annual rainfall in the district during 1981–2009 was 2041 mm. On average, the rainy and dry periods each last for 4 to 6 months [ASFCH, 2009].
2. he Methods
Rainfall data from 1981 to 2009 was collected from twelve stations [ASFCH, 2009]. We used data from 12 of the 18 rainfall observation stations from which adequate data were available. hen, three analyses of distribution pattern were observed, six month (October to March), OND (October-November-December) and JFM (January-February-March) analyses. OND and JFM analyses were conducted because representing the beginning and the peak of rainy season.
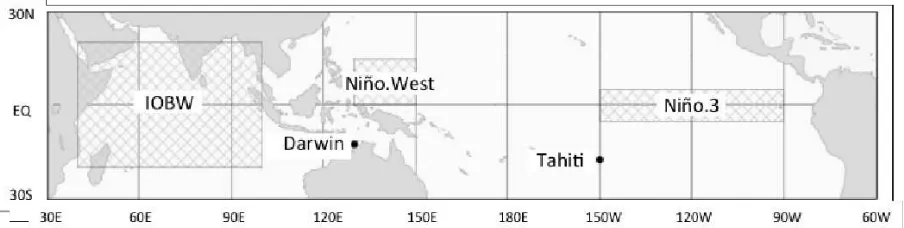
SSTs from 1981 to 2009 were used to represent global climate indices for this study. Monthly averaged SSTs of the El Niño monitoring region (Figure 2): Niño. West (15°N–0°, 130°E–150°E), the Indian Ocean
Basin-wide (IOBW; 20°N–20°S, 40°E–100°E) and Niño 3.4 (50N-50S, 1200-1700E) regions were acquired from the NASA. We used JR-25 re-analysis data [Onogi et al., 2007] to analyze normal (i.e., the 26-year mean from 1979 to 2004) speciic humidity (kg/kg), wind direction, and wind speed in January at 850 hPa at Java Island to represent the wind direction during rainy season.
For the analysis, at irst, we recalculated the values of SSTs by averaging their 3-months (October-November-December (OND) and January-February-March (JFM)) and 6-month values for each rainy season (October to March). he SSTs from Nino3.4, Nino.West and IOBW were integrated using Principal Component Analysis (PCA) to enable direct comparisons SST and rainfall data. For this study, only principal components (PCs) having at least 70% of cumulative proportion of variance were used in correlation analysis with other data [Bayu et al., 2013].
3. Results and Discussion
Table 1 shows PC loadings and its statistical variances. he irst PC (PC1) of IOBW and Niño.3 shows positive loadings meaning that the SSTs from those two regions were in phase. he contrast between Niño.3 and Niño.West shows that the PC1 strongly links with El Niño and/ or La Niña events. For this study, only PC1 was used to represent the SSTs for the three regions as its cumulative proportion exceeded 70% of the total
variance (value in bold). Figure 3 shows the original global climate indices and the resulted PC1 from the SSTs. he El Niño in 1998 was distinctly indicated in this igure 3.
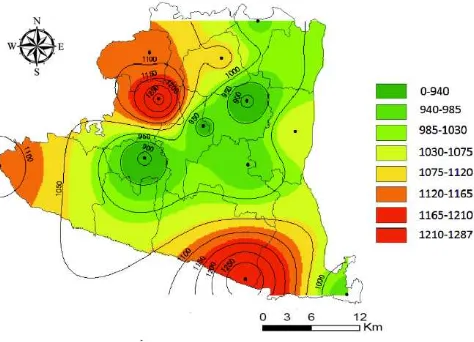
We analyzed the rainfall distribution from 1981 to 2009 using data for the entire 6 months of the rainy season and separately for OND and JFM (Figure. 4). Overall during the rainy season, rainfall ranged from 1800 to 2200 mm in the southern coastal and western inland areas, and around 1500–1600 mm of rain fell in
the central lowland and northern areas (Figure. 4a). During the early rainy season (OND), rainfall was 750–900 mm in the southern coastal areas and 500–600 mm in the central lowland area (Figure. 4b), and the highest amounts of rainfall occurred during the late rainy season (JFM, Figure. 4c). During the rainy season, especially at its peak in January, westerly winds bring moisture from the Indian Ocean to Java (Figure. 5), and this moisture carried by the winds produces dense clouds and orographic precipitation [Roe, 2005] along
Figure 2. he three El Niño monitoring regions (shaded regions) used to observe the relationships among SSTs in the eastern (Niño.3), the western Paciic (Niño.West), and Indian Ocean (IOBW).
Table 1. Principal components loadings and their importance of components for each PC against the SSTs (Niño.3, Niño.West and IOBW)
Indonesian Journal of Geography, Vol. 47 No. 1, June 2015 : 20 - 25 the mountain ranges of southern and western Java.
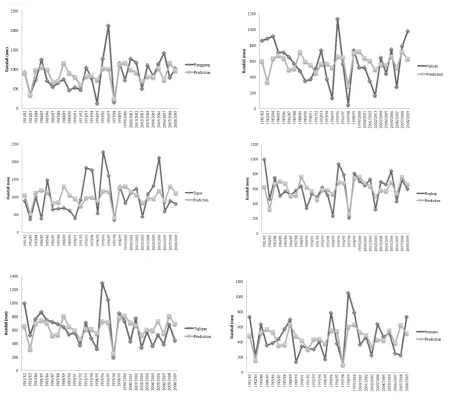
We compared PC1 of SSTs and the average rainfall from 1981 to 2009 in three analyses: October to March (six month), as rainy season in those areas, then October-November-December (OND) as the beginning of rainy season, and January-February-March (JFM) as the last of rainy season. he result shows all of sub districts in Gunungkidul district have signiicant correlations between SSTs and average rainfall in OND. he detail of the result can be seen in the Table 2.
PC1 shows negative correlation with rainfall OND in Panggang, Paliyan, Nglipar, Tepus, Playen, Rongkop, Semanu, Karangmojo, Wonosari and Ponjong he relationships between these residuals and PC1 were found as
Yr (i) = -255.22*PC1(i) + 5303.4 for Panggang (1)
Yr (i) = -118.91*PC1(i) + 2649.5 for Paliyan (2)
Yr (i) = -248.79*PC1(i) + 5344.8 for Tepus (3)
Yr (i) = -138.27*PC1(i) + 3009.8 for Rongko (4)
Yr (i) = -152.47*PC1(i) + 3285.8 for Nglipar (5)
Yr (i) = -146.18*PC1(i) + 3001.2 for Seman (6)
Yr (i) = -253.09*PC1(i) + 5156.3 for Playen (7)
Yr (i) = -222.70*PC1(i) + 4497.7 for Wonosari (8)
Yr (i) = -112.65*PC1(i) + 2659.9 for Karangmojo (9)
Yr (i) = -110.03*PC1(i) + 2568.0 for Ponjong (10) And for rainfall (yr).
Figure 4a. Rainfall distribution pattern of Gunungk-idul district during the rainy season (October-March)
from 1981 to 2009
Figure 4b. Rainfall distribution pattern of Gunungkid-ul district during the period
October-November-De-cember (OND) from 1981 to 2009
Figure 4c. Rainfall distribution pattern of Gunungkidul district during the period January-February-March (JFM) from 1981 to
Indonesian Journal of Geography, Vol. 47 No. 1, June 2015 : 20 - 25 In this study, we have revealed significant
relationships between Sea Surface Temperature (SST) and rainfall distribution pattern in highland of South-Central Java. Variations in rainfall during the rainy season in rain-fed agricultural areas in the highlands of southern Java were significantly related to variations in the SST global climate indices. In some subdistricts in the coastal and western parts of the study area, the variations in rainfall during the rainy season were also significantly correlated with the SOI and with SST Niño. West, Niño.3 and IOBW.
Average values of the indices SSTs were correlated with rainfall in the southern and western mountainous areas of the district; coastal areas in particular received more rainfall than inland areas. Also PC1 of SSTs has significant correlation with OND rainfall in almost all sub districts at Gunungkidul district. Thus, in the future, the relationships between rainfall variations and more global climate indices, such as Sothern Oscillation Index (SOI), Indian Ocean Dipole (IOD) in not only southern Java but also all of Indonesia need to be examined.
Our methods to analysis the relationships between Sea Surface Temperature and rainfall distribution pattern in highland area may apply to areas with