AD Auto disable
AEFI Adverse events following immunization
AFP Acute flaccid paralysis
BCG Bacillus Calmette-Guérin vaccine
CES Coverage evaluation survey
cMYP Comprehensive multi-year plan
CRS Congenital rubella syndrome
DHS Demographic health survey
DT Diphtheria tetanus toxoid, pediatric
DTP Diphtheria – tetanus – pertussis vaccine
DTP3 3rd dose DTP
DTP-Hib-HepB Pentavalent vaccine
DTP-Hib-HepB3 3rd dose pentavalent vaccine
EPI Expanded Programme on Immunization
GDP Gross domestic product
HCW Health care worker
HepB Hepatitis B vaccine
HepB3 3rd dose HepB
Hib Haemophilus influenzae type B vaccine
HPV Human papilloma virus vaccine
IgM Immunoglobulin M
IPV Inactivated poliovirus vaccine
JE Japanese encephalitis
JE_Live-Atd JE live attenuated vaccine
JRF WHO UNICEF Joint Reporting Form
LB Live birth
M Measles
Acronyms
MCV1 First dose MCV
MCV2 Second dose MCV
MICS Multiple indicator cluster survey
MMR Measles mumps rubella vaccine
MNT Maternal and neonatal tetanus
MR Measles rubella vaccine
NCIP National committee on immunization practices
NID National immunization day
NTAGI National technical advisory group on immunization
NT Neonatal tetanus
OPV Oral poliovirus vaccine
OPV3 3rd dose OPV
bOPV Bivalent OPV
tOPV Trivalent OPV
PCV Pneumococcal conjugate vaccine
SEAR WHO South-East Asia Region
SEARO WHO South-East Asia Regional Office
SIA Supplementary immunization activities
SNID Subnational immunization day
Td Tetanus diphtheria toxoid; older children, adults
TT Tetanus toxoid
TT2+ 2 or more doses TT
VDPV Vaccine derived poliovirus
VPD Vaccine preventable diseases
WCBA Women of child bearing age
Contents
WHO South-East Asia Region
Maternal and neonatal tetanus elimina�on is sustained
Page
No.
TT2+ coverage by country, 2012-2016 Figure 9 13MNT eliminaion status Figure 10 13
Regional demographic atributes
Page
No.
SEAR populaion density by irst administraive level Figure 1 5
Basic informaion, 2016 Table 1 6
Rou�ne immuniza�on systems and services
Page
No.
Rouine immunizaion schedules by country, 2016 Table 2 7
BCG, DPT3, OPV3, MCV1, MCV2, HepB 3 and RCV coverage in SEAR, 2000-2016 Figure 2 8
Rouine immunizaion coverage esimates, 2012-2016 Table 3 9
Planning and management indicators, 2016 Table 4 10
Vaccine safety, 2016 Table 5 10
Reported vaccine preventable diseases, 2014-2016 Table 6 11 DTP3 coverage by country, 2012-2016 Figure 3 12 Districts achieving >80% DTP3 coverage by country, 2012-2016 Figure 4 12 DTP1-DTP3 drop-out by country, 2012-2016 Figure 5 12
DTP3 immunizaion coverage by irst administraive level, 2016 Figure 6 12
The Immunizaion and Vaccine Development (IVD) unit of the Department of Family Health, Gender and Life Course (FGL), World Health Organizaion (WHO), Regional Oice
for South-East Asia (SEARO) has been producing annually the Expanded Programme on Immunizaion (EPI) fact sheets since 2002 for all SEA countries and the region. The
primary data source of the EPI fact sheets are the WHO-UNICEF joint reporing form (JRF) and SEARO annual EPI reporing form (AERF) in which each country oicially reports
EPI and vaccine preventable diseases (VPD) related core informaion annually. The EPI factsheets 2017 are based on 2016 data reported to WHO SEARO by the Member States.
Polio-free status is maintained
Page
No.
NID/SNID and date of last WPV conirmed cases, 1995-2016 by country Table 7 14
Last WPV conirmed cases by type in SEAR Figure 11 14
Environmental surveillance for poliovirus detecion, 2014-2016 Table 8 14
AFP surveillance indicators by country, 2014-2016 Table 9 15
AFP surveillance indicators by irst administraive level, 2016 Figure 12 15
Towards measles elimina�on and rubella/congenital rubella
syndrome control
Page
No.
MCV1 coverage by country, 2012-2016 Figure 13 16 Status of sub-naional coverage for 1st dose of measles and
rubella containing vaccine in the SEA Region, 2016 Figure 14 16
Rubella vaccine introducion through rouine immunizaion Figure 15 16
Suspected measles cases and outbreaks by country, 2016 Table 10 17 Measles and rubella laboratory surveillance indicators, 2016 Table 11 18 Network of WHO supported laboratories for VPD surveillance in SEAR Figure 16 19
Control of Hepa��s B is accelerated
Page
No.
HepB3 coverage, 2012-2016 Figure 7 13
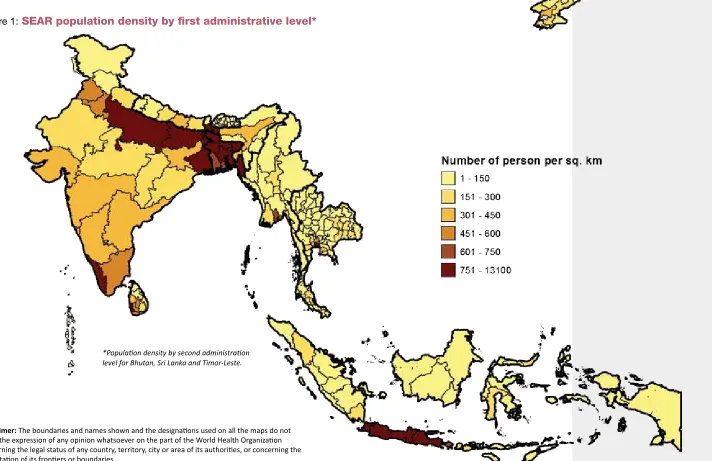
Regional demographic attributes
*Populaion density by second administraion level for Bhutan, Sri Lanka and Timor-Leste.
Figure 1:
SEAR population density by first administrative level*
Disclaimer: The boundaries and names shown and the designaions used on all the maps do not
Table 1:
Basic information, 2016
Country
2016 popula�on
1Mortality
2Administra�ve levels
1Total
popula�on
Live births
Children
< 1 year
< 5 years
Children
< 15 years
Children
Neonatal
mortality rate
(per 1000 LB)
Infant
mortality rate
(per 1000 LB)
Under ive
mortality rate
(per 1000 LB)
Maternal
mortality
ra�o (per
100000 LB)
Number of
provinces /
regions /
India
1,300,000,000 27,005,535 26,008,988 121,400,000 400,700,000 27.7 37.9 47.7 174 36 676Indonesia
258,704,986 4,858,600 4,760,891 23,960,310 70,096,861 13.5 22.8 27.2 126 34 514a1 SEAR annual EPI reporing form, 2016 2 WHO, World Health Staisics ,2016
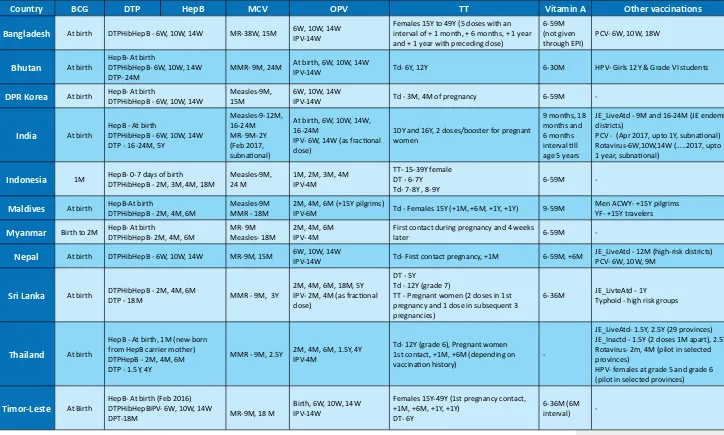
Table 2:
Routine immunization schedules by country, 2016
Country
BCG
DTP
HepB
MCV
OPV
TT
Vitamin A
Other vaccina�ons
Bangladesh
At birth DTPHibHepB - 6W, 10W, 14W MR-38W, 15M 6W, 10W, 14W IPV-14WFemales 15Y to 49Y (5 doses with an
interval of + 1 month, + 6 months, + 1 year
and + 1 year with preceding dose)
6-59M
(not given
through EPI) PCV- 6W, 10W, 18W
Bhutan
At birthHepB- At birth
DTPHibHepB- 6W, 10W, 14W DTP- 24M
MMR- 9M, 24M At birth, 6W, 10W, 14W
IPV-14W Td- 6Y, 12Y 6-30M HPV- Girls 12Y & Grade VI students
DPR Korea
At birth HepB- At birthDTPHibHepB - 6W, 10W, 14W
Measles-9M, 15M
6W, 10W, 14W
IPV-14W Td - 3M, 4M of pregnancy 6-59M
-India
At birthHepB - At birth
DTPHibHepB - 6W, 10W, 14W DTP - 16-24M, 5Y
IPV- 6W, 14W (as fracional dose)
10Y and 16Y, 2 doses/booster for pregnant women
9 months, 18 months and 6 months
interval ill
age 5 years
JE_LiveAtd - 9M and 16-24M (JE endemic districts)
PCV - (Apr 2017, upto 1Y, subnaional) Rotavirus-6W,10W,14W (…..2017, upto 1 year, subnaional)
Indonesia
1M HepB- 0-7 days of birth DTPHibHepB - 2M, 3M, 4M, 18MMeasles-9M,
Maldives
At birth HepB-At birthDTPHibHepB - 2M, 4M, 6M
Measles-9M MMR - 18M
2M, 4M, 6M (+15Y pilgrims)
IPV-6M Td - Females 15Y (+1M, +6M, +1Y, +1Y) 9-59M
Men ACWY- +15Y pilgrims YF- +15Y travelers
Myanmar
Birth to 2M HepB- At birthDTPHibHepB- 2M, 4M, 6M
MR- 9M Measles- 18M
2M, 4M, 6M IPV- 4M
First contact during pregnancy and 4 weeks
later 6-59M
-Nepal
At birth DTPHibHepB - 6W, 10W, 14W MR-9M, 15M 6W, 10W, 14WIPV-14W Td- First contact pregnancy, +1M 6-59M, +6M
JE_LiveAtd - 12M (high-risk districts)
PCV- 6W, 10W, 9M
Sri Lanka
At birth DTPHibHepB - 2M, 4M, 6MDTP - 18M MMR - 9M, 3Y
2M, 4M, 6M, 18M, 5Y
IPV- 2M, 4M (as fracional dose)
DT - 5Y
Td - 12Y (grade 7)
TT - Pregnant women (2 doses in 1st
pregnancy and 1 dose in subsequent 3
pregnancies)
6-36M JE_LivteAtd - 1Y
Typhoid - high risk groups
Thailand
At birthHepB - At birth, 1M (new-born from HepB carrier mother)
DTPHepB - 2M, 4M, 6M
DTP - 1.5Y, 4Y
MMR - 9M, 2.5Y 2M, 4M, 6M, 1.5Y, 4YIPV-4M Td- 12Y (grade 6), Pregnant women 1st contact, +1M, +6M (depending on vaccinaion history)
-JE_LiveAtd- 1.5Y, 2.5Y (29 provinces) JE_Inactd - 1.5Y (2 doses 1M apart), 2.5Y Rotavirus- 2m, 4M (pilot in selected provinces)
HPV- females at grade 5 and grade 6
(pilot in selected provinces)
Timor-Leste
At BirthHepB- At birth (Feb 2016)
DTPHibHepBIPV- 6W, 10W, 14W
DPT-18M MR-9M, 18 M
Birth, 6W, 10W, 14W IPV-14W
Females 15Y-49Y (1st pregnancy contact, +1M, +6M, +1Y, +1Y)
DT- 6Y
6-36M (6M interval)
-Source: WHO/UNICEF JRF 2016 W=Week M=Month Y=Year
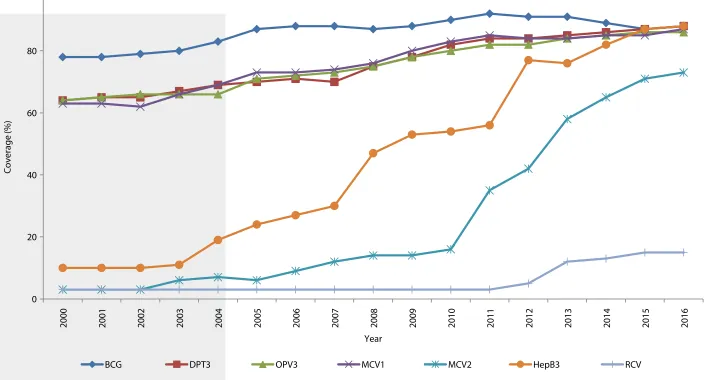
Routine immunization systems and services
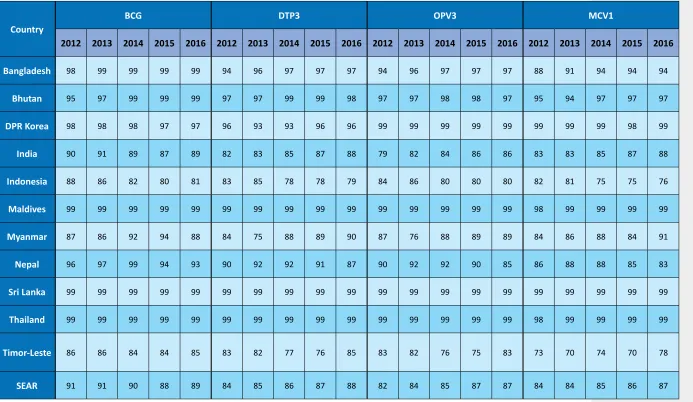
Source: WHO/UNICEF esimates of naional immunizaion coverage, July 2017 revision
BCG DPT3 OPV3 MCV1 MCV2 HepB3 RCV
Table 3:
Routine immunization coverage estimates, 2012-2016
Country
BCG
DTP3
OPV3
MCV1
2012
2013
2014
2015
2016
2012
2013
2014
2015
2016
2012
2013
2014
2015
2016
2012
2013
2014
2015
2016
Bangladesh
98 99 99 99 99 94 96 97 97 97 94 96 97 97 97 88 91 94 94 94Bhutan
95 97 99 99 99 97 97 99 99 98 97 97 98 98 97 95 94 97 97 97DPR Korea
98 98 98 97 97 96 93 93 96 96 99 99 99 99 99 99 99 99 98 99India
90 91 89 87 89 82 83 85 87 88 79 82 84 86 86 83 83 85 87 88Indonesia
88 86 82 80 81 83 85 78 78 79 84 86 80 80 80 82 81 75 75 76Maldives
99 99 99 99 99 99 99 99 99 99 99 99 99 99 99 98 99 99 99 99Myanmar
87 86 92 94 88 84 75 88 89 90 87 76 88 89 89 84 86 88 84 91Nepal
96 97 99 94 93 90 92 92 91 87 90 92 92 90 85 86 88 88 85 83Sri Lanka
99 99 99 99 99 99 99 99 99 99 99 99 99 99 99 99 99 99 99 99Thailand
99 99 99 99 99 99 99 99 99 99 99 99 99 99 99 98 99 99 99 99Timor-Leste
86 86 84 84 85 83 82 77 76 85 83 82 76 75 83 73 70 74 70 78SEAR
91 91 90 88 89 84 85 86 87 88 82 84 85 87 87 84 84 85 86 87Table 4:
Planning and management indicators, 2016
Spending on r
ou�ne
Bangladesh
2014-2018 fullyfuncional 27% 29% 64 districts (100%) EPI CES 2015
Bhutan
2014-2018 fullyfuncional 41% 24% 20 districts (100%) Naional Health Survey, 2012
DPR Korea
2016-2020 fullyfuncional datano no data
210 districts
(100%) CES and MICS
India
2013-2017 funcionalfully 50% 56% 676 districts(100%) Naional Family Health Survey-4 2015
Indonesia
2015-2019 fullyfuncional 90% 88% ND
Basic Health Survey 2013, District Coverage Survey
in 10 provinces and 31 districts 2015
Maldives
2016-2020 fullyfuncional 100% 72% 20 atolls (100%) DHS ongoing
Myanmar
2017 -2021 funcionalfully 6% 24% ND Demographic and Health Survey 2015-2016Nepal
2011-2016 funcionalfully 22% 24% 75 districts (100%) Demographic Health Survey 2016Sri Lanka
2017-2021 funcionalfully nodata 74%
26 districts
(100%) Nuwara Eliya district 2016EPI coverage survey
Thailand
2012-2016 fullyfuncional datano no data
77 provinces
(100%) based immunizaion 2013CES for basic and
school-Timor-Leste
2016-2020 fullyfuncional 76% 39% 13 districts (100%)
EPI CES Dili municipality and 12 other municipaliies 2015
Source: WHO/UNICEF JRF, 2016 ND: no data
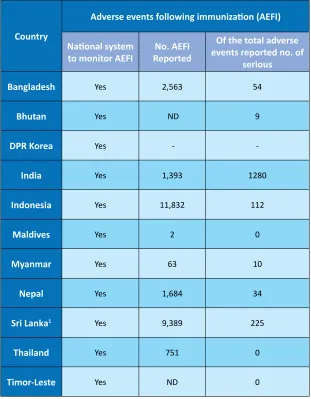
Table 5:
Vaccine safety, 2016
Country
Adverse events following immuniza�on (AEFI)
Na�onal system
to monitor AEFI
Reported
No. AEFI
Of the total adverse
events reported no. of
serious
Bangladesh
Yes 2,563 54Bhutan
Yes ND 9DPR Korea
Yes --India
Yes 1,393 1280Indonesia
Yes 11,832 112Maldives
Yes 2 0Myanmar
Yes 63 10Nepal
Yes 1,684 34Sri Lanka
1 Yes 9,389 225Thailand
Yes 751 0Timor-Leste
Yes ND 0Source: WHO/UNICEF JRF, 2016
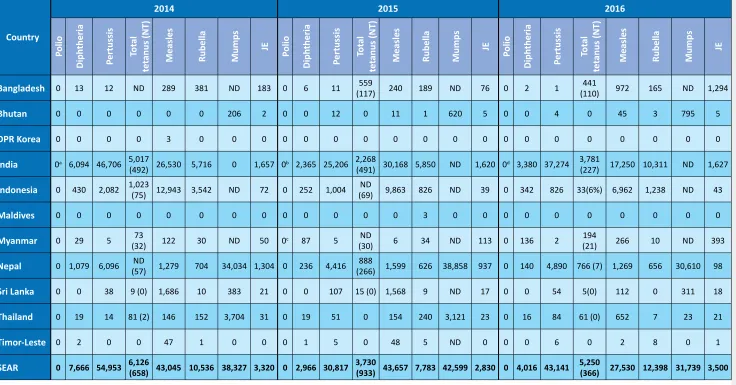
Table 6:
Reported vaccine preventable diseases, 2014-2016
Country
2014
2015
2016
P
tanus (NT)
Measles
Rubella
Mump
s
tanus (NT)
Measles
Rubella
Mump
s
tanus (NT)
Measles
Rubella
Mump
s
(492) 26,530 5,716 0 1,657 0b 2,365 25,206 2,268 (491) 30,168 5,850 ND 1,620 0d 3,380 37,274 3,781 (227) 17,250 10,311 ND 1,627
Indonesia
0 430 2,082 1,023(75) 12,943 3,542 ND 72 0 252 1,004
(57) 1,279 704 34,034 1,304 0 236 4,416 (266)888 1,599 626 38,858 937 0 140 4,890 766 (7) 1,269 656 30,610 98
Sri Lanka
0 0 38 9 (0) 1,686 10 383 21 0 0 107 15 (0) 1,568 9 ND 17 0 0 54 5(0) 112 0 311 18Thailand
0 19 14 81 (2) 146 152 3,704 31 0 19 51 0 154 240 3,121 23 0 16 84 61 (0) 652 7 23 21Timor-Leste
0 2 0 0 47 1 0 0 0 1 5 0 48 5 ND 0 0 0 6 0 2 8 0 1SEAR
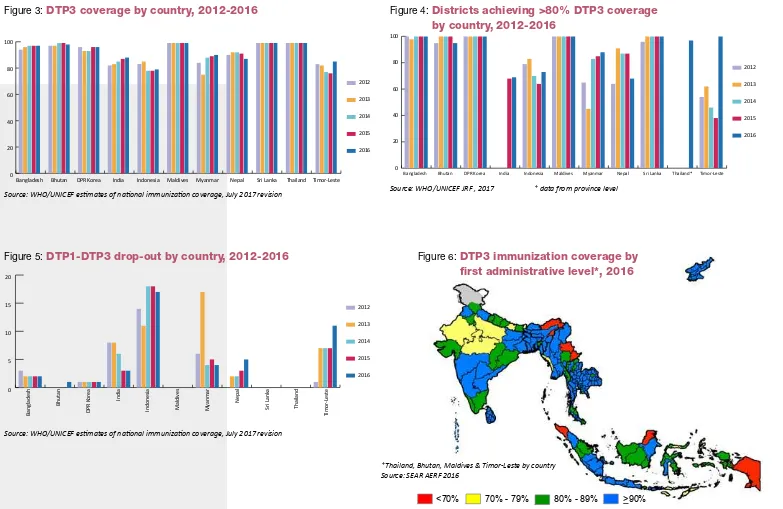
0 7,666 54,953 6,126 (658) 43,045 10,536 38,327 3,320 0 2,966 30,817 3,730 (933) 43,657 7,783 42,599 2,830 0 4,016 43,141 5,250 (366) 27,530 12,398 31,739 3,500 a Excludes 3 VPDVs (type 2) b Excludes 2 VDPVs (type 2) c Excludes 2 cVDPVs (type 2) d Excludes 1 VDPV (Type 2)Figure 3:
DTP3 coverage by country, 2012-2016
Source: WHO/UNICEF esimates of naional immunizaion coverage, July 2017 revision
Figure 4:
Districts achieving >80% DTP3 coverage
by country, 2012-2016
0
Source: WHO/UNICEF JRF , 2017 * data from province level
Figure 5:
DTP1-DTP3 drop-out by country, 2012-2016
2016
Source: WHO/UNICEF esimates of naional immunizaion coverage, July 2017 revision
Figure 6:
DTP3 immunization coverage by
first administrative level*, 2016
*Thailand, Bhutan, Maldives & Timor-Leste by country Source: SEAR AERF 2016
Eliminated from 2000 – May 2016 Eliminated before 2000
DTP-Hib-HepB (Pentavalent)
DTP-HepB Tetra/Mono HepB
Figure 7:
HepB vaccine and HepB3 coverage, 2016
Country
HepB3 coverage
2012
2013
2014
2015
2016
Bangladesh
94 96 97 97 97Bhutan
97 97 99 99 98DPR Korea
96 93 93 96 96India
73 70 79 87 88Indonesia
83 85 78 78 79Maldives
99 99 99 99 99Myanmar
58 75 88 89 90Nepal
90 92 92 91 87Sri Lanka
99 99 99 99 99Thailand
98 99 99 99 99Timor-Leste
83 82 77 76 85SEAR
77 76 82 87 88Source: WHO/UNICEF esimates of naional immunizaion coverage, July 2017 revision
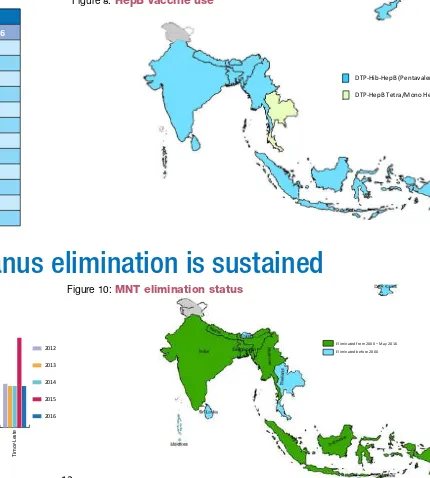
Maternal and neonatal tetanus elimination is sustained
Figure 9:
TT2+ coverage by country, 2012-2016
Figure 10:
MNT elimination status
2016
Source: WHO/UNICEF JRF, Country oicial esimates, 2012-2016
Control of Hepatitis B is accelerated
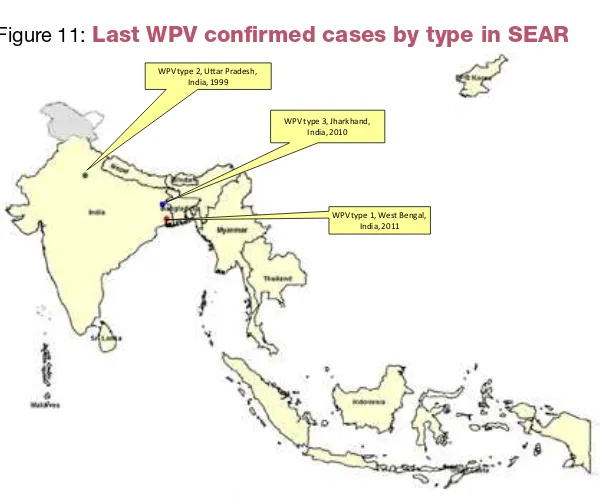
WPV type 2, U�ar Pradesh, India, 1999
WPV type 3, Jharkhand, India, 2010
WPV type 1, West Bengal, India, 2011
Table 7:
NID/SNID and date of last WPV confirmed cases, 1995-2016 by country
Polio-free status is maintained
Country
Year of 1st NID
Total NID rounds
Last NID round
SNIDs in 2016
Last WPV conirmed case
Bangladesh
1995 40 Dec-13 Yes 22-Nov-06Bhutan
1995 2 Nov-95 No 1986*DPR Korea
1997 12 Nov-02 No 1996India
1995 41 Feb-16 Yes 13-Jan-11Indonesia
1995 14 Mar-16 Yes 20-Feb-06Maldives
1996 8 Jan-01 No 1994Myanmar
1996 23 Feb-16 Yes 28-May-07Nepal
1996 27 Jan-14 Yes 30-Aug-10Sri Lanka
1995 8 Dec-00 No Nov-93Thailand
1994 10 Jan-00 No Apr-97Timor-Leste
1995** 11 Aug-15 No 1995* Clinically conirmed polio ** SIA conducted with Indonesia.
Figure 11:
Last WPV confirmed cases by type in SEAR
Table 8:
Environmental surveillance for poliovirus detection, 2014-2016
Country
2014
2015
2016
Number
of samples
collect
ed
Number
of samples
collect
ed
Number
of samples
collect
ed
Country
2014
2015
2016
AFP
Adequate stool specimen collec�on
percentageb
Adequate stool specimen collec�on
percentageb
Adequate stool specimen collec�on
percentageb
a Number of discarded AFP cases per 100,000 children under 15 years of age. b Percent with 2 specimens, 24 hours apart and within 14 days of paralysis onset. 1 Excludes twelve type 2 VDPV specimens from sewage 2 Excludes eleven type 2 VDPV specimens from sewage 3 Excludes six type 2 VDPV specimens from sewage
Figure 12:
AFP surveillance indicators by first administrative level
1, 2016
Non-polio AFP rate*
% Adequate Stool Specimen Collection**
*Number of discarded AFP cases per 100,000 children under 15 years of age.
**Percentage with 2 specimens collected at least 24 hours apart and within 14 days of paralysis onset
1 Bhutan, Maldives & Timor-Leste by Country <1 1 – 1.99
>2 No non-polio AFP case
Planned in 2018 2017 2015 <=2013
Figure 13:
MCV1 coverage by country, 2012-2016
Figure 14:
Status of sub-national coverage for 1st dose of measles
and rubella containing vaccine in the SEA Region, 2016
Source: WHO/UNICEF esimates of naional immunizaion coverage, July 2017 revision
Towards measles elimination and rubella/CRS control
2016
>95% 80%-94% <80% 0
Figure 15:
Rubella vaccine introduction through routine immunization
Table 10:
Suspected measles cases and outbreaks by country, 2016
Country
No. of Suspect
ed Measles
Case classiica�on (number)
Indicators
Measles
Rubella
Annual incidence of
con
irmed measles c
ases per
million t
ot
al popula
�on
Annual incidence of
con
irmed rubella c
ases per
opor�on of all suspect
ed
measles and rubella c
ases
tha
t ha
ve had an adequa
te
in
ves
�g
a�on ini�a
ted within
48 hour
s of no�ic
a�on
Non-measles non-rubella
disc
ar
opor�on of sur
veillance
units r
epor�ng on �me
Serum
conirmed
linked
EPI-
Clinically-conirmed
conirmed
Lab-
linked
EPI-
No.
%
No.
%
Bangladesh
4,289 618 354 81 165 0 3,060 6.05 1.03 94% 1.90 97% 3,729 87% 522 12%Bhutan
146 45 0 0 3 0 106 53.00 4.00 NA 14.00 NA 146 100% NA NADPR Korea
73 0 0 0 0 0 73 0.00 0.00 100% 0.32 96% 73 100% 46 63%India
36,447 3,476 13,070 704 1,351 8,960 4,107 13.10 7.80 16% 0.50 90% 7,763 11% 772 1%Indonesia
14,011 2,541 NA 5,495 1,193 NA 2,474 9.82 4.61 NA 0.96 NA 8,516 61% NA NAMaldives
12 0 0 0 0 0 12 0.00 0.00 100% 2.98 12% 12 100% 0 0%Source: SEAR annual EPI reporing form, 2016
Table 11:
Measles and rubella laboratory surveillance indicators, 2016
Country
SEROLOGY
VIROLOGY
Tot
al serum specimen
receiv
ed in labor
at
or
y
Specimens
received
cases tested
for serology
Specimen
posi�ve for
measles
IgM
Specimen
posi�ve for
rubella IgM
of receiving
the specimen
for serology
Tot
al vir
ology specimen
receiv
ed in labor
at
or
y
Specimen
posi�ve for
measles
virology
Specimen
posi�ve
for rubella
virology
Results
reported by
the laboratory
within 2
months of
receiving the
specimen for
virology
India
7,763 7,763 100% 7,763 100% 3,476 45% 1,351 17% 3,497 56% 772 281 36% 36 5% 463 60% D4,D8,B3 2BIndonesia
15,939 ND ND 12,064 76% 4,946 41% 1,899 16% 6,835 57% 208 16 8% ND ND ND ND ND ND*this includes 5 rubella Igm posiive samples that were subsequently excluded as they are post vaccinaion and one sample that was a repeat sample
Polio (Global specialized) Measles and Rubella
Japanese Encephaliis
IBD reference Rota reference Reference labs
Measles and Rubella Japanese encephaliis Polio
IBD Rota
Na�onal labs
Sub-national measles lab