Surface Fitting Filtering of LiDAR Point Cloud with Waveform Information
Shuai Xinga, Pengcheng Lia,b,*, Qing Xua, Dandi Wanga, Peng Liaa
Zhengzhou Institute of Surveying and Mapping, China –[email protected] b
State Key Laboratory of Geo-information Engineering, China
Commission II, WG II/3
KEY WORDS: LiDAR, Data Filtering, Waveform Information, Robust Estimation, Surface Fitting
ABSTRACT:
Full-waveform LiDAR is an active technology of photogrammetry and remote sensing. It provides more detailed information about objects along the path of a laser pulse than discrete-return topographic LiDAR. The point cloud and waveform information with high quality can be obtained by waveform decomposition, which could make contributions to accurate filtering. The surface fitting filtering method with waveform information is proposed to present such advantage. Firstly, discrete point cloud and waveform parameters are resolved by global convergent Levenberg Marquardt decomposition. Secondly, the ground seed points are selected, of which the abnormal ones are detected by waveform parameters and robust estimation. Thirdly, the terrain surface is fitted and the height difference threshold is determined in consideration of window size and mean square error. Finally, the points are classified gradually with the rising of window size. The filtering process is finished until window size is larger than threshold. The waveform data in urban, farmland and mountain areas from “WATER (Watershed Allied Telemetry Experimental Research)” are selected for experiments. Results prove that compared with traditional method, the accuracy of point cloud filtering is further improved and the proposed method has highly practical value.
*
Corresponding author
Funded by State Key Laboratory of Geo-information Engineering,NO. SKLGIE2016-M-3-1
1. INTRODUCTION
In recent years, with the continuously emerge of commercial small-footprint airborne ground measuring device, a new airborne full-waveform LiDAR measurement system receives extensive attentions, which is capable of recording laser pulse (Lai Xudong, 2013; Qin Yuchu, 2011). Compared with the traditional airborne LiDAR system, it mainly provides the users no longer discrete point cloud, but many sets of one-dimensional sampling pulse waveform data. Processing the waveform data not only can obtain the discrete point cloud, but also return information of targets (also known as waveform information) (Mallet and Bretar, 2009). Full-waveform LiDAR technology not only has a significant role on vegetation and biomass information, but greatly helps laser ground measurement, of which the most typical application is DEM generation.
Using full-waveform LiDAR data to generate high quality DEM includes two key steps: waveform data decomposition and point cloud filtering. Current waveform data decomposition algorithms mainly include nonlinear least square method (Hofton M, 2000; Chanve A, 2007), expectation maximization (Persson A, 2005; Li Qi, 2008) and markov chain monte carlo algorithm (Hernandez-Martin S, 2007), in which the nonlinear least square method based on Levenberg Marquardt (LM) is widely applied. This algorithm both has the advantages of gradient method and newton method, but has high requirements for initial value, which can easily run into local optimum; Filtering algorithms based on discrete point cloud geometric features can be divided into three main categories (Huang Xianfeng, 2009): morphological method (Qi C, 2007; Sui Lichun, 2010), method based on interpolation (Axelsson P, 2000; Kraus K, 1998) and method based on surface constraint (Su Wei, 2009). In surface constraint method, because of the
limitation of geometry information, there may be some error seed points, which bring adverse impacts on surface fitting filtering; the feasibility of differentiating ground and non-ground by using waveform parameter is verified by some scholars (Wagner et al., 2008; Doneus M, 2006; Mandlburger G, 2007; Mücke et al, 2010; Jalobeanu and Goncalves, 2014), however, such algorithm remains to be further researched. This paper presents a surface fitting filtering method with waveform information. The basic idea of the method is to use decomposed waveform information and robust estimation theory to help the selection of seed points; and the surface fitting weights are determined by waveform parameters; the window size and mean square error of surface fitting are comprehensively considered to make height difference threshold determined adaptively. The workflow is shown in Figure 1.
Figure 1. Flow chart of algorithm ISPRS Annals of the Photogrammetry, Remote Sensing and Spatial Information Sciences, Volume IV-2/W4, 2017
2. WAVEFORM DECOMPOSITION
Waveform data is usually composed of two parts, one is waveform attribute information, including transmitted pulse number, laser wavelength, transmitted pulse width, and three-dimensional coordinates of sampling points at the initial and end; another is all the pulse sampling data. Waveform is decomposed into multiple echoes to describe characters of different objects under pulse, in which waveform simulation and waveform modelling are two key technologies. Generally, waveform data is regarded as a combination of some Gaussian component (Wagner W, 2006), so it is modelled by Gaussian function model; waveform simulation is to solve optimal parameters. As mentioned above, the LM algorithm is usually adopted. However, the solutions of LM algorithm are usually local optimal, which make waveform decomposition results inaccurate. In this paper, global convergent LM is introduced to solve this problem and its decomposing steps are as follows: Step 1: pre-processing. In the process of laser pulse scanning, it may generate some background noise on account of the influence of weather or other factors, which appear small amplitude shaking form in the waveform. Waveform may be decomposed incorrectly if such noise is not removed.
Step 2: peak detection. Calculate second derivative of each sampling point. Regard zero position as the initial peak position. The number of detected peaks determines the number of waveform parameters.
Step 3: parameter initialization. As for Gaussian function model, parameters to be initialized include pulse amplitudeAk, half width k and pulse distancek.
Step 4: parameter optimization. Using global convergent LM can obtain global optimal waveform parameter solutions. The principle of this algorithm can be seen in reference.
Step 5: calculate residual. The residual is calculated, if residual is less than former, repeat Step2 to Step5. The method continues until residual does not reduce anymore. The formulation of residual is shown in formula(1), where n is the number of sampling points, m is the number of parameters, y is the amplitude of each sampling point in original waveform,
( )
f x is the amplitude of each sampling point in the fitted waveform.
Step 6: generate three-dimensional point cloud. After the iteration, the waveform parameters are obtained. Each waveform component corresponds to an object reflection echo, so the coordinates of the corresponding object are calculated based on waveform parameters.
2
1 1
( ( ))
n
i i
i
y f x n m
(1)3. FILTERING USING WAVEFORM INFORMATION
Point cloud filtering refers to processing and recognizing the irregular distributed discrete points on different objects, namely distinguishing ground point cloud (bare area and road) and non-ground point cloud (buildings, cars and vegetation etc.) (Sui Lichun, 2010). The traditional filtering methods generally use geometric features of discrete point cloud, which cannot well recognize low vegetation. Waveform parameters obtained by waveform decomposition will be in favour of improving filtering effect. As mentioned, scholars conducted some attempts by utilizing waveform information. In mountainous area, they verified the feasibility of using the pulse half width to distinguish ground and vegetation. However, the filtering method fully using waveform information remains to be further
explored, the experiments in cities and other areas remain to be further conducted. Traditional surface fitting filtering method (Su Wei, 2009) regarded the lowest point in window as ground seed point. Block terrain is fitted by seed points in several windows. However, some points on buildings will be selected improperly when it contains large size building in window, so that the fitted terrain should be inaccurate.
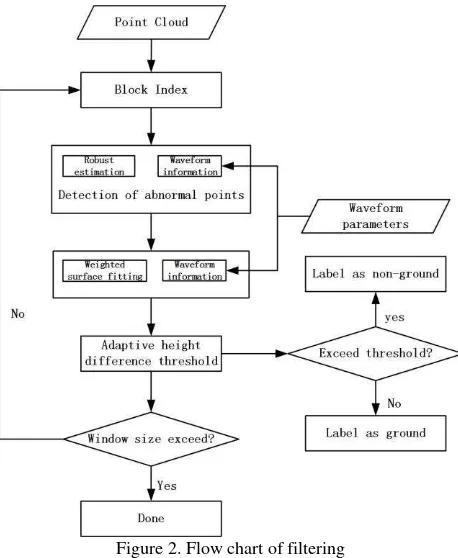
In order to solve this problem, waveform parameters and robust estimation theory are used to select reliable ground seed points. Weighted surface fitting based on waveform parameters and adaptive determination of height difference threshold should make up the deficiencies. The workflow is shown in Figure 2. It is also an iterative process. With increasing of the window size, the non-ground parts will be filtered gradually. The key technologies contain detection of abnormal seed points, weighted surface fitting and adaptive determination of height difference threshold.
Figure 2. Flow chart of filtering
3.1 Detection of abnormal seed points
Pulse half width is helpful to distinguish vegetation and building edge (Doneus M, 2006). Take Riegl LMS-Q560 for example, it is probable that the point with pulse half width lager than 1.7ns belongs to vegetation or building edges; and belongs to flat ground with pulse half width smaller than that. The pulse half width threshold is determined by the pulse width, which is given in system specification parameters. And the formula is 2 2ln 2. Therefore, the seed points are first screened using pulse half width.
A further detection is conducted based on robust estimation theory. The initial value of robust iteration should make sure high breakdown pollution rate. So, the trend surface model is calculated using robust estimation with high breakdown pollution rate (Yang Yuanxi, 1996). And the equivalent weight of each seed point after robust iteration is used to detect abnormal. The specific steps are as follows (Chang Yifeng, 2011):
Step 1: calculate the strong eliminating function as follows: ISPRS Annals of the Photogrammetry, Remote Sensing and Spatial Information Sciences, Volume IV-2/W4, 2017
0 Where, iterative equivalent weight matrix is
( )
determined by IGGIII weight function:
( ) abnormal one after iteration stopped.
During iteration, the weight values of untrusted seed points are gradually decreased by judging standard residual, so that, the accuracy of detecting abnormal seed points is increased.
3.2 Weighted surface fitting
After detection of abnormal seed points, the remained seed points are used to fit the terrain. The weight value of seed point is calculated according to pulse half width to obtain a better fitting result. The pulse half width get from waveform decomposition reflect the flatness of terrain. The greater is, the smaller the possibility that this point is on a flat surface, otherwise the possibility is greater. Therefore, the weights of seed points are set according to formula (6).
have large pulse half width.3.3 Adaptive height difference threshold
The height difference between discrete point and the fitting surface in the block can finally determine its attribute. When the height difference is greater than thresholdT , this point will be
marked as non-ground point, or it will be marked as ground point. However, different blocks have different shape of terrain. It is obviously improper that making the height differences threshold constant, so after overall considering the influence of window size and surface fitting error, we propose a method to adaptively determine height difference threshold as shown in formula (7). Its basic idea is that if window size and mean square error are both small, the fitting result will present the real terrain, namely the fitting precision is high. Therefore, the height difference threshold can be set strictly to ensure the low object points can be filtered effectively. On the contrary, as the window size and mean square error increase gradually, the fitted surface may be untrusted. Therefore, height difference threshold should be set loosely to avoid filtering error.
min d normalized m normalized max min
TT P d Pm T T (7)
Where, dnormalized is normalized window size; mnormalized is
normalized mean square error; the weight of window Pd and
weight of mean square error Pm are both set as 0.5; if height difference threshold is too small, some ground points will be hard to remain; if the threshold is too large, several non-ground points could not be filtered. Therefore, a range from 0.3 to 2 is given to the height difference threshold, namely, Tmin is 0.3, and
max T is 2.
4. EXPERIMENTS AND ANALYSIS
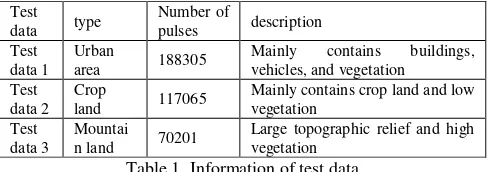
Small footprint LiDAR waveform data from “WATER (Watershed Allied Telemetry Experimental Research)” are selected for experiments. These data are collected by LMS-Q560 airborne full-waveform LiDAR system, which is developed by RIEGL. The beam divergence is 0.5mrad, wavelength is 1550nm and pulse width is 4ns. We select data of urban area and crop land from the surveying area in Zhangye city, and data of mountain land from surveying area in Dayekou forest. The information of data is shown in Table 1.
Test
Mainly contains buildings,
vehicles, and vegetation Test
data 2 Crop
land 117065
Mainly contains crop land and low vegetation
Table 1. Information of test data
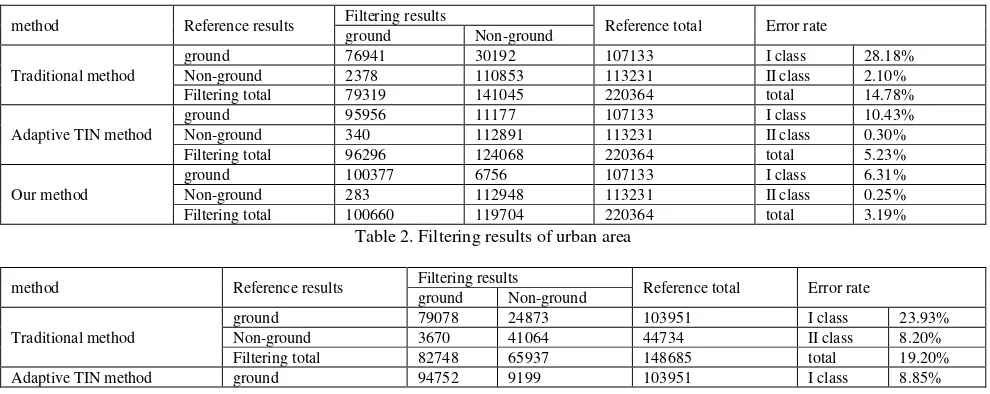
Figure 1~Figure 3 shows the filtering results of urban area, crop land and mountain land respectively, in which, (a) is the original point cloud, (b) is the filtered point cloud. Furthermore, we filtered these data sets by traditional method, adaptive TIN method and our method, and I class error rate, II class error rate and total error rate are counted separately. I class error rate is the rate that ground points are classified as non-ground points; II class error rate is the rate that non-ground points are classified as ground points; total error rate is the weighted sum of I and II class error rate. The adaptation is represented by I and II class error rate, and the feasibility is reflected by total error rate (Huang Xianfeng, 2009). Reference filtering results are edited by manual.
The maximum window size should be determined according to the objects in test area no matter using surface fitting method or adaptive TIN method. In our experiments, the maximum window size is set as 90m in urban area, 50m in crop land and 30m in mountain land. For different methods, we choose the ISPRS Annals of the Photogrammetry, Remote Sensing and Spatial Information Sciences, Volume IV-2/W4, 2017
same window size in one test data to ensure fair. The error rates of experimental results are shown in Table 2~Table 4.
(a) original point cloud (b) filtered point cloud
Figure 3. Filtering result of urban area
(a) original point cloud (b) filtered point cloud
Figure 4. Filtering result of crop land
(a) original point cloud (b) filtered point cloud
Figure 5. Filtering result of mountain land
method Reference results Filtering results Reference total Error rate
ground Non-ground
Traditional method
ground 76941 30192 107133 I class 28.18%
Non-ground 2378 110853 113231 II class 2.10%
Filtering total 79319 141045 220364 total 14.78%
Adaptive TIN method
ground 95956 11177 107133 I class 10.43%
Non-ground 340 112891 113231 II class 0.30%
Filtering total 96296 124068 220364 total 5.23%
Our method
ground 100377 6756 107133 I class 6.31%
Non-ground 283 112948 113231 II class 0.25%
Filtering total 100660 119704 220364 total 3.19%
Table 2. Filtering results of urban area
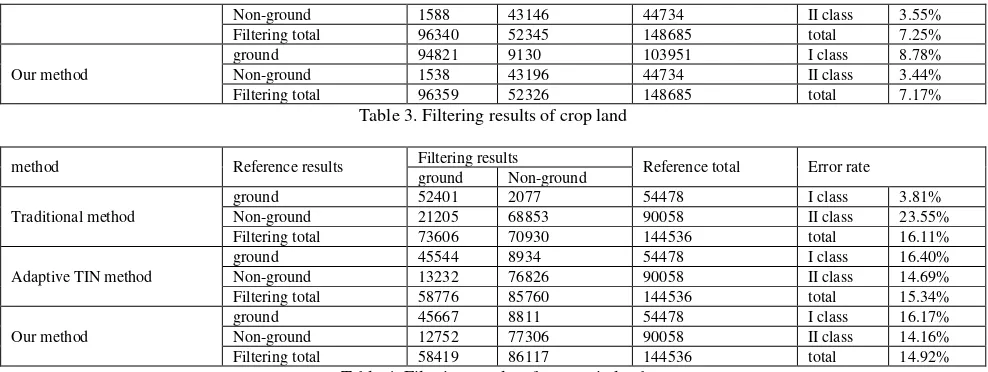
method Reference results Filtering results Reference total Error rate
ground Non-ground
Traditional method
ground 79078 24873 103951 I class 23.93%
Non-ground 3670 41064 44734 II class 8.20%
Filtering total 82748 65937 148685 total 19.20%
Adaptive TIN method ground 94752 9199 103951 I class 8.85%
Non-ground 1588 43146 44734 II class 3.55%
Filtering total 96340 52345 148685 total 7.25%
Our method
ground 94821 9130 103951 I class 8.78%
Non-ground 1538 43196 44734 II class 3.44%
Filtering total 96359 52326 148685 total 7.17%
Table 3. Filtering results of crop land
method Reference results Filtering results Reference total Error rate
ground Non-ground
Traditional method
ground 52401 2077 54478 I class 3.81%
Non-ground 21205 68853 90058 II class 23.55%
Filtering total 73606 70930 144536 total 16.11%
Adaptive TIN method
ground 45544 8934 54478 I class 16.40%
Non-ground 13232 76826 90058 II class 14.69%
Filtering total 58776 85760 144536 total 15.34%
Our method
ground 45667 8811 54478 I class 16.17%
Non-ground 12752 77306 90058 II class 14.16%
Filtering total 58419 86117 144536 total 14.92%
Table 4. Filtering results of mountain land
The experimental results show that, our method realizes point cloud filtering effectively as the non-ground parts are filtered in all the above three test areas. I class error rate, II class error rate and total error rate in urban area and crop land are obviously improved by our method compared with traditional method. Those 2 test data are both characterized by flat terrain. The wrong seed points on buildings and dense vegetation make the fitted surface unmatched with real terrain in traditional method, so that large amount of ground points are filtered and some non-ground points are remained, therefore, I class error rate and II class error rate are both relatively high. Our method makes up the deficiencies by detection of abnormal seed points. In mountain land data, the height difference threshold is relative large as the terrain relief, therefore, it should remain many non-ground points, and its small I class error rate is just a false appearance. Our method improves this problem by integrating waveform information and self-adaptive height difference threshold. And comparison with adaptive TIN method shows that, the result in urban area by our method is better, and results in crop land and mountain land are nearly the same with adaptive TIN method.
5. CONCLUSIONS
Full-waveform LiDAR is an active technology in the field of photogrammetry and remote sensing. It is characterized by full record of return pulse and the information obtained by it could be in favor of DEM generation. Nowadays, filtering using waveform information is not researched in depth, and there are shortcomings in selection of seed points in surface fitting method. We propose a weighted surface fitting filtering method using waveform information. Compared with traditional method, it has more accurate filtering result, and the problem of improper selection of seed points and deviation of surface fitting could be resolved. Waveform information could be not only used to DEM generation, but also be used for point cloud classification. Deep mining of waveform characteristics could improve the classification accuracy further, which should be our next research emphasis.
REFERENCES
Axelsson P, 2000. Dem Generation from Laser Scanner Data Using Adaptive TIN Models, International Archives of Photogrammetry and Remote Sensing, 33, pp. 110-117.
Chang Yifeng, Chai Hongzhou, Liu Jun, et al, 2011. Abnormal Data Detection of Marine Geomagnetic Survey in Robust Trend Surface, Journal of Geomatics Science and Technology, 28(4), pp. 254-261.
Chanve A, Mallet C, Bretar F, 2007. Processing Full-waveform Lidar Data: Modelling Raw Signals, International Archives of Photogrammetry, Remote Sensing and Spatial Information Sciences, 36(Part 3/W52), PP. 102-107.
Clément M, Frédéric B, 2009. Full-waveform Topographic Lidar: State-of-the-art, ISPRS Journal of Photogrammetry & Remote Sensing, 64, pp. 1-16.
Doneus M, Briese C, 2006. Digital Terrain Modeling for Archaeological Interpretation within Forested Areas Using Full-waveform Laser scanning, 7th International Symposium on Virtual Reality, Archaeology and Cultural Heritage, pp. 155-162.
He Xing, Liu Yongbao, Sun Fengrui, 2012. Optimal Fitting of Gas Turbine Performance Based on Improved Levenberg-Marquardt Method, Journal of Naval University of Engineering, 24(4), pp. 35-40.
Hernandez-Martin S, Wallace A, Gibson G, 2007. Bayesian analysis of Lidar Signals with Multiple Returns, IEEE Transactions on Pattern Analysis and Machine Intelligence, 29(12), pp. 2170-2180.
Hofton M, Minster J, Blair J, 2000. Decomposition of Laser Altimeter Waveforms, IEEE Transactions on Geoscience and Remote Sensing, 38(4), pp. 1989-1996.
Huang Xianfeng, Li Hui, Wang Xiao, et al, 2009. Filter Algorithms of Airborne LiDAR Data: Review and Prospects, Acta Geodaetica et Cartographica Sinica, 38(5), pp. 466-469.
Jalobeanu A, Goncalves G, 2014. Robust Ground Peak Extraction with Range Error Estimation Using Full-waveform LiDAR, IEEE Geoscience & Remote Sensing Letters, 11(7),pp. 1190-1194.
Kraus K, Pfeifer N, 1998. Determination of Terrain Models on Wooded Areas with Aerial Laser Scanner Data, ISPRS Journal of Photogrammetry & Remote Sensing, 53, pp. 193-203. ISPRS Annals of the Photogrammetry, Remote Sensing and Spatial Information Sciences, Volume IV-2/W4, 2017
Lai Xudong, QIN Nannan, HAN Xiaoshuang, et al, 2013. Iterative Decomposition Method for Small Foot-print LiDAR Waveform, J. Infrared Millim. Waves, 32(4), pp. 319-324.
Li Qi, Ma Hongchao, 2008. The Study of Point-cloud Production Method Based on Waveform Laser Scanner Data, Acta Geodaetica et Cartographica Sinica, 37(3), pp. 349-354.
Mandlburger G, Briese C, Pfeifer N, 2007. Progress in Lidar Sensor Technology- Chance and Chanllenge for DTM Generation and Data Administration. In Proceedings of the 51th Photogrammetric Week, pp. 159-169.
Mücke W, Hollaus M, Briese C, 2010. Segmentation-based Determination of Terrain Points from Full-waveform Airborne Laser Scanning Data, Vdm Verlag Dr Müller, 12(1),pp. 65-6.
Persson A, Söderman U, Töpel J, 2005. Visualization and Analysis of Full-waveform Airborne Laser Scanner Data, International Archives of Photogrammetry, Remote Sensing and Spatial Information Sciences, 36(Part 3/W19), pp. 103-108.
Qi C, Peng G, Dennis B, 2007. Filtering Airborne Laser Scanning Data with Morphological Methods, Photogrammetric Engineering and Remote Sensing, 73(2), pp. 175-185.
Qin Yuchu, LI Bin, NIU Zheng, et al, 2011. Stepwise Decomposition and Relative Radiometric Normalization for Small Footprint LiDAR Waveform, Sci China Earth Sci, 41(1), pp. 103-109.
Su Wei, Sun Zhongping, Zhao Dongling, et al, 2009. Hierarchical Moving Curved Fitting Filtering Method Based on LiDAR Data, Journal of Remote Sensing, 13(5), pp. 833-838.
Sui Lichun, Zhang Yibin, Liu Yan, et al, 2010. Filtering of Airborm LiDAR Point Cloud Data Based on the Adaptive Mathematical Morphology, Acta Geodaetica et Cartographica Sinica, 39(4), pp. 390-396.
Wagner W, Hollaus M, Briese C, 2008. 3D Vegetation Mapping Using Small-footprint Full-waveform Airborne Laser Scanner, International Journal of Remote Sensing, 29(5), pp. 1433-1452.
Wagner W, Ullrich A, Ducic V, 2006. Gaussian Decomposition and Calibration of A Novel Small-footprint Full-waveform Digitising Airborne Laser Scanner, ISPRS Journal of Photogrammetry & Remote Sensing, 60(2), pp. 100-112.
Yang Yuanxi, 1996. Adaptively Robust Least Squares Estimation, Acta Geodaetica et Cartographica Sinica, 25(3), pp. 206-211.