Soil nematode communities on Surtsey, 50 years after
the formation of the volcanic island
Krassimira ilieva-maKulec1*, Brynhildur Bjarnadottir2, Bjarni d. sigurdsson3, 1Cardinal St. Wyszynski University in Warsaw, 01-938 Warsaw, Poland, [email protected] (*corresponding author)
2University of Akureyri, Sólborg v. Norðurslóð, IS-600 Akureyri, Iceland, [email protected] 3Agricultural University of Iceland, Hvanneyri, IS-311 Borgarnes, Iceland, [email protected]
ABSTRACT
Soil nematodes are a key group that can both influence and reflect changes in the soil ecosystem. We investigated the generic composition, abundance and community structure of soil nematodes in two contrasting vegetation successional seres now found on the 50 year old volcanic island of Surtsey, Iceland. One represented the primary succession without much external input of nutrients (S1), while the other was a grassland that has evolved under a strong influence of allochthonous nutrient inputs by gulls (S2). In 2012 in total 25 genera of nematodes were identified, of which 14 were reported on Surtsey for the first time. Across the whole island, the nematode abundance and distribution was most strongly related to soil C:N ratio, soil acidity, plant cover and biomass. The nematode abundance was higher at S2 and there the trophic structure was dominated by bacterial- and plant-feeders, while hyphal-feeders were more dominant at S1. Nematode communities have continued to change at S1 since the last nematode survey, which took place 17 years ago, even where the vegetation cover and composition has remained stable. This may indicate a gradual change in the soil environment at S1. Within S2, the nematode community had become denser and more structured, but still it had lower generic diversity than found at S1. Resource availability was found to be an important driver for nematode colonization and primary succession on this isolated volcanic island. However, the study also found that soil nematode communities may show a different pattern of succession than plant communities.
Keywords: Iceland, nutrient inputs, primary succession, seabirds, soil fauna YFIRLIT
Þráðormasamfélög Surtseyjar 50 árum eftir myndun hennar.
Samfélög þráðorma í jarðvegi gegna mikilvægu hlutverki í frumframvindu og jarðvegsmyndun. Í þessari grein var fjallað um þær breytingar sem hafa orðið á samfélögum þráðorma í jarðvegi á Surtsey síðan að hún myndaðist 1963. Megin áherslan var lögð á að bera saman fjölda ættkvísla, þéttleika og skiptingu þeirra í fæðuhópa á milli tveggja megin framvindustiga gróðurs á Sutsey; á svæðum með lítilli næringarefnaákomu (S1) og svæðum innan þétts máfavarps á eynni þar sem næringarefnaákoma er mikil og gróðurframvinda er lengra komin (S2). Alls fundust 25 ættkvíslir þráðorma í þessari rannsókn og 14 þeirra höfðu ekki fundist áður á Surtsey. Þegar öll gögnin voru skoðuð saman kom í ljós að bæði þéttleiki og samsetning þráðormasamfélaga sýndi sterkast samband við C:N hlutfall í jarðvegi, sýrustig jarðvegs, gróðurþekju og ofanjarðarlífmassa gróðurs. Þéttleiki þráðorma var hærri á S2 og bakteríu- og plönturótaætur einkenndu samfélögin þar á meðan sveppþráðaætur einkenndu samfélögin á S1. Þráðormasamfélögin á S1 höfðu breyst frá síðustu úttekt þar fyrir 17 árum, þrátt fyrir að gróðurþekja og samsetning gróðurs hafi ekki breyst þar. Þetta bendir til breytinga (framvindu) á jarðvegsþáttum sem ekki sér merki ofanjarðar. Á S2 höfðu þráðormasamfélögin á sama tíma orðið þéttari og
með flóknari fæðuvef, en fjölbreytileiki þeirra var samt minni en á S1. Næringarefnaákoma, gróðurframvinda og jarðvegsmyndun voru afgerandi þættir í frumframvindu þráðorma. Athygli vakti einnig að framvinda þráðorma hafði að hluta til annan feril en gróðurframvinda á Surtsey.
INTRODUCTION
Soil invertebrates are a key group to study during the initial steps of colonization, primary succession and soil formation in an ecosystem (Walker & del Moral 2003). One of the most important groups of soil invertebrates are the soil nematodes. They play an important role in the processes of decomposition and mineralization and, thus, they contribute notably to the nutrient turnover in the soil (Ingham et al. 1985, Freckman 1988, de Goede & Bongers 1994). In general, nematode communities are highly abundant in numbers and species. They occupy different feeding habits (trophic levels) that include primary consumers (plant feeders), secondary consumers (predators) and consumers of microorganisms (bacterial and fungal feeders) and they also show different responses to changes in soil physical (temperature, moisture, etc.), chemical- (acidity, etc.) and vegetation characteristics (Yeates et al. 1993, de Goede & Bongers 1994). Their community parameters can be good indicators of various ecosystem parameters, such as trophic relationships and nutrient flows in natural soils. Therefore nematodes were chosen for the present study.
Nematode communities have been studied during the primary succession of different substrate types, including sand dunes (Wasilewska 1970, 1979, de Goede et al. 1993, Wall et al. 2002), mined lands (Háněl 2001, Hohberg 2003), in front of retreating glaciers (Doblas-Miranda et al. 2008, Ilieva-Makulec & Gryziak 2009) and on pristine volcanic islands (Suatmadji et al. 1988). These studies have shown that the abundance, community and trophic structure of nematodes can provide valuable insights into the changes in the soil environment and soil development during primary succession.
The island of Surtsey was formed in a volcanic eruption during 1963-1967 and the
primary succession there has been intensively monitored ever since (cf. Magnússon et al. 2014). Studies on soil fauna (including nematodes) on Surtsey are relatively scarce, however, despite their importance to primary succession. Even so, the results of the few studies on soil nematodes conducted on Surtsey during the period 1970-1995 allow us to roughly follow how their communities have been established and developed on the island. The first species found there was the bacterial feeder Acrobeloides nanus in 1970, but until 1972 the only other nematodes obtained from soil samples belonged to the genus Ditylenchus
(Holmberg & Pejler 1972, Sohlenius 1972). The next study on the soil microfauna of Surtsey was performed in 1976 and the only nematodes reported then belonged to the genus Monhystera
(Hedin 1978). These results showed that nematode colonization on Surtsey developed very slowly during the first decade after the island’s formation. In 1995, almost 20 years after the initial studies, Frederiksen et al. (2001) investigated the state of nematode succession. They reported 16 nematode taxa and compared the abundance and taxon diversity in plots with different vegetation types. They pointed out the potential role of the gull colony that was first established in 1984 as an important factor which could influence nematode communities and the rate of primary succession.
The first novelty of the present study was to assess the effect of allochthonous inputs of nutrients on the abundance (population density), community and trophic structure of soil nematodes during primary succession. The confined gull colony on Surtsey offered a natural enrichment experiment, with ca. 25 years of nutrient additions which have shifted the vegetation community to a later successional stage (Leblans et al. 2014, Magnússon et al. 2014).
The second novelty was to add 17 years to the known history of nematode colonization (and thereby to extend the record to 42 years) and how nematode communities had changed on a pristine volcanic island where all human influence has been kept at minimum. This made it possible to compare the successional trajectories of nematode communities to other organisms that have been monitored at the same permanent study plots, such as vascular plants and surface-dwelling invertebrates (Magnússon et al. 2014), and soil microbes (Marteinsson et al. 2015), as well as to the changes in the soil environment (Sigurdsson & Magnusson 2010, Leblans et al. 2014).
Stefansdottir et al. (2014) showed that root biomass and soil organic matter (SOM) generally were stable or even increased below a 10 cm depth in soil in the Leymus arenarius dominated areas outside the gull colony, while Leblans et al. (2014) found that both root biomass and SOM decreased strongly with soil depth in the grasslands inside the gull colony. Therefore it was plausible that the two successional seres would also show a contrasting depth distribution of nematodes.
The aims of our study were to: i) evaluate how gulls affect the nematode primary succession by their allochthonous nutrient inputs, ii) find out if new genera of nematodes had colonized the island since the last study, which took place 17 years ago, iii) investigate how the abundance and structure of the nematode communities had changed during the same period, and iv) relate observed changes in nematode community to other known environmental variables from the same study plots. Finally, goal v) was to investigate whether the vertical distribution of nematodes would mirror reported differences in plant root distribution and soil organic matter. MATERIALS AND METHODS
Study area
Surtsey (63°18’ N, 20°36’ W) is a pristine 1.3 km2 volcanic island 32 km off the south coast of
Iceland which was formed in an oceanic eruption between 1963 and 1967. Since its formation, the island has been strictly protected and for 50
years has been monitored by scientists interested in plant and faunal primary succession (e.g. Fridriksson 1965, 1992, Frederiksen et al. 2001, Magnússon et al. 2014). The climate is cool temperate and oceanic, with the mean annual temperature of 5.1°C and annual precipitation of 1599 mm during 1963-2012 on the nearby island of Heimaey (Icelandic Meteorological Office). Surtsey’s two craters are made out of basaltic tuff (Fig. 1), but its lower areas are made of basaltic lava, partly covered by tephra sand and silt originating from the eruption and from later erosion. The vegetation cover on these sandy areas is still scarce and dominated by plant species like Honkenya peploides and
Leymus arenarius (Table 1). This area is here
termed successional sere 1 (S1). Since 1990, plant surface cover, aboveground biomass, and plant species richness of S1 have been monitored in 16 permanent 10 × 10 m study plots. Data
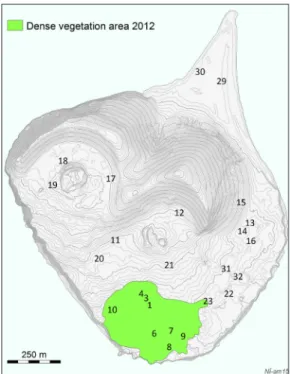
Figure 1. Location of the 25 permanent study plots on Surtsey. Note the dense vegetation at the gull colony (13 ha) in 2012 (coloured area). Plots 1, 3, 4, 6–10 and 23 are within the gull colony. Approxima-tion from aerial and satellite images from 2012, by Anette Th. Meier.
for soil carbon, C:N ratio and pH from all these plots exist from 2008, plant root:shoot ratios (R:S ratios), gross photosynthesis rate, soil respiration, microbial counts, soil temperature and soil water contents from 2012, and surface invertebrate abundance and species richness from 2002-2006 (Table 1). The plant surface cover (7% on average) and composition has not changed much within the S1 area during the past 20 years (Magnússon et al. 2014). An additional nine permanent study plots are located within
a confined area on the SW part of the island, where a gull colony (Larus fuscus, L. argentatus
and L. marinus) was first established in 1984
(Fig. 1). This area is here termed a successional sere 2 (S2). The gull breeding density within this area has been 39 nests ha-1 during the past
decade (Table 1) and its more-or-less continuous grassland vegetation now covers ca. 13 ha (Fig. 1). The reported changes in N accumulation rate, estimated for S1 and S2 in 2012-2013, as well as the reported mean changes in other
Table 1. Characteristics (mean values ± SE) of 16 permanent plots outside and 9 plots inside the gull colony on Surtsey. Data modified from different sources (see footnotes)
Characteristic Outside (S1) Inside (S2)
Gull breeding density (nests 1000 m-2) a 0.01 ± 0.01 3.9 ± 0.6
Soil properties
N accumulation rate (kg N ha-1 year-1) b 0.7 47
Soil pH c 8.2 ± 0.1 7.1 ± 0.1
Soil organic carbon (%) c 0.1 ± 0.0 1.8 ± 0.5
Soil C:N ratio c 6.9 ± 0.5 11.7 ± 0.5
Soil depth (cm) b 49.1 ± 7.1 19.8 ± 3.9
Volumetric water content (0-5 cm; %) d 2.3 ± 0.3 0.9 ± 0.2
Soil temperature (0-10 cm; oC) d 25±0.5 19.2 ± 0.5
Soil respiration (Resp; mmol m-2 s-1) d 0.2 ± 0.0 0.6 ± 0.2
Surface invertebrate fauna and soil microbes
Surface invertebrate catch (no day-1) a 13.9 ± 2.3 17.7 ± 2.9
Surface invertebrate species richness a 14.2 ± 1.1 28.3 ± 1.3
Soil microbe count (CFU/g) d, e 0.2×10⁶± 0.1×10⁶ 20.2×10⁶± 15.3×10⁶
Vegetation properties
Plant surface cover (%) a 7.1 ± 2.8 90.3 ± 15.2
Aboveground plant biomass (g m-2) a 47 ± 24 221 ± 76
Plant species richness (spp plot-1) a 4.4 ± 0.5 7.7 ± 0.9
Root:Shoot ratio b 18 5
Gross photosynthesis (GPP; mmol m-2 s-1) d 0.2 ± 0.1 0.5 ± 0.1
Dominant plant species a
(year of first colonization in the brackets) Honckenya peploides (1967), Leymus arinarius (1966), Armeria uniflora (1986), Sagina procumbens (1986) Poa pratensis (1975), Festuca richardsonii (1973), Leymus arinarius (1966), Honckenya peploides (1967), Rumex longifolius (1996), Puccinelia distans (1972) Empetrum nigrum (1993)
a Magnússon et al. (2014), b Leblans et al. (2014), c Sigurdsson and Magnusson (2010), d Marteinsson et al.
soil, plant and surface invertebrate and microbe parameters, are summarized in Table 1.
Nematode sampling
The sampling of nematodes took place on 20-21 July 2012, adjacent to each of the 16 and 9 permanent sample plots within S1 and S2, respectively (Fig. 1). Two 54 cm3 cores (2.7
cm2 cross-sectional area) were taken adjacent to
each plot down to a depth of 20 cm. The cores were kept separate and split into two layers: topsoil (0-10 cm) and subsoil (10-20 cm), where the soil depth allowed. The samples were kept in a cooler until extracted by a modified Baermann method (Flegg & Hooper 1970) at the soil lab at Möðruvellir, N Iceland. The extracted nematodes were preserved in 4% formaldehyde and then shipped to Poland where they were identified to genus level. In each sample, all nematodes were identified. Only in three samples, where more than 100 individuals were found, was a representative subsample of 100 nematodes identified. Nematode identification was based on the keys of Andrássy (1976, 1981, 1983), Bongers (1988) and Goodey (1963). Classification into trophic groups was done according to Yeates et al. (1993).
Data processing
In order to analyse the nematode communities, we chose the following parameters and indices: i) total nematode abundance; ii) the relative abundance of nematode trophic groups; iii) generic richness; iv) the Shannon-Wiener index of diversity (Southwood 1978); v) the index of similarity according to Sørensen (Southwood & Henderson 2000); vi) the Maturity Index (MI), an index based on nematode life history parameters and ecological requirements, which can be used in assessing the stage of nematode succession (Bongers 1990); and vii) the Plant Parasite Index (PPI) computed only for the plant-feeding genera (Bongers 1990). In addition, three functional indices of nematode communities were calculated: viii) the Enrichment Index (EI), ix) the Structure Index (SI) and x) the Channel Index (CI) (Ferris et al. 2001).
Statistical analyses
Due to lack of normal distribution and occurrence of zeros in the dataset the statistical differences (p <0.05) between S1 and S2 and between top- and subsoil were analysed by a Kruskal-Wallis test, followed by pairwise Mann-Whitney U tests (Sokal & Rohlf 1981). Canonical correspondence analysis (CCA) was performed to relate the generic composition and abundance of the nematode communities to the previously published soil physicochemical and vegetation characteristics (Table 1) of the permanent study plots (CANOCO programme; ter Braak 1986). A Monte Carlo permutation test was applied to determine the significance of the first axis and for the overall test. Two permanent plots outside the gull colony, 31 and 32, had to be excluded from the CCA analysis because not all environmental parameters were available for them.
RESULTS
Nematode abundance
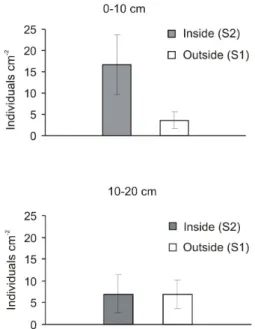
The average nematode abundance in the topsoil was significantly higher at S2 than S1, or 16.7
Figure 2. Nematode abundance in topsoil (0-10 cm) and subsoil (10-20 cm) in permanent study plots lo-cated outside and inside the gull colony on Surtsey.
compared to only 3.6 ind. cm-2 (Fig. 2; p=0.04).
At S1 and S2 nematode abundances were not significantly different between depth layers (p=0.42 and p=0.52, respectively) or between S1 and S2 in the subsoil (p=0.74; Fig. 2). At S1 the highest nematode abundance (21.7 ind. cm-2)
was noticed in plots where the plant species
Honckenya peploides dominated, while at S2
the most numerous nematode populations (33.9 ind. cm-2) were in plots where Poa pratensis was
present (data not shown).
Nematode generic richness
The number of nematode genera per sample was variable within both successional seres (Table 2). It was significantly lower in the topsoil of S1 than S2, but across all samples the subsoil of S1 contained the highest number of genera (Table 2). The increase in generic richness with depth was significant for S1, while generic richness did not change significantly with depth for S2 (Table 2). Across all samples, the total generic richness was higher at S1 than at S2 or 24 and 18 genera, respectively (Table 3).
Nematode diversity and dominance structure
The Shannon diversity index H’ had low values for both seres, but still it was significantly higher at S1 than at S2 in the subsoil, while it was significantly lower at S1 than at S2 in the topsoil
(Table 2). At S2 it did not differ significantly with depth, while at S1 the index was significantly higher in the subsoil than the topsoil (Table 2). A relatively high Sørensen’s Index of similarity of 65% was found across both soil layers between the two seres (data not shown). When calculated for the two depths within each sere, it was still high, even if it was somewhat lower at S2 than at S1 (Table 2). The frequency of occurrence was quite low for most nematode genera. Most nematode genera occurred in less than 20% of the samples (Table 3). Nematodes from the genera
Tylenchorhynchus, Cephalobus, Anaplectus, and
Panagrolaimus were among the most frequently
recorded at S2 (Table 3). The first two genera were also very frequent at S1, where the genera
Aphelenchoides and Acrobeloides also occurred
with a high frequency (Table 3).
The structure of dominance of nematode genera at S2, where no subdominants were found, seemed sharper than in plots at S1 (Table 3). Most abundant (eudominants) at S2 were two bacterial feeding genera,
Panagrolaimus and Rhabditis, and one plant
feeder Tylenchorhynchus, while in plots at S1 the eudominants were the bacterial feeder
Cephalobus, the fungal feeder Aphelenchoides
and the plant feeder Tylenchorhynchus (Table 3).
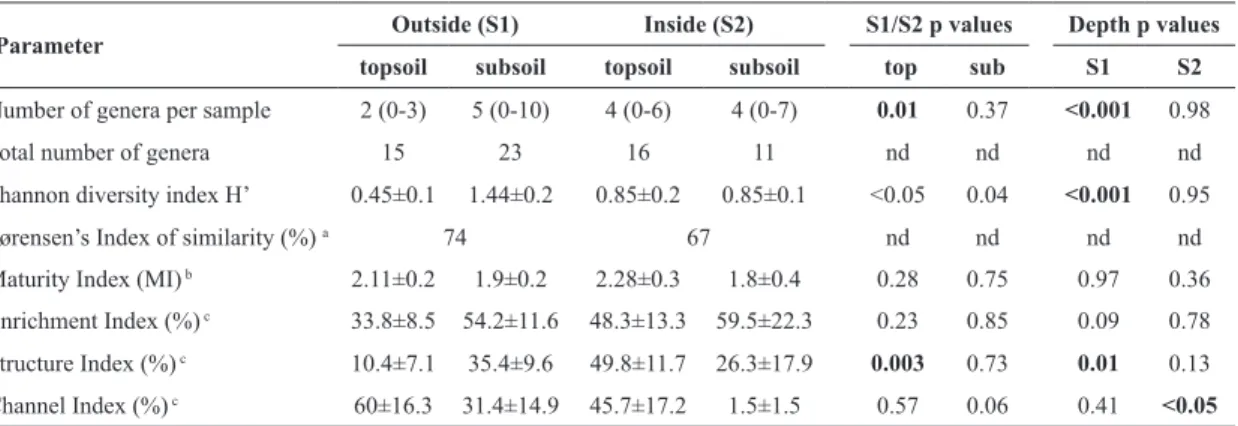
Table 2. Diversity, similarity and functional indices (mean values±SE) of nematode communities in topsoil (0-10 cm) and subsoil (10-20 cm) 16 of permanent study plots outside (S1) and 9 plots inside a gull colony (S2) on Surtsey in 2012. Differences between groups were tested with Mann-Witney U tests; nd stands for “not determined”.
Parameter Outside (S1) Inside (S2) S1/S2 p values Depth p values
topsoil subsoil topsoil subsoil top sub S1 S2
Number of genera per sample 2 (0-3) 5 (0-10) 4 (0-6) 4 (0-7) 0.01 0.37 <0.001 0.98
Total number of genera 15 23 16 11 nd nd nd nd
Shannon diversity index H’ 0.45±0.1 1.44±0.2 0.85±0.2 0.85±0.1 <0.05 0.04 <0.001 0.95
Sørensen’s Index of similarity (%) a 74 67 nd nd nd nd
Maturity Index (MI) b 2.11±0.2 1.9±0.2 2.28±0.3 1.8±0.4 0.28 0.75 0.97 0.36
Enrichment Index (%) c 33.8±8.5 54.2±11.6 48.3±13.3 59.5±22.3 0.23 0.85 0.09 0.78
Structure Index (%) c 10.4±7.1 35.4±9.6 49.8±11.7 26.3±17.9 0.003 0.73 0.01 0.13
Channel Index (%) c 60±16.3 31.4±14.9 45.7±17.2 1.5±1.5 0.57 0.06 0.41 <0.05 a according to Southwood & Henderson (2000); b according to Bongers (1990); c according to Ferris et al. (2001).
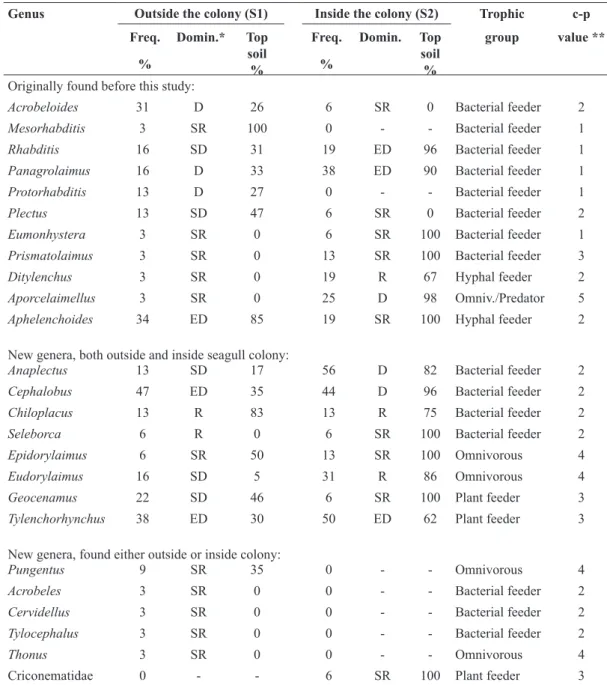
Table 3. Nematode generic composition adjacent to the permanent study plots in Surtsey in 2012. The frequency (Freq.; % of samples in which each genus occurred), dominant status, relative occurrence in topsoil (0-10 cm), feeding habits (trophic group) and c-p value of each genus occurring in samples outside (32 samples) and inside (16 samples) the gull colony.
Genus Outside the colony (S1) Inside the colony (S2) Trophic c-p Freq. % Domin.* Top soil % Freq. % Domin. Top soil % group value **
Originally found before this study:
Acrobeloides 31 D 26 6 SR 0 Bacterial feeder 2
Mesorhabditis 3 SR 100 0 - - Bacterial feeder 1
Rhabditis 16 SD 31 19 ED 96 Bacterial feeder 1
Panagrolaimus 16 D 33 38 ED 90 Bacterial feeder 1
Protorhabditis 13 D 27 0 - - Bacterial feeder 1
Plectus 13 SD 47 6 SR 0 Bacterial feeder 2
Eumonhystera 3 SR 0 6 SR 100 Bacterial feeder 1
Prismatolaimus 3 SR 0 13 SR 100 Bacterial feeder 3
Ditylenchus 3 SR 0 19 R 67 Hyphal feeder 2
Aporcelaimellus 3 SR 0 25 D 98 Omniv./Predator 5
Aphelenchoides 34 ED 85 19 SR 100 Hyphal feeder 2
New genera, both outside and inside seagull colony:
Anaplectus 13 SD 17 56 D 82 Bacterial feeder 2
Cephalobus 47 ED 35 44 D 96 Bacterial feeder 2
Chiloplacus 13 R 83 13 R 75 Bacterial feeder 2
Seleborca 6 R 0 6 SR 100 Bacterial feeder 2
Epidorylaimus 6 SR 50 13 SR 100 Omnivorous 4
Eudorylaimus 16 SD 5 31 R 86 Omnivorous 4
Geocenamus 22 SD 46 6 SR 100 Plant feeder 3
Tylenchorhynchus 38 ED 30 50 ED 62 Plant feeder 3
New genera, found either outside or inside colony:
Pungentus 9 SR 35 0 - - Omnivorous 4
Acrobeles 3 SR 0 0 - - Bacterial feeder 2
Cervidellus 3 SR 0 0 - - Bacterial feeder 2
Tylocephalus 3 SR 0 0 - - Bacterial feeder 2
Thonus 3 SR 0 0 - - Omnivorous 4
Criconematidae 0 - - 6 SR 100 Plant feeder 3
* Dominance classes (Domin.): relative abundance <1 = subrecedent (SR); 1.1-2 = recedent (R); 2.1-5 = subdominant (SD); 5.1-10 = dominant (D); >10.1 = eudominant (ED); ** according to Bongers (1990); c-p value indicates the place of the taxon on a colonizer-persister (c-p) continuum of 1 to 5.
All eudominants and dominants at S2 had a greater share in the top layer (excluding
Tylenchorhynchus), while at S1 they showed
an affinity to the subsoil layer (excluding
Aphelenchoides) (Table 3).
Nematode trophic structure
The nematodes found on Surtsey were further classified into four trophic groups (Fig. 3). The trophic structure of nematode differed substantially between S1 and S2, with a relatively higher proportion of omnivores and bacterial feeders (topsoil) and plant feeders (subsoil) at S2 and a relatively higher share of hyphal feeders in the topsoil and more omnivores in the subsoil at S1 (Fig. 3). The trophic structure also differed distinctly between the two soil layers in both seres; in the topsoil of
S2 there were relatively more bacterial feeders and omnivorous nematodes, while in the subsoil more plant feeders occurred. At S1 a much higher percentage of hyphal feeders was noted in the topsoil, while the proportion of bacterial feeders and omnivores increased relatively in the subsoil (Fig. 3; Table 3).
Nematode ecological indices
The mean values of the Maturity Index (MI) were quite low and not significantly different between S1 and S2 or for depth layers (around 2 for all; p=0.36-0.97; Table 2). When looking at individual plots the MI was, however, clearly more variable at S2, where it ranged between 1.1 (samples from plots 1 and 7) and 4.1 (samples from plot 4) (data not shown). At S1, the MI was ca. 2.0 in most plots, but the lowest MI value (1.0) for the island was found there in plot 29 and among the highest values (4.0) in samples from plots 21 and 31 (data not shown). The Plant Parasite Index (PPI) was always 3.0, irrespective of successional sere or depth (data not shown).
The Enrichment Index (EI) did not differ significantly between the seres or with depth (Table 2). The Structure Index (SI) was significantly higher for S2 than S1 in topsoil, but not in subsoil (Table 2). At S1 the SI was also significantly higher in the subsoil than in the topsoil (Table 2). The Channel Index (CI) showed a trend (p=0.06) towards higher values at S1 than S2 in the subsoil, while no significant differences were found between the seres in the topsoil. The CI was also significantly lower in the subsoil than in the topsoil at S2, while CI did not differ
Figure 3. Trophic structure of nematode communities in topsoil (0-10 cm) and subsoil (10-20 cm) in permanent study plots located outside and inside the gull colony on Surtsey.
significantly with depth at S1 (Table 2).
Environmental factors and nematode abundance and distribution
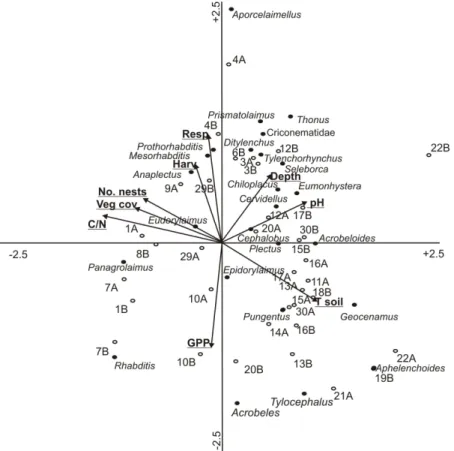
The results from the Canonical Correspondence Analysis (CCA) showed that the eigen values were 0.77 (p=0.01) and 0.56 for the first and second axes, respectively, and the two first axes explained 22.9% of the variation in genera data and 40.3% of the total
genera-Figure 4. Plot diagram of nematode fauna on Surtsey in Canonical Correspondence (CCA) ordination. Nema-tode genera are indicated by black circles, permanent plots by open circles, environmental variables by arrows. Plots (1-10 and 23) were located inside the gull colony and plots (11-30) outside. From most plots two samples (A and B) were used and total abundance in the 0-20 cm soil layer was used. For more explanation see the text and Fig. 1 and Table 1 for plot locations and environmental factors.
Table 4. The results of Canonical Correspondence analysis (CCA) on nematode abundance and distribution in relation to environmental characteristics of the permanent surveyed plots on Surtsey. For more information see Table 1.
Axes 1 2 3 4
Eigen values 0.773 0.557 0.469 0.335
Species-environment correlations 0.980 0.951 0.915 0.925 Cumulative percentage variance:
of species data
of species-environment relation 12.822.6 22.940.3 31.455.4 37.566.3 Sum of all unconstrained eigenvalues 5.511
Sum of all canonical eigenvalues 3.112 Summary of Monte Carlo test:
test of significance of first canonical axis F ratio = 2.92, p =0.01
environment variation (Table 4). As can be seen in Fig. 4, the CCA ordination differentiated well between the plots of the S1 and S2, plots 1-10 and 23 being inside the gull colony (S2) and plots 11-30 being outside of it (S1).
The position of genera which were not concentrated in the centre of the diagram indicated relationships with the environmental variables (Fig. 4). The significant relationships (p<0.05) between the environmental variables and the abundance and distribution of nematode genera to the 1st CCA axis were: i) plant surface
cover (F=3.57; p=0.01), ii) aboveground plant biomass (F=3.35; p=0.01), iii) soil pH (F=2.46, p=0.01), iv) C:N ratio (F=2.43, p=0.01), v) soil depth (F=1.99, p=0.02) and soil temperature (F=1.97, p=0.05). It was also found that higher July soil temperatures and higher pH were most strongly associated with the abundance and distribution of nematode genera at S1, while higher C:N ratios, plant cover and biomass were associated with these variables at S2 (analysis not shown). Deeper soil (or loose mineral substrate), however, was associated within the nematode community assemblage on plots both at S1 and S2 (e.g. plots 3, 12, 17 and 20), indicating that it was an important controlling factor for nematode community structure,
irrespective of vascular plant successional stage. DISCUSSION
Long-term changes in nematode abundance and number of taxa
One aim of our study was to determine how nematode communities have continued to develop on Surtsey since the first survey was conducted there in 1970. We found that during this period nematode communities have indeed become more numerous and more diverse. The number of nematode genera has steadily increased from one taxon in 1970 to 25 taxa in 2012 (Fig. 5). Such an increasing trend of nematode taxonomic richness over time concurs with findings in other studies on primary succession (de Goede et al. 1993, Wall et al. 2002).
The relative increase in nematode generic richness during the initial 50 years was similar to the increase which had been observed in vascular plant species richness on Surtsey during the same period (del Moral & Magnússon 2014). Unfortunately, we lack a nematode survey in the early 1980s to know if the generic diversity then showed a stagnating phase as was observed for vascular plants before the gulls established a nesting colony (Fridriksson 1992, del Moral & Magnússon 2014). Similar temporal patterns in soil invertebrate communities and plant communities have been reported in a study on primary succession following glacial retreats in New Zealand (Doblas-Miranda et al. 2008).
The number of taxa and the abundance of nematodes we found on Surtsey in 2012 was, however, still relatively low, and well below the normal lower ranges of species diversity (74 species) and abundance (0.6 × 10⁶ m-2)
for nematodes in late successional grasslands (Wasilewska 1979). No comparable nematode studies exist from mainland Iceland, but higher generic diversity and abundances have been found in other high-latitude ecosystems (Kuzmin 1976, Doblas-Miranda et al. 2008). However, similarly low numbers and only 16 genera of nematodes have been found in Antarctica more than 50 years after a glacier retreat (Ilieva-Makulec & Gryziak 2009). This is
Figure 5. Number of nematode taxa found in differ-ent habitats on Surtsey during the period 1970-2012. Data from Sohlenius (1972; 1974), Hedin (1978), Frederiksen et al. (2001) and the present study.
in sharp contrast to the findings of, for example, Wasilewska (1970), who found that nematode generic diversity can reach stable numbers after the first decade of primary succession of sand dunes in Poland.
Long-term changes in nematode trophic structure
Over the course of the 50 years, the community trophic structure had become more complex and when compared across the whole island it has roughly followed the vegetation succession (Magnússon et al. 2014). Initially only nematodes feeding on bacteria and algae (bacterial feeders and omnivores) were recorded on the island (Sohlenius 1972, 1974, Hedin 1978). In 1995 two genera of fungal feeders were found, in addition to bacterial feeders and omnivorous taxa (Frederiksen et al. 2001). In the present study plant feeders (plant parasites) were recorded for the first time, which indicated a recent colonization of this feeding group. It seems unlikely that the difference in the coring depth between the studies in 1995 and 2012 could explain this, but Frederiksen et al. (2001) only took samples from the upper 5 cm of soil. In the present study, 14% of the nematodes found in the topsoil of all permanent plots were plant feeders, which makes it unlikely that they would have been totally missed in the earlier study.
It is still an open question why until now no typical predators from Mononchida have been noticed on Surtsey. The presence of mononchids, however, has often been related to the occurrence of mosses (Suatmadji et al. 1988, Ilieva-Makulec & Gryziak 2009), whereas moss carpets are largely confined to relatively small sheltered areas on Surtsey (Ingimundardóttir et al. 2014). There is, however, a possibility that omnivores, such as Aporcelaimellus, may have started to behave as predators at S2, a behaviour known from other studies (Bongers 1999). This might explain the association between
Aporcelaimellus and the high abundance of
bacterial feeders there.
Depth distribution of the nematode community
The contrasting depth distribution of
nematodes and observed differences in food web indices and feeding groups between the two successional seres corresponded well with the deeper root systems and higher R:S ratios of the sparse vegetation dominating at S1 and the relatively shallower root distribution and larger surface SOM stocks developing at the S2 grasslands (Leblans et al. 2014, Stefansdottir et al. 2014). This finding showed that such deep soil cores should always be used when different successional seres are to be compared.
The effect of resource availability on nematode colonization
Since their colonization in 1984 the gulls have increased the soil fertility through their allochthonous nutrient transport from sea to land on a confined part of the island (Leblans et al. 2014). This, and possibly enhanced seed dispersal with the birds, has increased the rate of vascular plant primary succession there (del Moral & Magnússon 2014), seen as increases in vegetation cover, biomass and plant species richness as well as surface invertebrate species richness (Magnússon et al, 2014), plant photosynthesis (Marteinsson et al. 2015), SOM stocks (Leblans et al. 2014) and soil respiration (Sigurdsson & Magnusson 2010, Marteinsson et al. 2015), all of which have increased the habitat heterogeneity of the whole island.
The area within the gull colony (S2) is now found at a different successional sere, where the vegetation of the most affected plots resembles the grassland communities of seabird colonies of 5000-6000 year old nearby islands (Magnússon et al. 2014). This habitat has become suitable for a new nematode colonization. Among the dominant nematode genera found there were
Panagrolaimus and Rhabditis, both of which are
enrichment opportunists, according to Bongers (1999), with short life cycles and large food resource requirements. Sohlenius (1988) also found two species of Panagrolaumus in a bird nest from Surtsey. At S1, outside the gull colony, nematodes from Cephalobus and Acrobeloides
dominated, but they are habitat generalists with longer life cycles and lower food requirements
(Bongers 1999, Ilieva-Makulec 2001a, b). This corresponded well with the lower productivity, plant cover and soil fertility of S1 (see overview in Table 1) and the observed relationships between the environmental variables and soil nematode communities in the CCA analysis.
It is worth emphasizing that the nematode generic diversity at S2 was lower compared to the more infertile areas at S1. A decrease in the taxonomic diversity of nematodes with higher successional stage has been related to a retrogressive (decline) phase due to reduced nutrient availability over time (Doblas-Miranda et al. 2008). However, the nutrient availability was clearly much higher at S2 than at S1 (Leblans et al. 2014). Such shifts have also been related to corresponding changes in plant diversity (de Goede et al. 1993), but the plant diversity was also higher at S2 than S1 (Magnússon et al. 2014). Therefore, it seems plausible that this situation is caused by trophically similar taxa that have different food thresholds and thus show a temporal divergence in their activities and population dynamics (Schiemer 1983, Ilieva-Makulec 2001b). It is likely that not only the plant identity but also the quality of the plant litter can influence nematode abundance and diversity. The observed relationship between the nematode abundance and the occurrence of the plant Honckenya peploides on S1 and Poa
pratensis on S2 may stem from that. According
to Ilieva-Makulec et al. (2006) the highest abundance but the lowest nematode diversity was found in litter with the lowest C:N ratio. This may therefore also partly explain the trend for lower generic diversity at S2.
We found that the Shannon Index of diversity was successful in detecting differences in the nematode community between and within S1 and S2. It also still showed similar relative trends as seen in topsoil between these two areas in 1995 (Frederiksen et al. 2001), even though the H’ values had become lower for both S1 and S2 in 2012. In 1995 the mean H’ value for topsoil across both habitats was 1.11 compared to 0.90 in the present study. However, we found that multivariate analysis was a much better method
for relating the generic diversity to the soil and vegetation characteristics of plots located inside and outside the gull colony.
The values of the maturity index (MI) of the nematode community in both successional seres (S1 and S2) were low and still similar to the values calculated for Surtsey in 1995 by Frederiksen (2001), when the vegetation cover at S2 had just increased (del Moral & Magnússon 2014). They were also similar to values found in the 50 year old glacial retreat areas on Antarctica (Ilieva-Makulec & Gryziak 2009). Such low values of MI indicate a weak organisation and low maturity of nematode communities. This may be indicate that nematode communities will continue to change into the future and 50 years may prove much too short a time to follow the successional dynamics of nematodes in such high-latitude ecosystems. Therefore nematode surveys should be continued at Surtsey, since not many such long surveys exist.
It was also noteworthy that PPI was not found to differ across the two seres, even if S1 and S2 differed greatly in plant cover and root biomass (Magnússon et al. 2014, Leblans et al. 2014). Bongers et al. (1997) has shown that PPI generally increases with fertilization of grasslands, so a higher PPI would have been expected at S2, further supporting that the expectation that the nematode community structure is likely to continue to change for a long time, even if the vegetation community at S2 has reached a successional sere that resembles older islands (Magnússon et al. 2014).
The effect of resource availability on the soil food-web indices
The food-web indices (EI, SI, CI) did not all respond as expected to the enhanced resource availability at S2. There, the increased plant diversity and biomass had provided larger resources of dead organic matter for bacterial (Leblans et al. 2014), seen as a 100-fold increase in bacteria counts at the soil surface (Table 1; Marteinsson et al. 2015), and thereby enhanced the food sources for bacterial feeding nematodes. The Enrichment Index is an
indicator of the resources available to the soil food web and is based on therelative abundance of both bacterial- and fungal-feeding nematodes, which have short life cycles (Ferris et al. 2001). When food resources increase, these nematodes (especially bacterial feeders) tend to respond quickly, reaching high population densities, albeit often for a short period (Ferris et al. 2001). The lack of a significant response in EI was surprising and must be explained by the increase in short-lived fungal feeders and a relatively high proportion of bacterial feeders at S1. There the food sources did not come from increases in aboveground plant cover (Magnússon et al. 2014), but must have stemmed from the increased root exploration and biomass which has been shown by Stefansdottir et al. (2014) to occur with plant age in this habitat. This could have resulted in increasing populations of soil fungi, which may serve as a food source for the fungal feeders there. However, the low SOM stocks (Leblans et al. 2014), low soil bacterial counts (Marteinsson et al. 2015) and soil respiration rates (Sigurdsson & Magnusson 2010) of S1 do not help to explain this apparent lack of response in EI.
The Structure Index is based on the relative abundance of nematodes with longer life cycles and more stable population dynamics, which are located on higher trophic levels (omnivores and predators) (Ferris et al. 2001). Overall, the SI values were lower than expected for the later successional stage of S2. This could also be seen in the similar and low c-p values between the nematode communities, but the c-p value indicates the place of the taxon on a colonizer-persister (c-p) continuum of 1 to 5 (Ferris et al. 2001). The significantly higher SI values in the S2 topsoil gave indications that a more structured nematode community had started to develop there. This change was, however, mainly explained by the higher occurrence of only one genus, the omnivorous Aporcelaimellus.
The Channel Index values indicate the predominant OM decomposition pathway in the soil (Ferris et al. 2001), i.e. whether it is dominated by fungi or bacteria. The trend for higher CI values at S1 indicated contrasting
organic matter decomposition in the two seres. Across all gull-influenced plots of S2 the bacterial energy channel was predominant over the fungal, while in all plots at S1 the fungal channel predominated. The results of Marteinsson et al. (2015; shown in Table 1) on bacterial counts in surface soils at S1 and S2 partly support this finding, but no study has yet compared fungal biomass at S1 and S2. In total, 33 soil fungal species have been recorded on Surtsey (Henriksson & Henriksson 1974, Eyjolfsdottir 2009). An interesting extension of the present work would be a further study on the occurrence and growth of soil fungi on Surtsey, since they clearly play an important role in the island’s food web, especially in the more infertile areas.
CONCLUSION
Even if only minor changes have been observed in vegetation composition and cover during the past two decades in the infertile areas outside the gull colony (Magnússon et al. 2014), the present study showed that the soil nematode communities there have continued to change and the number of taxa to increase, probably indicating gradual changes in the soil environment. Within the gull colony (S2), where vegetation succession and soil development has been greatly accelerated (Table 1 and references therein), the nematode communities had increased in abundance and now showed more structured food webs, but still with fewer taxa than at S1. It will therefore be interesting to follow the nematode succession further into the future; on one hand it may seem likely that the number of nematode taxa may start to decrease at S1 when the infertile Leymus-Honckenya
plant community gradually changes into more fertile grassland, but on the other hand more time may still be needed for nematode taxa from higher trophic levels to reach the island and for soil development to continue at S2, which may reverse the declining diversity trend seen there at present.
ACKNOWLEDGEMENTS
of Natural History and the Icelandic Coast Guard provided logistical support for the present study. Anette Th. Meier made the elevation map of the island and Bjarni E. Gudleifsson helped with extraction of soil nematodes. This work contributes to the ES1308 COST-ClimMani project and was initiated during the ESF-ClimMani project.
REFERENCES
Andrássy I 1976. Evolution as a basis for the systematization of nematodes. Akadémiai Kiadó, Budapest, 288 p.
Andrássy I 1981. Revision of the order Monhysterida (Nematoda) inhabiting soil and inland waters. Opuscula Zoologica Budapest 17-18, 13–47.
Andrássy I 1983. A taxonomic review of the suborder Rhabditina (Nematoda: Secernentia). ORSTOM, Paris, 241 p.
Bongers T 1988. De nematoden van Nederland. [The nematodes of the Netherlands].Stichting Uitgeverij Koninklijke Nederlandse Natuurhistorische Vereniging, Utrecht, 408 p. [In Dutch].
Bongers T 1990. The maturity index: An ecological measure of environmental disturbance based on nematode species composition. Oecologia 83, 14–19.
Bongers T 1999. The maturity index, the evolution of nematode life history traits, adaptive radiation and cp-scaling. Plant and Soil 212, 13-22.
Bongers T, van der Meulen H & Korthals G 1997. Inverse relationship between the nematode maturity index and plant parasite index under enriched nutrient conditions. Applied Soil Ecology 6, 195-199. doi: http://dx.doi.org/10.1016/S0929-1393(96)00136-9.
de Goede RGM & Bongers T 1994. Nematode community structure in relation to soil and vegetation characteristics. Applied Soil Ecology 1, 29–44. doi: http://dx.doi.org/doi:10.1016/0929-1393(94)90021-3.
de Goede RGM, Verschoor BC & Georgieva SS 1993. Nematode distribution, trophic structure and biomass in a primary succession of blown-out areas in a drift sand landscape. Fundamental and Applied Nemalology 16, 525-538.
del Moral R & Magnússon B 2014. Surtsey and
Mount St. Helens: A comparison of early succession rates. Biogeosciences 11, 2099-2111. doi; http:// dx.doi.org/doi:10.5194/bg-11-2099-2014.
Doblas-Miranda E, Wardle DA, Peltzer DA & Yeates GW 2008. Changes in the community structure and diversity of soil invertebrates across the Franz Josef Glacier chronosequence. Soil Biology and Biochemistry 40, 1069-1081. doi: http://dx.doi.org/doi:10.1016/j.soilbio.2007.11.026
Eyjolfsdottir GG 2009. Investigation of the funga of Surtsey 2008. Surtsey Research 12: 105–111.
Ferris H, Bongers T & de Goede RGM 2001. A framework for soil food web diagnostics: Extension of the nematode faunal analysis concept. Applied Soil Ecology 18, 13–29. doi: http://dx.doi.org/ doi:10.1016/S0929-1393(01)00152-4.
Flegg JJM & Hooper DJ 1970. Extraction of free-living stages from soil (In Laboratory methods for work with plant and soil nematodes, ed. J.P. Southey), Technical Bulletin of Ministry of Agriculture, Fisheries and Food London, 2, 5–23.
Freckman DW 1988. Bacterivorous nematodes and organic-matter decomposition, Agriculture, Ecosystems and Environment 24, 195-217.
Frederiksen HB, Kraglund H-O & Ekelund F 2001. Microfaunal primary succession on the volcanic island of Surtsey, Iceland. Polar Research 20, 61–73.
Fridriksson S 1965. Biological records on Surtsey. Surtsey Research Progress Report 1, 19-22.
Fridriksson S 1992. Vascular plants on Surtsey 1981-1990. Surtsey Research Progress Report 10, 17-30.
Goodey T 1963. Soil and freshwater nematodes. John Wiley and Sons, New York, 544 p.
Háněl L 2001. Succession of soil nematodes in pine forests on coal-mining sands near Cottbus, Germany, Applied Soil Ecology 16, 23-34. doi: http://dx.doi.org/doi:10.1016/S0929-1393(00)00101-3
Hedin H 1978. On the terrestrial microfauna of Surtsey during the summer of 1976 with special reference to the Ciliates. Surtsey Research Progress Report 8, 47-50.
Henriksson LE & Henriksson E 1974. Occurrence of fungi on the volcanic island of Surtsey, Iceland,
Acta Botanica Islandica3, 82-88.
Hohberg K2003. Soil nematode fauna of afforested mine sites: Genera distribution, trophic structure and functional guilds, Applied Soil Ecology 22, 113-126. doi: http://dx.doi.org/doi:10.1016/ S0929-1393(02)00135-X
Holmberg O & Pejler B 1972. On the terrestrial microfauna of Surtsey during the summer 1970. Surtsey Research Progress Report 6, 69-72.
Ilieva-Makulec K 2001a. A comparative study of the life strategies of two bacterial-feeding nematodes under laboratory conditions I. Influence of culture conditions on selected life-history parameters of Acrobeloides nanus (de Man 1880) Anderson 1968 and Dolichorhabditis dolichura (Schneider 1866) Andrássy 1983. Polish Journal of Ecology 49, 29–43.
Ilieva-Makulec K 2001b. A comparative study of the life strategies of two bacterial-feeding nematodes under laboratory conditions II. Influence of the initial food level on the population dynamics of Acrobeloides nanus (de Man 1880) Anderson 1968 and Dolichorhabditis dolichura (Schneider 1866) Andrrássy 1983. Polish Journal of Ecology 49, 123–135.
Ilieva-Makulec K & Gryziak G 2009. Response of soil nematodes to climate-induced melting of Antarctic glaciers. Polish Journal of Ecology 57, 811-816.
Ilieva-Makulec K, Olejniczak I & Szanser M 2006. Response of soil micro- and mesofauna to diversity and quality of plant litter. European Journal of Soil Biology 42, 244–249. doi: http://dx.doi.org/ doi:10.1016/j.ejsobi.2006.07.030.
Ingham RE, Trofymow JA, Ingham ER & Coleman DC 1985. Interactions of bacteria, fungi, and their nematode grazers: Effects on nutrient cycling and plant growth. Ecolological Monographs 55, 119-140.
Ingimundardóttir GV, Weibull H & Cronberg N 2014. Bryophyte colonization history of the virgin volcanic island Surtsey, Iceland. Biogeosciences 11, 4415-4427. doi: http://dx.doi.org/doi:10.5194/ bg-11-4415-2014.
Kuzmin LL 1976. Free-living nematodes in the tundra of western Taimyr. Oikos 27, 501-505.
Leblans N, Sigurdsson BD, Roefs P, Thuys R, Magnússon B & Janssens, IA 2014. Effects of seabird nitrogen input on biomass and carbon accumulation after 50 years of primary succession on a young volcanic island, Surtsey. Biogeosciences 11, 6237-6250. doi: http://dx.doi.org/doi:10.5194/ bg-11-6237-2014.
Magnússon B, Magnússon SH, Ólafsson E & Sigurdsson BD 2014. Plant colonization, succession and ecosystem development on Surtsey with reference to neighbour islands. Biogeosciences 11, 5521-5537. doi: http://dx.doi.org/doi:10.5194/ bg-11-5521-2014.
Marteinsson V, Klonowski A, Reynisson E, Vannier P, Sigurdsson BD & Ólafsson M 2015. Microbial colonisation in diverse surface soil types in Surtsey and diversity analysis of its subsurface microbiota. Biogeosciences 12, 1191-1203. doi: http://dx.doi. org/doi:10.5194/bg-12-1191-2015.
Schiemer F 1983. Comparative aspects of food dependence and energetics of free-living nematodes. Oikos 41, 32-42.
Sigurdsson BD & Magnusson B 2010. Effects of seagulls on ecosystem respiration, soil nitrogen and vegetation cover on a pristine volcanic island, Surtsey, Iceland. Biogeosciences 7, 883-891. doi: http://dx.doi.org/doi:10.5194/bg-7-883-2010.
Sohlenius B 1972. Nematodes from Surtsey. Surtsey Research Progress Report 6, 97-98.
Sohlenius B 1974. Nematodes from Surtsey II. Surtsey Research Progress Report 7, 35.
Sohlenius B 1988. Interactions between two species of Panagrolaimus in agar cultures. Nematologica 34, 208–217.
Sokal RR & Rohlf FJ 1981. Biometry. W.H. Freeman and Company, San Francisco, 859 p.
Southwood TRE 1978. Ecological Methods. Chapman and Hall, London, 524 p.
Southwood TRE & Henderson PA 2000. Ecological Methods. Blackwell Science Ltd, London, 575 p.
Stefansdottir G, Aradottir AL & Sigurdsson BD 2014. Accumulation of nitrogen and organic matter during primary succession of Leymus arenarius dunes on the volcanic island Surtsey, Iceland. Biogeosciences 11, 5763-5771. doi: http://dx.doi. org/doi:10.5194/bg-11-5763-2014.
E & McLaren D 1988. Nematodes of the Krakatau archipelago, Indonesia: a preliminary overview. Philosophical Transactions of the Royal Society of London. Series B 322, 369-378.
ter Braak CJF 1986. Unimodel models to relate species to environment. DLO-Agricultural Mathematics Group, Wageningen, the Netherlands, 266 p.
Wall JW, Skene KR & Neilson R 2002. Nematode community and trophic structure along a sand dune succession. Biology and Fertility of Soils 35, 293-301. doi: http://dx.doi.org/doi:10.1007/s00374-002-0478-0
Walker LR & del Moral R 2003. Primary succession and ecosystem rehabilitation. Cambridge University Press, Cambridge, UK. 458p. doi: http://dx.doi.org/doi:10.1017/cbo9780511615078
Wasilewska L 1970. Nematodes of the sand dunes in the Kampinos Forest. I. Species structure. Ekologia Polska 18, 429-443.
Wasilewska l 1979. The structure and function of soil nematode communities in natural ecosystems and agrocenoses. Polish Ecological Studies 5, 97-145, 1979.
Yeates GW, Bongers T, de Goede RGM, Freckman DW & Georgieva SS 1993. Feeding habits in soil nematode families and genera-an outline for soil ecologists. Journal of Nematology 25, 315–331.
Manuscript received 10 April 2015 Accepted 16 June 2015