This
Financial Stability Review (FSR)
is presented as part of Bank Indonesia»s
mission ≈to achieve and maintain rupiah value stability through maintenance of monetary stability
and development of financial system stability for the achievement of sustainable long-term national
development∆.
Published:
Bank Indonesia
Jl. MH Thamrin No.2, Jakarta Indonesia
Information and Order :
This FSR document is based on data and information as of September 2003, except when otherwise indicated. This FSR document is also available in pdf format at Bank Indonesia»s web site at http://www.bi.go.id
Inquiries, comments, and recommendations may be addressed to : Bank Indonesia
Directorate for Banking Research and Development Financial System Stability Bureau
Jl. MH Thamrin No.2, Jakarta, Indonesia Telephone : (+62-21) 381 7779, 7990
The FSR is published biannually with the following objectives:
•
To foster public understanding of financial system stability, both domestically and
internationally;
•
To analyze potential risks to financial system stability; and,
fsr
Financial Stability Review
F FF
FForeword vii E
E E E
Executive Summary xi
C C C C
Chapter 1 Overview 3
C C C C
Chapter 2 Development of Domestic and Interna-tional Economies 7
2.1. External Influences 7 7 7 7 7
2.2. Domestic Economic Conditions 9
Boks II.1 Will Property Become a Nightmare Again? 13
Boks II.2 Rocketing China : Threat or Opportunity? 15
C C C C
Chapter 3 Development of Banking Industry 19 3.1. Commercial Banks 19
3.1.1. Credit Risk 19 3.1.2. Liquidity Risk 31 3.1.3. Profitability 36 3.1.4. Capital 38 3.1.5. Market Risk 40 3.1.6. Operational Risk 42 3.2. Development of Sharia Banking 44 3.3. Development of Bank 45
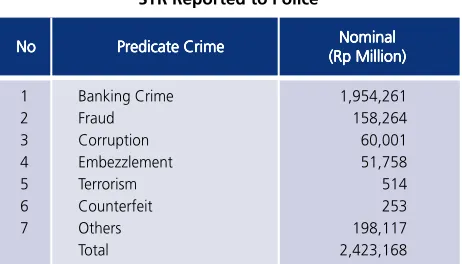
3.4. Law Enforcement 46
Boks III.1 Indonesian Banking Architecture, Blue Print
and Strategic Directions in the Future? 20
Boks III.2 Rigidity of Loan Interest Rates 22
Boks III.3 Undisbursed Loans 24
Boks III.4 Capital»s Resilience To Credit Expansion 27
Boks III.5 Stress Test of NPLs Impact on Capital 29
Boks III.6 Provisions for Earning Assets Losses (PEAL) 29
Boks III.7 Implications of Implementation of The New Guarantee Scheme 35
Boks III.8 Impact of IBRA»s Dissolution 43
C C C C
Chapter 4 Non-bank Financial Institutions 58 4.1. The Insurance Industry 58
2.2. The Pension Funds Industry 64
Boks IV.1 Bancassurance - Advantageous
for All Parties? 59
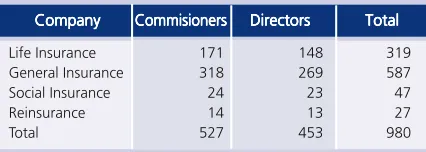
Boks IV.2 Implementation of the Regulation on Fit & Proper Tests in the Insurance Industry 63
C C C C
Chapter 5 Capital and Money Markets 69
5.1. Development of Indonesia»s Capital Market 69 5.2. Development of Indonesia»s Money Markets 75
Boks V.1 Mutual Fund 71
Boks V.2 Prospects for Issuance of Government
International Securities (SUN) (the Yankee Bond) 76
Boks V.3 Corporate Bond 78
Chapter 6 Payment System 81
Articles 85
I. Study on the Cost of Intermediation At Several Large Banks in Indonesia:Are Commercial Banks» Interest Rates on Credits Overpriced? 87 II. Early Indicators of Banking Crises 97
List Charts and Tables
Tables
Chart I.1 Asset Composition of Financial Institutions 3
Chart II.1 Developments of International Interest Rates 7
Chart II.2 Developments of 5 Major Trading Partner Countries» Economies 7
Chart II.3 Development of Inflation In 5 Major Trading Partner Countries 8
Chart II.4 Foreign Investments and Portfolio Invest-ments (Net) 8
Chart II.5 Developments of Composite
Stock Price Index and Rupiah Exchange Rate 9
Chart II. 6 Inflation and Consumer Loan 10 Chart II.7 2002 Supply and Demand for Logs 11 Chart II. 8 Developments of Average Leverage and
ROE of Several Textile Companies 14
Chart III.1 Number of Banks and Total Assets 19 Table II.1 Indonesia»s Balance of Payments (Million of
USD) 9
Table II.2 Government Financial Statistics 10 Table II.3 Number of Workers in Indonesia»s Textiles
and Related Products Industry 12 Table III.1 NPLs by Bank Group 30
Table III.2 Loans Concentration on 25 Largest Debtors (LD) 30
Table III.3 Development of Third Party Funds and NAV 32
Table III.4 Rural Bank Major Indicators 46 Table III.5 STR Reported to Police
Table V.1 Rating of Default Probability of Large Corporate Bonds 75
Charts
Chart III.4 Outstanding Credit by Bank Group 23 Chart III.5 Growth of Credits & Funds 23 Chart III.6 Credit Growth by Debtor Group 23 Chart III.7 Credit Growth by Certain Economic
Sectors (%) 23
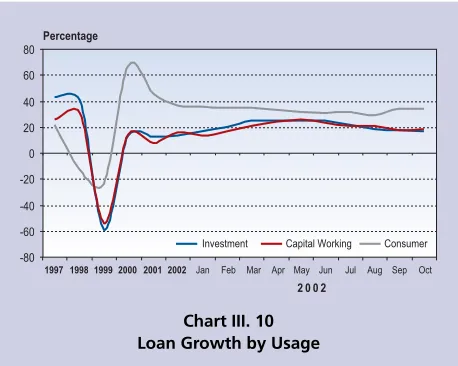
Chart III.8 Credit Development by Economic Sector 25 Chart III.9 Loan Development of Credit by Usage 25 Chart III.10 Loan Growth by Usage 25
Chart III.11 NPLs of Consumer Loans 25 Chart III.12 New Loans by Economic Sector 26 Chart III.13 2003 New Credits 26
Chart III.14 Development of Property Loan 26 Chart III.15 Growth (y to y) of Property Sector (%) 26 Chart III.16 Non Performing Loans 28
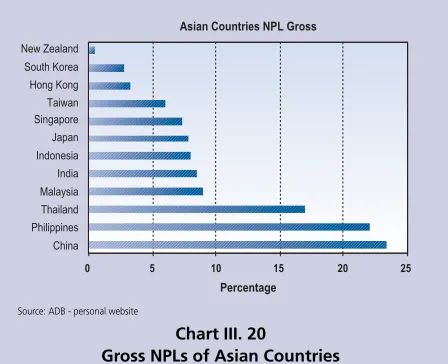
Chart III.17 Growth of Loans Classification 28 Chart III.18 Development of Outstanding NPLs 28 Chart III.19 2003 Ratio of NPLs to Capital 30 Chart III.20 Gross NPLs of Asian Countries 30 Chart III.21 Ratio of 25 Largest Debtors» to
Capital √ August 2003 31
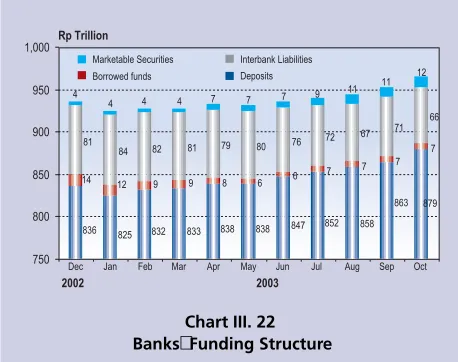
Chart III.22 Banks» Funding Structure 32
Chart III.23 Structure of Third Party Funds 32
Chart III.24 Composition of Time Deposits by Tenor 33
Chart III.25 Ownership of Third Party Funds by Core
Depositors 33
Chart III.26 Third Party Funds Ownership at 15 Big Banks 33
Chart III.27 Composition of Time Deposits by Amount 34
Chart III.28 Liquid Asset Ratio 34
Chart III.29 Ratio of Funds Channelled Over to Funds
Sources 34
Chart III.30 Ratio of Liquid Assets to Short-Term Liabilities at 15 Big Banks 36
Chart III.31 Non-Core Deposits to Liquid Assets 36
Chart III.32 Development of Net Interest Income 37
Chart III.33 Composition of Interest Income at 15 Big Banks 37
Chart III.34 Composition of Interest Income 37
Chart III.35 Efficiency Ratio 38
Chart III.41 CARs of Several Asian Countries 40 Chart III.42 Stress Test on Interest Rates 41 Chart III.43 Stress Test on Exchange Rates
at Bank ≈X∆ 41 Chart III.44 Total Assets 44
Chart III.45 Capital 44
Chart III.46 Deposits 44
Chart III.47 Financing 44
Chart III.48 Non Performing Loans 45
Chart III.49 ROA & ROE 45
Chart III.50 Development of Banking Cases Received by
UKIP (in number of banks) 47
Chart III.51 Development of Banking Cases, Where
Investigations Have been Stopped (in number of banks) 47
Chart III.52 Development of Banking Cases Transferred
to Law Enforcement Body (in number of banks) 47
Chart III.53 Completion of Banking Cases (cumulative)
47
Chart III.54 Types of Banking Violation Cases Followed-Up During 2003 (by number of cases) 48 Grafik III.55 STR reported to Police by Numbers of
Reports 49
Chart IV.1 Developments of Shares, Bonds, Mutual
Funds 57
Chart IV. 2 Asset Composition of Financial Institutions 58
Chart IV. 3 Total Non-Bank Financial Institutions 2000 √ June 2003 58
Chart IV. 4 ROA Value - Life and General Insurance
Companies 61
Chart IV. 5 ROE - Life and General Insurance
Compa-nies 61
Chart IV. 6 ROI Value √ Life and General Insurance
Companies 61
Chart IV. 7 Investment Composition of Insurance
Industry √ 2002 61
Chart IV. 8 Investment Composition of Insurance
Industry √ Quarter II/2003 61
Chart IV. 9 ROA & ROI Values - Pension Funds 65
Chart V.1 A Shift in The Role of Bank Loans Versus
Capitalization of Stock and Bond Markets 69
Chart V.2 Ratings of Indonesia and Other Developing
Countries 70
Chart V.3 Composite Stock Price Index and Volatility
72
Chart V. 4 Trend of Jakarta Financial Index (JFI) 73 Chart V. 5 Price Earning Ratio»s of Listed Bank 73
Chart V.6 Yield Curve of Indonesia Goverment Bond
73
Chart V.7 Maturity Profile of Goverment Bond 74
Chart V.8 Market Liquidity of Corporate Bond 74
Chart V.9 Development of SBI, Deposit, Interbank
Money Market Interest Rates 75
Chart V.10 Development of Interbank Money Market
Interest Rates and Transaction Volumes 77
Chart VI.1 Clearing Transaction 81
Chart VI.2 Unsetled RTGS Transaction 82
This financial system stability review provides a picture of the current state of financial system stability in Indonesia and its outlook as of end-2003.
As of the end of 2003, the condition of our financial system was stable with quite encouraging developments. It is expected that this will continue in 2004. However, there are still several problems that need close attention to prevent them from becoming constraints in the future.
Important developments during 2003 included rising international confidence as indicated by an upgrade in Indonesia»s debt rating as well as high foreign investors» interest in the sales of corporate shares and bonds. These were possible largely due to rupiah exchange rate stability, lower interest rates and inflation, as well as improving banking conditions. However, in the same year, the banking sector was strained for a time by several cases of fraud, which caused considerable losses for the banks concerned. This shows how implementation of good corporate governance needs to be stepped up by all parties, particularly those involved in financial systems management.
There were several other problems originating internally to the financial system, such as continuing high NPLs of banks, slow recovery of bank intermediation, and rigidity of interest rates on credits. Problems from the external side of the financial system, such as slow real sector recovery more competitive global markets, have also put pressure on our financial system development.
The downward trend in interest rates has prompted the public to shift some funds to the capital market, which has boosted the composite stock price index and the bond index in the capital market, up 63% and 66%, respectively from the previous year. Such growth has also boosted the mutual funds industry, which is up 56% from the year before. These are, of course, encouraging developments. However, there is a need to emphasize that rapid capital market expansion also has the potential to create new problems if it is not followed by improvements in infrastructure, such as better accounting systems, regulations and market discipline on market players.
Bank Indonesia»s determined efforts in building and maintaining stability of the financial system cannot be done properly without the support of related parties and institutions. For this, we express our appreciation and thanks to all contributors and participants in the hope that this document will assist the general public and related supervisory institutions in building a sense of joint concern and responsibility.
In closing, we welcome any suggestions, comments, and even critiques to enhance the the quality of this review in the future.
Jakarta, January 2004 Jakarta, January 2004 Jakarta, January 2004 Jakarta, January 2004 Jakarta, January 2004
In general, stability was maintained in the banking and
financial systems during 2003, as indicated by continuous
improvements in several banking and financial system
performance indicators. This condition was supported by
macroeconomic stability and relatively conducive
monetary conditions during the year, as indicated, for
example, by economic growth that reached its target and
by improved macroeconomic indicators that strengthened
domestic and international public confidence in the
Indonesian economy.
However, banks» dependence on income from
recapitalization bonds, continuing weak governance, and
limited risk management, could pose a threat to the
banking industry and financial system in the future. Also,
the real sector has not fully recovered and several business
sectors are susceptible to tough competition from other
countries. Both have the potential to cause banks» NPLs
to rise. Meanwhile, short-term foreign capital inflows are
on the rise; these tend to be volatile and could have a
negative impact on financial system stability and the overall
economy.
1. MACROECONOMIC STABILITY
Stable macroeconomic conditions that tended to
improve during 2003 have supported financial system
stability. The balance of payments, rupiah exchange rate,
and inflation rate all performed better than expected at
the beginning of the year, while economic growth achieved
the figure originally projected.
Improved economic indicators were greatly assisted
by consistent implementation of monetary and fiscal
policies. Relatively loose monetary policy during 2003
provided room for the real sector to recover without
reducing the purchasing power of the public. Meanwhile,
the implementation of a conservative and cautious fiscal
policy has helped to strengthen confidence in
macroeconomic stability which leaded to hold down
inflation, which in turn helped with the maintenance of
financial system stability.
On the external side, declining international interest
rates helped provide room for domestic interest rates to
fall without undermining the exchange rate. These
conditions contributed to strengthening economic players»
confidence, and no damaging shocks occurred. In the
future, if fiscal policy remains conservative and is adjusted
to the needs of economic growth, it would further benefit
financial system stability.
Nevertheless, economic and non-economic
fundamental conditions are worrisome. Economic growth
of around 4.55% during 2003 was within the range of
original projections, but it was not able to make any
progress on Indonesia»s unemployment problem. Open
unemployment is estimated at 10.1 million people or 9.8%
of the whole work force in 2003. Also, the growth to date
has not been able to lift per capita income back to its
pre-crisis level. In addition, the major factor behind economic
growth during 2003 was consumption growth of 5.1%.
In the long-term, high unemployment and economic
growth dependent upon consumption pose risks for the
economy.
Investment expanded by 1.6%. However, this
expansion was more for construction than machinery, and
consequently it did not have any meaningful impact on
production capacity. Manufacturing grew by only 2.4%,
Executive Summary
down from 4% in the previous year. However, this did not
push up prices due to smooth flows of imported goods
that suppressed inflation. On the downside, this could pose
difficulty for banks and other financial institutions in
determining interest rates on credits to be channeled to
the real sector. In the long-term, businesses that are not
able to compete with imported products have the potential
to go bankrupt, which could cause economic instability, if
it were to happen on a large scale.
For its part, the balance of payment»s structure was
less encouraging. Non-oil/gas exports were dependent
upon demand from several countries (mainly the US, Japan,
and Singapore), but remained dominated by five main
commodities (textiles, wood products, electrical appliances,
and footwear), which have many international competitors
(except for paper products). Nonetheless, repayment
capacity of exporting companies generally seemed not to
have been disrupted because free trade regulations have
not yet been fully enacted. On capital account, inflows
were dominated by short-term portfolio investment, which
is susceptible to reversals. Foreign direct investment, which
is more stable, was on the decline.
A policy of low interest rates, which was successfully
implemented during 2003, is expected to be continued
cautiously. The large gap in maturity profiles between
banking assets and liabilities would raise banking instability
if interest rates were changed suddenly and with violent
fluctuations. But, because exchange rate stability could
be maintained, exchange rate risk was relatively low, which
added to stability in the financial industry in 2003.
2. FINANCIAL SYSTEM STABILITY
Macroeconomic stability supported banking and
financial stability in 2003. The banking industry»s stability
was reflected in several performance indicators, which
capital. Meanwhile, Indonesia»s capital markets experienced
extraordinary development during 2003, with the stock
market»s performance ranking as the second best in the
world. The bond market also recorded rapid growth with
a tendency towards oversubscription at each new issuance.
For its part, the money market did not fluctuate in any
way that could have endangered financial stability, while
conditions at non-bank financial institutions were also
relatively stable. This was further supported by policy on
the non-cash payment system that has successfully reduced
systemic risk and increased the efficiency of payment
transactions. Nonetheless, in order to maintain financial
system stability, there are several matters that warrant close
attention such as bank intermediation that has not fully
recovered; weak corporate governance that leads to large
operational risk in the banking industry; the possibility of
rising NPLs; and a reduction in the coverage of the blanket
guarantee program.
2.1. Banking Industry
In general, stability of the banking industry during
2003 was bolstered by banks» control of credit risk. At the
same time, market risk was quite moderate, being
supported by adequate banking capital, a stable exchange
rate, lower interest rates, and a relatively small net foreign
currency position of banks (which, for example, averaged
4.70% of banking capital in quarter III-2003). During 2003,
banks still experienced excess liquidity, which was mostly
placed in SBIs and the interbank money market. The large
size of interbank borrowings could have a systemic risk.
However, no banks experienced a liquidity crisis during
2003. Nevertheless, the large size of maturity mismatches
at several recapitalization banks could have created
instability if interest rates were to fluctuate excessively.
The banking industry»s stability was further bolstered
by growing public confidence in the Indonesian banking
sector as indicated by confidence index surveys.
Improved banking conditions were generally reflected
in a rising rate of return on assets (ROA) during 2003,
from 1.9% (Dec«02) to 2.3% (y-t-d, Oct»03). This mainly
stemmed from banks» success in preventing a drop in their
net interest margins (NIM) in the face of declining interest
rates. During 2003, banks» NIM narrowed only modestly,
from 4.2% (Dec»02) to 3.8% (y-t-d, Oct»03). Also, banks»
CAR remained above the 20% level, which turned out to
be more than adequate to absorb business risks, particularly
credit risk, during 2003.
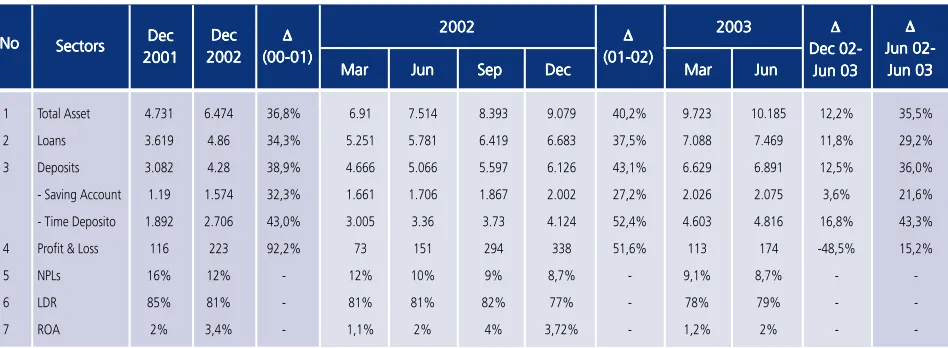
Rural Banks also did well during 2003, with asset
growth of 38.8%, reaching Rp10.4 trillion (June 2003).
Another indicator of improved performance was a rise in
the percentage of Rural Banks categorized as «sound» from
61.9% (June 2002) to 63.9% (June 2003). Sharia banks
had a similar experience, with strong growth in assets
(60%), third party funds (60%), and financing (50%) with
Capital Adequacy Ratio (CAR) reached 17%. In addition,
the quality of earning assets in the sharia banking industry
were in a sound condition as indicated by the level of
non-current financing, which was below 5%. In general, the
sharia banking industry also had a good level of earnings,
although in 2003 it did record a sizable drop due to large
expansion, which incurred sizable infrastructure costs.
However, several matters that arose during 2003
warrant close review, particularly concerning bank loan
and capital. As regards development of bank loan, growth
in outstanding loan and new loan extensions during 2003
were down from the year before. Also, there was a rise in
undisbursed banking loans to Rp25.6 trillion (Jan - Oct
»03), up from the previous year»s Rp19.1 trillion (Jan-Oct
«02). The slowdown in credit channeling was partly related
to on-going rigidity in interest rates on credit, which did
serve to protect banks» profitability. Excess liquidity and
limited lending have prompted banks to depend on SBIs
and bonds for interest income. Unfortunately, this does
not boost economic growth, which in the long run could
disrupt financial stability.
During 2003, credit channeling continued to be
dominated by consumer credit. In line with the downward
trend of interest rates, consumer credit channeling was
on a rising trend (33.8%, y-o-y), far larger than the rises
of working capital and investment credits of 16.9% and
7.4%, respectively. This rapid expansion of consumer
credits risks higher NPLs, if economic growth were to
decline.
Meanwhile, outstanding property credit reached
Rp43.9 trillion (Oct »03) or 10.3% of total banking credits,
up Rp35.0 trillion from its position at December 2002.
This rapid increase is also susceptible to rising NPLs if
unemployment were to rise due to layoffs.
The aggregate CAR during 2003 ranged between
20% - 26%, with 17 (out of 138 banks) having CARs
between 8% √ 10%; of these, one was a large bank. Six
banks had CARs at between 10% √ 15%. This figure was
quite susceptible to changes in the quality of earning assets
and in the method of calculation to includes risk
components in addition to credit risk.
2.2. Non-Bank Financial Institutions
The downward trend in interest rates prompted
several insurance and pension funds industries to shift their
fund placements from deposits to capital market products
in order to minimize income declines.
During 2003, the insurance industry experienced
some restructuring to enable it to face rising competition,
fulfillment of minimum risk-based capital, and new
regulations, such as fit and proper tests. Still, lower interest
rates impacted directly on the earnings of funds managed
by the insurance and pension funds industries. To tackle
Executive Summary
structures from placements in banking products (deposits)
to capital market products (shares, bonds, and mutual
funds). However, this shift has not prevented a decline in
returns (ROA, ROI, and ROE). This was due to high
operational costs resulting from competition on premiums
and commissions as well as still inefficient business
activities.
2.3. Capital and Money Markets
Rapid growth of the stock market has the potential
to cause an overpriced situation. This could spur instability
in the future if it is not followed by implementation of
good governance, among others in the form of adequate
transparency. The extraordinary development that occurred
in Indonesia»s stock market during 2003 resulted in this
market having the second best record in the world after
Thailand. Several developments that boosted the capital
market»s performance were the downward trend in global
interest rates, improvements in several macroeconomic
indicators, and stable political and security conditions.
Despite a sell-off for a time in the wake of the bomb
incident at the JW Marriot Hotel, positive developments
(such as continued declines in SBI rates and improvements
in the quality of issuers) soon prompted a recovery. The
composite stock price index was at a low of 379.351 on
11 March 2003, but recovered very well, closing the year
at 691.90, the highest level in 2003. This rise of 82% was
only exceeded by Thailand»s bourse, which soared by
115.6% (Jan-Dec 2003). The stock market in 2003 also
benefited from the successful initial public offerings of
three large state-owned companies (Bank Mandiri, BRI,
and Perusahaan Gas Negara), which received an
enthusiastic response from domestic and foreign investors.
Meanwhile, the bond market also experienced rapid
growth with a trend toward oversubscription with each
One of the factors encouraging bond issuance was
continuing high credit rates at banks and the rising demand
for mutual funds with bonds as assets. Rapid development
of the bond market was further indicated by bond
issuances, which reached Rp24.7 trillion in 2003 out of
total bonds traded at the Surabaya Stock Exchange of
Rp46.2 trillion (November 2003). The 2003 issuance was
the largest in the history of Indonesia»s capital market. In
the secondary market, bond trading during 2003 was
active with prices increasing to an average of 99.4% of
nominal values (November 2003), compared to 95.31%
at the beginning of 2003). These developments warrants
close attention because if the bond issuers use these funds
for high-risk business activities, it would heighten credit
risk, including risk of systemic default.
Rapid expansion in the mutual funds marketƒ
without implementation of adequate accounting
standardsƒ risk a loss of customer confidence. Mutual
funds» NAV rose by 482.4% to Rp46.6 trillion in 2002
followed by a further rise of 70% to Rp79.2 trillion during
2003 (Jan-Oct). One of the reasons for the rise in mutual
funds» NAV was vigorous tradings of corporate and
government bonds in the secondary market. Most mutual
funds (85.2% in October 2003) were of the fixed-income
type with bonds as their major asset. This rapid growth
ended in October 2003, when there were large-scale
redemptions due to rumors of a change (to
marked-to-market) in the method for calculating mutual funds» NAV.
Consequently, there was a drop in mutual funds» NAV from
Rp85.9 trillion (September 2003) to Rp79.2 trillion (October
2003) because investors withdrew their funds.
During 2003 in the interbank money market, interest
rates trended downward in line with declines in SBI interest
rates. Interest rates in the morning and afternoon money
funds could not be quickly channeled to credits.
Nonetheless, lower interest rates in the money market did
not boost bank intermediation.
Turning to the payment system, credit and settlement
risk have eased considerably with implementation of the
real time gross settlement (BI-RTGS) system, whose
coverage now reaches over all of Indonesia. But despite a
major shift in transactions to the BI-RTGS system, the older
clearing system still has an important role in executing
payment transactions.
3. 2004 OUTLOOK
Macroeconomic and financial system stability are
expected to be maintained in 2004. With a stable rupiah
exchange rate, low inflation, and a downward trend of
interest rates, economic growth is projected to rise, although
it would still not be able to absorb all additions to the work
force. The main factor boosting growth is expected to be
domestic demand, particularly consumption. Global
economic conditions are forecast to improve in 2004, and
this would give a boost to the financial system, particularly
as regards credit extensions. However, several constraints
would remain due to difficulties in improving economic and
non-economic fundamentals, which in turn would cause
risk to remain high.
Based on developments in 2003 and economic
prospects for 2004, commercial banks» are expected to
remain stable in 2004. However, several conditions warrant
close review due to their potential for hampering
improvement of NPLs and banking performance, which
could disrupt banking stability.
Banking credits are projected to expand in line with
improving economic performance. In particular, improved
prospects for international commodity prices (especially
primary non-oil/gas commodities) and manufacturing due
to rising demand in export markets would have a positive
impact on the domestic business climate, which would
raise demand for bank credits. However, there would be
several factors that could pose problems on the supply
side, including: (i) weak implementation of risk
management by banks remaining high risk perceptions
from the banking system towards credit; and (ii) high credit
interest rates due to declining interest income from SBIs
and bonds, as well as banks» inefficient business operations.
Meanwhile, on the demand side, demand for credits would
be limited by more attractive alternative funding sources
outside banking credits such as the issuance of bonds and
shares.
Banks» NPLs are estimated to remain below the
indicative target of 5% because banks are expected to
provision against (gross) NPLs through adequate Provisions
for Earning Assets Losses (PEAL). Another factor would be
banks» very conservative behavior in extending credits due
to perceptions of high risk. Consequently, NPLs (gross)
would tend to rise in 2004. Several conditions would
prompt this rise, such as ex-IBRA and restructured credits.
Furthermore, structural problems such as legal uncertainty
related to regulations and their enforcement would pose
constraints on banks» attempts to improve their NPLs.
The composition of banks» income is estimated to
continue improving during 2004 in line with rising credit
volume and credit»s share in banks» earning assets.
However, this rise would not significantly boost banks»
profitability due to several remaining problems, such as (i)
relatively large components of banks» income whose
sustainablity is doubtful, i.e. non-interest income, which
mostly comes from fluctuanting trading activities as well
as write backs provisioning coming from credit
restructuring and sales of NPLs; and (ii) rising costs due to
deterioration in the quality of banks» credits that require
more provisioning (PEAL).
On the capital side, banks» overall CAR is estimated
to remain well above 8%. However, there could be
Executive Summary
Weighted Assets due to higher credits, (ii) difficulty in
building up capital from profits because several banks tend
to distribute dividends despite low profitability, and (iii) a
potential rise in NPLs (gross).
However, on the bank liquidity side, growth of third
party funds is expected to come under pressure, due to
factors such as: (i) a downward trend in interest rates; (ii)
a decline in the guarantee interest rate, which limits banks»
flexibility in setting interest rates on deposits; as well as
(iii) competition from mutual funds and corporate bonds,
which offer more attractive returns for fund owners.
Based on current growth trends, the sharia banking
industry is estimated to reach asset values of Rp12 - 13
trillion by end-2004 compared to Rp7 trillion at present.
As such, the percentage of sharia banking operations could
exceed 1% of the national banking industry»s total
business. Even higher asset growth is possible because of
plans by one conventional bank to change to a sharia bank
and by several conventional banks to open sharia units.
However, if expansion continues this rapidly, challenges
sharia banking will face increasing challenges, particularly
on the sides of risk management and capital.
Continuing previous years» developments, the Rural
Bank industry is also expected to expand rapidly. This will
be assisted in part by its captive market comprising
customers from communities in urban suburbs and villages
that are not served by commercial banks. However, several
constraints could hamper growth, among others: (i) a
relatively low quality of Rural Bank human resources; (ii)
insufficient numbers of Rural Bank supervisors; and (iii)
relatively inefficient business activities as indicated by
extremely high credit rates charged by Rural Banks.
As was the case in 2003, the insurance and pension
funds industries would continue to face problems with
funds management due to a continuing downward trend
efficiency and capital in preparation for merger or
acquisition. Meanwhile, the pension funds industry, which
been extremely conservative to date in its investment
strategy (as indicated by a large share of bank deposits),
will need to implement adequate risk management in
support of its desire for higher-yielding, long-term
placements.
Many analysts expect that the capital market will not
grow as rapidly in 2004 as it did in 2003. Investors that
have aggressively placed funds during 2003 are pulling
back somewhat, adopting a wait- and-see attitude.
Similarly, several businesses that have used the opportunity
to raise funds in the capital market during 2003 will wait
for indications that the market will accept new issuances
of their debt at better prices. However, if the national
general election agenda proceeds smoothly, investors √
domestic and international√ might rush to invest in
Indonesia.
Meanwhile, the money market is not expected to
experience any meaningful change in line with continued
trends towards lower interest rates and excess liquidity.
Concerning implementation of the payment system,
it is necessary to step up monitoring and supervision of
the system in accordance with international standards
(Core Principles for Systemically Important Payment
Systems √ CP-SIPS set the BIS). In addition, it is necessary
to make efforts to further develop that system in terms of
capacity and to mitigate operational risk.
4. POLICY DIRECTIONS FOR THE FUTURE
In line with continued accommodative monetary
policy and closer coordination between monetary and fiscal
policy, rehabilitation and enhancement of the banking
system»s resilience needs to be continued. Within the
bureau. Meanwhile, in order to safeguard stability,
elimination of the blanket deposit guarantee needs to be
undertaken gradually and cautiously. In this regard, the
implementation of prudential banking principles in
accordance with international standards need to be
continued.
Implementation of good risk management by banks
is vital. Risk management that is incorporated into bank»s
operations will support the creation of good governance
and minimize criminal banking practices. This ranges from
making misrepresentation to the public, through window
dressing of balance sheets and incorrect reporting, up to
fraud, such as has occurred recently. If these problems are
not seriously addressed by the supervisory authority and
other players in the banking industry, such cases will recur.
This will further undermine public confidence, which has
still not recovered fully.
One of the ways to implement good risk
management is by banks knowing their customers well.
This can be achieved by information sharing between banks
through a credit bureau, which is one effective way to
prevent fraud. Several recent cases of fraud were
undertaken by the same people and companies with the
same modus operandi.
The government plan to phase out the deposit
guarantee program could have a wide impact on the
banking industry. If thorough preparations and calculations
are not made at an early stage, this could result in public
funds shifting from one bank to another (a flight-to-quality)
or to outside the banking industry, particularly on the part
of depositors.
In order to minimize this risk, reduction of the
guarantee needs to be done gradually. In addition,
reduction of the guarantee program needs to executed in
parallel with elements of the financial safety net, especially
the lender of last resort (LOLR) facility from Bank Indonesia.
LOLR can function as a contingency plan in anticipating
the negative impact of a decline of public confidence in
the banking industry while the guarantee program is being
narrowed.
As was the case in 2003, Bank Indonesia plans to
enhance several regulations during 2004, particularly those
related to prudential principles. The plan is to issue
regulations concerning several matters, including the
quality of earning assets, provisions for earning assets
losses, credit restructuring, and a limit on credit extensions.
In addition, BI will issue new guidelines for bank soundness
(CAMELS), which is planned to be effective in December
2004. This is intended more as a supervisory tool for BI
and for determination of action plans in the framework of
problem identification and problem resolution of certain
aspects of banks» operations. Meanwhile, in order for
implementation of the guidelines to function well, a trial
run will be undertaken on the June 2004 position for all
banks. In line with enhancement of the regulation on
bank»s soundness level, BI plans to enhance regulations
concerning banks» business plans.
As regards the end of the tenure of the Indonesian
Banking Restructuring Agency»s (IBRA) in February 2004,
BI plans to adjust BI regulation number 3/25/PBI/2001
dated 26 December 2001 concerning «Determination of
With the financial industry»s ownership, organization,
operations, and products becoming more integrated,
instability in one type of institution can have an impact on
other financial institutions, with increasing systemic risk.
Within the financial industry, banking is still very important
in determining financial system stability, as it accounts for
some 91% of total assets of the financial system. However,
this does not mean that other types of financial institutions
can be ignored in the maintenance of financial system
stability. Recently, bank product innovation and
non-bank financial institutions have developed rapidly, in line
with heightening competition and customers» increasing
understanding of financial products.
In general, macroeconomic conditions were stable
and tended to improve during 2003, which has raised
public and investor confidence in Indonesia»s economy.
These conditions made a positive contribution to financial
system stability. Improvements of economic development
indicators were largely supported by consistent
implementation of monetary and fiscal policies. However,
economic growth that is largely dependent upon
consumption is quite susceptible to rising banks» NPLs, if
economic activity were to deteriorate.
On the external side, the downward trend in
international interest rates has helped in lowering domestic
interest rates without weakening the exchange rate. This
stability is expected to continue in 2004. However, rising
competition and protectionism by certain countries could
disrupt export performance. In the long-term, domestic
businesses that are not able to compete with imported
products will likely go bankrupt, which could generate
economic instability.
Macroeconomic stability in 2003 was bolstered by
the maintenance of banking and financial system stability.
Despite several potential problems, the banking industry»s
stability continued to improve during 2003, as evidenced
by several performance indicators. In addition, credit,
liquidity, and market risks were relatively controlled, while
implementation of operational risk needs to be closely
watched.
Meanwhile, Indonesia»s capital market experienced
relatively rapid development during 2003. Indeed, the stock
market»s performance was the second best in the world.
The bond market also experienced rapid growth with a
trend towards oversubscription with each new issuance.
The money market also did not show any fluctuations,
which could endanger financial stability, since banking
tended to be overliquid.
The downward trend in interest rates has forced the
insurance and pension funds industries to shift the
composition of their investment portfolios from deposits
to capital market products in order to minimize loss of
revenues. Nevertheless, performance of these two
industries did deteriorate in 2003.
The generally stable condition of the financial system
was assisted by the policy on the non-cash payment
Chapter 1:
Overview
Chart I.1
Asset Composition of Financial Institutions
Banking 91%
Pension Fund 3%
Insurance Corporation 3% Leasing
Company 2% Securities Company 1% Pawn Shop
Overview
system, which has been successful in reducing systemic
risk and enhancing the efficiency of payment
transactions.
Looking ahead to 2004, in line with economic
growth and conducive macroeconomic conditions, the
capital market»s performance is expected to continue on
a strengthening trend. However, many parties see the
potential for a decline in market activity. This would be
due to market players adopting a wait-and-see attitude
because of the socio-political agenda for that year,
although this would not entail any meaningful fluctuations.
If the general election proceeds smoothly, investors, both
domestic and international, are expected to rush to invest
their funds in Indonesia. For their part, money market
conditions are not expected to experience any meaningful
Chapter 2
Generally speaking, macroeconomic conditions during
2003 were stable and trended to improve, as indicated
by several improved macroeconomic indicators. This
situation had a positive impact on public and investors»
confidence in the Indonesian economy, which was
already on the mend. An improving national economy
was largely supported by consistent implementation of
monetary and fiscal policies. However, economic
growth, which is still largely dependent on consumption,
is susceptible to many potential shocks. The immediate
impact on the financial system, particularly the banking
sector, would be higher NPLs and a lower quality of
earning assets. On the external side, the downward
trend in global interest rates has helped to reduce
domestic interest rates without a negative impact on
the exchange rate (Chart II.1), and it is expected that
this stability will be maintained in 2004. However, rising
competition and the imposition of limits on imports by
certain countries could disrupt performance of the
domestic business sector, partly because Indonesia»s
products are uncompetitive in world markets.
2.1 External Influences
World economic growth has not fully recovered due
to several large countries» economies that remain sluggish.
(Chart II.2). This was marked by continuing low GDP
growth in the US, Japan, and Singapore, which were
Indonesia»s major trading partners in 2003. Development
of the world economy in semester I/2003 tended to
weaken due to the Iraqi war involving the US, which is a
superpower with major economic influence. In addition,
the outbreak of severe acute respiratory syndrome (SARS)
in several Asian countries and Canada weakened the global
economy. In this regard, in April 2003, the IMF
downgraded its projection on global economic
performance by 0.5% (from its September 2002 projection)
to 3.2%. Still, this figure is slightly higher than 2002 real
growth of 3%.
In order to stimulate domestic economies and to
revive capital markets, several countries have lowered
interests rates (Chart II.2). On 3 June 2003, the European
Central Bank lowered its refinancing interest rate by 0.5%
to an historical low of 2%. On 25 June 2003, the US
Chapter 2
Development of Domestic and International Economies
Chart II.1
Developments of International Interest Rates
Chart II.2 Developments of 5 Major Trading Partner Countries» Economies
Percentage
0 1 2 3 4 5 6 7
1998
1997 1999 2000 2001 2002 Q.1/03 Q.2/03 Q.3/03 Q.4/03
LIBOR (1 Month) SIBOR (1 Month) Fed Funds Rate
Percentage
USA Japan
Singapore China South Korea
-8 -6 -4 -2 0 2 4 6 8 10 12
Chapter 2 Development of Domestic and International Economies Development Of Domestic
Federal Reserve lowered the Fed Funds rate by 0.25% to
1%, its lowest since 1958. The Bank of England reduced
its cut-base rate by 0.25% to 3.75%, its lowest since 1955.
Low world inflation, particularly in several advanced
countries, and rupiah appreciation have helped to lower
Indonesia»s inflation rate (Chart II.3). During 2003, the
non-oil/gas commodity price index rose sharply in international
markets, from 2.6 as of December 2002 to 12.8 as of
December 2003 . This rise in non-oil/gas commodity prices,
which is partly a result of the USD depreciation, and a rise
in world oil prices have boosted Indonesia»s exports by an
estimated 4.4% in 2003, despite limited recovery in the
economies of Indonesia»s trading partner countries. Higher
exports would increase exporters» incomes, which would
improve the quality of earning assets in the financial system.
The downtrend in international interest rates during
2003 along with growing worries over the enormous US
current account deficit have spurred investors to shift their
capital to developing countries in Asia and Latin America,
which offered more attractive yields. This was supported
by improving Asian countries» ratings. For example,
Indonesia»s rating was upgraded one level by international
rating institutions (Moody»s, Standard & Poor, Fitch) to the
equivalent of BB with stable prospects (Moody»s). In Asia,
foreign investment mostly came into countries with
economies that were considered to be stronger, such as
China, Vietnam and Thailand. In Indonesia, the investment
climate remains troublesome, causing foreign capital
inflows to be dominated by portfolio investment (Chart
II.4), such as purchases of shares and bonds. During 2003,
inflows of portfolio investment totaled USD1.4 billion, up
from the previous year (USD1.2 billion). Although these
short-term capital inflows are supportive of the
development of Indonesia»s capital market, they have the
potential to put pressure on the financial system due to
their short-term nature and therefore, potential quick
reversals. Also, these short-term capital inflows do little
to help with the real sector»s recovery.
Improving macroeconomic indicators and the
government»s plan to remain conservative as regards fiscal
policy in 2004 are the main factors promoting financial
system stability. Supported by a stable rupiah exchange
rate, low inflation, and a downward trend in interest rates,
domestic demand, particularly consumption, is boosting
economic growth.
In addition, global economic conditions are expected
to improve in 2004, triggered by rising economic growth
in several advanced countries and within the Asian region.
The IMF has forecast (November 2003) that world
economic growth in 2004 would reach 4.3%. This growth
Chart II.3 Development of Inflation Chart II.4
Percentage
1998 1999 2000 2001 2002 Q.1/03 Q.2/03 Q.3/03
-2 -1 0 1 2 3 4 5
South Korea USA Japan China Singapore
(Million of USD)
-9,000 -8,000 -7,000 -6,000 -5,000 -4,000 -3,000 -2,000 -1,000 0 1,000 2,000
FDI (net) Portfolio Investment (net) Others (net) Total
would largely stem from advanced countries, such as the
US, Japan, and those in the European region of 4.3%,
1.5% and 2.2%, respectively, higher than the previous
projection (September 2003) of 3.9%, 1.4% and 1.9%.
This situation has the potential to lift export growth
appreciably. If this opportunity is seized by Indonesian
exporters, it will make a sizable contribution to the
maintenance of financial sector stability.
2.2 Domestic Economic Conditions
During 2003, domestic macroeconomic conditions
tended to improve and this has contributed significantly
to financial system stability.
The balance of payments, particularly the current
account, strengthened in 2003 as evidenced by a rise in
foreign currency revenues from exports, which were up
from USD59,165 million in 2002 to USD62,891 million
in 2003 (Table II.1). Capital flows also bolstered the
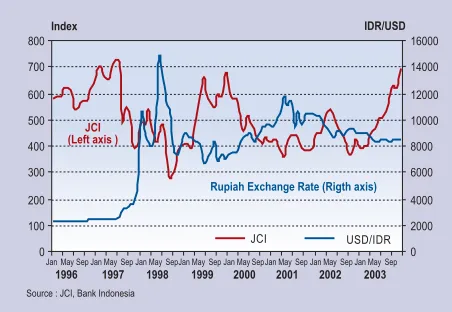
financial system. This was marked by rising inflows of
portfolio investment, which boosted the composite stock
price index to the level of 691.90 at end of 2003, up
266.955 points compared to end of 2002 (Chart II.5).
The rise in capital flows also triggered vigorous bond
trading, as indicated by increased trading frequency
during 2003, from 308 units in 2002 to 1,023 units in
2003 (source: CCIC).
The rupiah exchange rate was quite stable in 2003,
with a strengthening trend from Rp8,940 at end- 2002 to
Rp8,420 at the end of 2003. This was due to Indonesia»s
Improved balance of payments, declining domestic interest
rates and the USD depreciation against several world
currencies. This strengthening trend of the rupiah had
mixed benefits. On one side, it could reduce business
players» foreign currency risk exposure, but it could also
reduce exports, if not complemented by improved exporter
competitiveness. Lower exports have the potential to
reduce exporters» repayment capacity, which could impact
on the quality of bank credit.
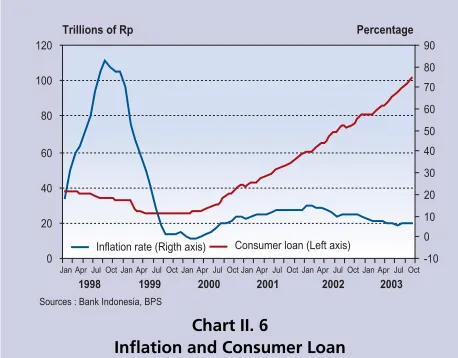
The inflation rate dropped from 10.0% during 2002
to 5.06% during 2003 (Chart II.6). The downward trend
in inflation along with lower interest rates on credits, have
boosted consumer credit, from Rp79.99 trillion as of
end-2002 to Rp101.60 trillion as of October 2003. This rise
needs to be watched closely, due its potential for putting
pressure on the quality of bank credit, if a decline in
economic growth were to occur.
In the future, improved international developments
and relatively easy domestic monetary policy are expected Table II.1
Indonesia»s Balance of Payments (Million of USD)
Curren Account Curren AccountCurren Account
Curren AccountCurren Account 7,8227,8227,8227,8227,822 7,8007,8007,8007,8007,800 5,020 5,020 5,020 5,020 5,020 Export 59,165 62,891 62,630 Import -35,653 -39,509 -40,945 Services -15,690 -15,582 -16,665 Capital Account
Capital AccountCapital Account
Capital AccountCapital Account -1,102-1,102-1,102-1,102-1,102 -2,554-2,554-2,554-2,554-2,554 -6,413-6,413-6,413-6,413-6,413 Goverment (Net) -190 -779 -1,641 Private (Net) -913 -1,774 -4,772 Total
TotalTotal
TotalTotal 6,7206,7206,7206,7206,720 5,2465,2465,2465,2465,246 -1,393-1,393-1,393-1,393-1,393 Monetary Movement
Monetary MovementMonetary Movement Monetary Movement
Monetary Movement -4,021-4,021-4,021-4,021-4,021 -4,209-4,209-4,209-4,209-4,209 2,3282,3282,3282,3282,328 Memorandum Items
Memorandum ItemsMemorandum Items Memorandum Items Memorandum Items International Reserve International ReserveInternational Reserve International Reserve
International Reserve 32,03732,03732,03732,03732,037 36,24636,24636,24636,24636,246 33,91833,91833,91833,91833,918 (Import month &
(Import month &(Import month & (Import month & (Import month & Govt» Foreign Debt) Govt» Foreign Debt) Govt» Foreign Debt) Govt» Foreign Debt)
Govt» Foreign Debt) 6.66.66.66.66.6 7.1 7.1 7.1 7.1 7.1 6.1 6.1 6.1 6.1 6.1
Component Component Component Component
Component 20022002200220022002 2003*2003*2003*2003*2003* 2004**2004**2004**2004**2004**
* Realization Estimate ** Estimate Source : Bank Indonesia
Chart II. 5 Developments of Composite Stock Price Index and Rupiah Exchange Rate
JCI USD/IDR
Source : JCI, Bank Indonesia
Rupiah Exchange Rate (Rigth axis) JCI
(Left axis )
1996 1997 1998 1999 2000 2001 2002 2003
0 2000 4000 6000 8000 10000 12000 14000 16000 0 100 200 300 400 500 600 700 800 Index IDR/USD
Chapter 2 Development of Domestic and International Economies Development Of Domestic
development. In particular, manufacturing grew by only
2.4%, down from 4% the year before. Nonetheless, this
did not disrupt the smooth flow of goods supply due to
imported goods, which dampened price increases.
However, in the long-term, business sectors whose
products cannot compete with imported products will have
difficulty surviving, which could create economic stagnation
or instability.
Meanwhile, implementation of a conservative and
cautious fiscal policy helped to lower inflation, which
greatly assisted with the maintenance of financial system
stability. In light of large payments of principal and interest
on the national debt, and to safeguard fiscal sustainability,
the government targeted its fiscal deficit within the
framework of accelerating the economic recovery. The
fiscal deficit in 2003 edged up compared to last year, from
1.7% of GDP in 2002 to 1.9% in 2003 (Table II.2). To
achieve a fiscal deficit 1.9% of GDP, the government took
a series of conducive policies, such as postponement of Chart II. 6
Inflation and Consumer Loan
to bolster the recovery of business activity in Indonesia»s
real sector. However, this needs to be followed by
conducive investment climate such as improved
infrastructure, secure security conditions, and elimination
of unofficial charges.
The modest rise in investment activity (1.6%) in 2003
had no meaningful impact on the economy»s production
capacity, because it was concentrated in property
Trillions of Rp Percentage
Inflation rate (Rigth axis) Consumer loan (Left axis)
Sources : Bank Indonesia, BPS
0 20 40 60 80 100 120 -10 0 10 20 30 40 50 60 70 80 90
1998 1999 2000 2001 2002 2003
Jan Apr Jul Oct Jan Apr Jul Oct Jan Apr Jul Oct Jan Apr Jul Oct Jan Apr Jul Oct Jan Apr Jul Oct
1. Government Revenues and Grants 1. Government Revenues and Grants 1. Government Revenues and Grants 1. Government Revenues and Grants
1. Government Revenues and Grants 301,874301,874301,874301,874301,874 300,188300,188300,188300,188300,188 336,156336,156336,156336,156336,156 17,317,317,317,317,3 342,812342,812342,812342,812342,812 137,204137,204137,204137,204137,204 343,876343,876343,876343,876343,876 17.217.217.217.217.2
a. Domestic Revenues 301,874 299,887 336,156 17,3 342,472 136,964 343,242 17.1
- Tax Revenues 219,628 210,954 254,140 13,1 248,470 108,807 271,023 13.5
- Non Tax Revenues 82,247 88,933 82,016 4,2 94,001 28,157 72,219 3.6
b. Grants 0 301 0 340 240 634 0.0
2. Government Expenditures 2. Government Expenditures 2. Government Expenditures 2. Government Expenditures
2. Government Expenditures 344,009344,009344,009344,009344,009 327,865327,865327,865327,865327,865 370,592370,592370,592370,592370,592 19,119,119,119,119,1 377,248377,248377,248377,248377,248 139,703139,703139,703139,703139,703 368,800368,800368,800368,800368,800 18.418.418.418.418.4
a. Central Government Expenditures 246,040 229,343 253,714 13,1 257,934 85,203 253,943 12.7
- Current Expenditure 193,741 189,072 188,584 9,7 191,788 70,993 185,842 9.3
- Development Expenditure 52,299 40,271 65,130 3,4 66,146 14,210 68,101 3.4
b. Regional Government Expenditures 97,969 98,522 116,878 6,0 119,314 54,499 114,856 5.7
- Balanced Budget 94,532 94,763 107,491 5,5 109,927 49,966 108,243 5.4
- Special Autonomy 3,437 3,759 9,387 0,5 9,387 4,533 6,613 0.3
3. Surplus/Deficit ( 1 - 2 ) 3. Surplus/Deficit ( 1 - 2 ) 3. Surplus/Deficit ( 1 - 2 ) 3. Surplus/Deficit ( 1 - 2 )
3. Surplus/Deficit ( 1 - 2 ) -42,135-42,135-42,135-42,135-42,135 -27,677-27,677-27,677-27,677-27,677 -34,436-34,436-34,436-34,436-34,436 (1,9)(1,9)(1,9)(1,9)(1,9) -34,436-34,436-34,436-34,436-34,436 -2,498-2,498-2,498-2,498-2,498 -24,923-24,923-24,923-24,923-24,923 (1.2)(1.2)(1.2)(1.2)(1.2)
4. Financing 4. Financing 4. Financing 4. Financing
4. Financing 42,13542,13542,13542,13542,135 27,67727,67727,67727,67727,677 34,43634,43634,43634,43634,436 1,91,91,91,91,9 34,43634,43634,43634,43634,436 -2,498-2,498-2,498-2,498-2,498 24,92324,92324,92324,92324,923 1.21.21.21.21.2
a. Domestic Financing 23,501 20,562 22,450 1,2 31,530 2,229 39,844 2.0
b. Foreign Financing 18,634 7,115 11,986 0,7 2,906 -4,727 -14,921 (0.7)
Budget 1) Budget 1) Budget 1) Budget 1)
Budget 1) Actual 2)Actual 2)Actual 2)Actual 2)Actual 2) 2002 2002 2002 2002 2002 % % % % % of GDP of GDP of GDP of GDP of GDP Budget-R 4) Budget-R 4)Budget-R 4) Budget-R 4) Budget-R 4) Budget 3) Budget 3) Budget 3) Budget 3)
Budget 3) Actual 2)Actual 2)Actual 2)Actual 2)Actual 2) Semester I Semester ISemester I Semester I Semester I Budget 3) Budget 3) Budget 3) Budget 3) Budget 3) %%%%%
of GDP of GDPof GDP of GDPof GDP
Notes:
1) Parliament approved budget. October 2001
Basic Assumptions : GDP growth = 3.5%, Inflation rate = 9.3%, exchange rate = Rp.9,600/US$, 3 month-SBI rate = 15%, oil price = US$24/barel 2) Preliminary figure
3) Budget approved by parliament
Basic Assumptions : GDP growth = 4%, Inflation rate = 9%, exchange rate = Rp.9,000/US$, 3 month-SBI rate = 13%, oil price = US$22/barel
2002 20022002 2002
2002 20032003200320032003 20032003200320032003
(Billion Rp)
Table II.2
fuel price hike increasing excise taxes. Looking ahead, it
will be very important to closely watch for pressures on
the state finances originating in the refinancing of domestic
indebtedness because maturing bonds will total Rp36.3
trillion in 2004. Also, repayments of foreign debt and
interest will rise by around 50% compared with 2003,
because the Paris Club rescheduling facility is no longer
available after the end of the IMF program. Financing of
the 2004 state budget deficit will rely upon domestic
sources, whereas heavy servicing of the foreign debt could
reduce Indonesia»s official foreign exchange reserves.
2.3 Development of the Real Sector
During 2003, the real sector did not recover much
despite various efforts, including a policy to reduce interest
rates. Indeed, there was a worrisome trend of business
relocations to other countries. This could boost the
unemployment rate and increase banks» NPLs, particularly
for consumer credits.
Several recent cases illustrate how investors will pull
back in the face of legal uncertainty. For example, the
divestment of Kaltim Prima Coal (KPC) and the Cemex
investment in Semen Gresik. In the KPC case, the
divestment of that mining company from the old foreign
investor (Rio Tinto and British Petroleum) to the domestic
investor was prolonged. This was caused by court decisions
as well as regional and central governments» reactions to
the ownership change, which was believed to conflict with
the original agreement.
Such cases cause investors to reconsider placing their
capital in Indonesia. During 2003, the amount of
long-term foreign investment √which is very important to
boosting economic recovery√ actually declined (as
mentioned, capital inflows were dominated by short-term
portfolio investment). This is one of the reasons why real
sector growth was limited, and unable to absorb additions
to the work force. Indeed, many workers were laid off as
companies cut back operations, closed, or relocated to
other countries. For example, at PT Dirgantara Indonesia
and Texmaco. In 2003, the unemployment rate rose to
9.8% of the overall work force. Such high unemployment
could disrupt economic stability, including in the financial
sector. Settlement of cases like those mentioned above
will be difficult without enhanced legal instruments.
Equally serious, it will be difficult to prevent similar cases
from occurring in the future. However, it will necessary to
continue making efforts in this direction in order to improve
Indonesia»s investment climate, as it continues to
deteriorate in investors» eyes.
Meanwhile, several business sectors experienced
disappointing growth and have uncertain prospects. These
sectors need to be closely monitored in order not to create
problems in the financial sector in the future. These sectors
include wood and wood products, property, textiles and
textile related industry.
Wood and forestry products are one of Indonesia»s
major exports. During 2003, a number of companies in
this industry experienced operational disruptions and many
closed down. The main reason for closure was limited raw
materials due to license tightening by the Ministry of
Forestry and increased illegal logging, much of which is
smuggled out of the country (Chart II.7). Also, many
charges imposed by governments (central and regional)
Chart II. 7
2002 Supply and Demand for Logs
2 0 0 2
Supply Demand Gap
Source: Ministry of Forestry
Thousands of mm3
Chapter 2 Development of Domestic and International Economies Development Of Domestic
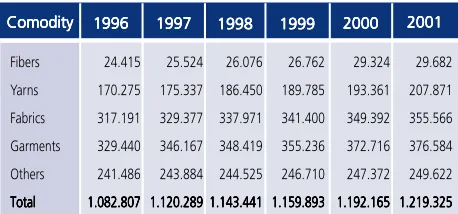
Table II.3 Number of Workers in Indonesia»s Textiles and Related Products Industry
Fibers 24.415 25.524 26.076 26.762 29.324 29.682 Yarns 170.275 175.337 186.450 189.785 193.361 207.871 Fabrics 317.191 329.377 337.971 341.400 349.392 355.566 Garments 329.440 346.167 348.419 355.236 372.716 376.584 Others 241.486 243.884 244.525 246.710 247.372 249.622
Comodity Comodity Comodity Comodity
Comodity 19961996199619961996 19971997199719971997 19981998199819981998 19991999199919991999 20002000200020002000 20012001200120012001
burden the wood industry. In the banking sector, credit
exposure to the wood and forestry industry is currently far
less than in the pre-crisis period, because large amounts
of banking credits to this industry were transferred to IBRA
during the crisis. Nonetheless, the condition of the wood
and forestry industry still has an influence on financial
stability, because credit exposure is still quite large and
many companies in the forestry and related industry have
issued shares and bonds in domestic and foreign markets.
One example is the Asia Pulp & Paper (APP) group, which
issued bonds amounting to USD12 billion. These have been
categorized as «default», and APP has been undertaking a
long restructuring process with its creditors.
Prospects for industries that use raw materials from
forestry are deteriorating. For 2004, it is estimated that 1
million workers will be laid off because of wood companies»
shutdowns, which would add to the large number of
unemployment in this country. International pressure on
Indonesia concerning compliance with proper
environmental rules (such as comprehensive logging plans,
including regreening) will raise operational costs of
domestic wood manufacturing, which will make them less
competitive in international markets. Therefore, it is
important for banks and financial institutions to prudently
and thoroughly calculate credit risk when channeling funds
to this industry.
Meanwhile, the property industry has experienced
very rapid growth, with the potential to generate an
oversupply, particularly in the commercial property sector
(Box II.1 : Will Property Become a Nightmare Again?).
In the textile area, China»s exports of textiles and
related products are very competitive due to conducive
economic policies, which include a low value of the Yuan
pegged to the USD; textile industry restructuring that has
reduced production costs; low interest rates on credits
(5%); and cheap labor due to an excess supply of workers
(Box II.2 : Rocketing China : Threat or Opportunity?). By
contrast, Indonesia»s production costs are high due to,
among others, high loading and unloading costs at ports;
illegal charges; high interest rates on credits; and a rising
cost of labor that has not been offset by improved
productivity. These developments represent a significant
challenge for the textiles industry (Table II.3).
Competition from China, (including products that are
either imported legally or smuggled) threaten to shutdown
some 3,250 small-to-medium scale businesses in the textile
and related products industry.1 In the future, with the plan
to end textile quotas by the US, European Union, and
Canada in 2005 as part of WTO agreements, Indonesian
exporters of textiles (which have been indirectly protected
to date by the quotas) will be in direct competition with
low-cost competitors such as China and Vietnam.
Based on the outlook for business in several of the
sectors mentioned above, it is necessary to review the
potential for rising unemployment due to layoffs and the
impact on banking credit, particularly consumer credits to
workers in these sectors.
Data of the Central Statistics Agency (BPS) indicate
that 4.13 million people were (openly)2 unemployed in
1996. By 2003, this number had more than doubled to
10.13 million people. The chairman of the Indonesian
Businessmen Association predicts mass layoffs in the
Chart Box 2.1.1
Development of Property Loan in Total Credits
Chart Box 2.1.2
Development of Property Sector»s Contribution to GDP
BoX II. 1
Will Property Become a Nightmare Again?
During 2003, the property business grew by
78%. This is an exceptionally high figure, especially
considering that after the 1997 crisis, the property
sector seemed to stall for several years. Such high
growth needs to be closely watched because
experience indicates that the property sector is risky
for the financial system.
In developing countries, the property sector plays
an important role, particularly in developing state
infrastructure. During the pre-crisis period, the
property sector in Indonesia contributed 7 √ 8% of
GDP, boosted by both government and private sector
spending. However, after the crisis, its contribution
dropped to 5 √ 6%.
Revival of the property sector since 2000 and its
rapid growth during 2003 are positive developments,
considering that property is a very cyclical business.
An interesting new development in the property area
is a shift in the financing structure, from mostly bank
loans to developers» equity and consumers» down
payment and installment payments. Banking credit
for the property sector in total has dropped, and now
is dominated by housing-ownership credits (KPR) and
apartment-ownership credits (KPA).
High NPLs in the property sector when the crisis
struck has made banks more cautious in channeling
credit to the property sector. Meanwhile, latest
developments show that leverage of the property
sector has tended to rise. This is indicated by the high
proportion of property industry financing coming from
outside the companies, particularly from individuals
or non-bank institutions. However, borrowing more
funds from non-bank sources does not mean that risk
is significantly less for the financial system, because
these funds are still suspected to end up in the financial
sector. Bit it does show that there is quite large
potential for banking funds to be channeled to the
property industry. On the other hand, this potential
could be a risk for financial stability should an
over-supply or a price bubble develop in this sector.
Symptoms of oversupply are already apparent in
several office buildings, on which construction is
complete but the space looks empty and there is
intense competition for tenants. The same is the case
in industrial areas where several tenants might relocate
to other countries, following indications that the
business climate has not improved to the standard
2001 2002 2003
0 50,000 100,000 150,000 200,000 250,000 300,000 350,000 400,000 450,000 8.5 9 9.5 10 10.5 11 11.5 12
Total Loan Share of Property Loan to Total Loan Poly. (Share of Property Loan to Total Loan)
GDP Share of Property Sector to GDP
0 1 2 3 4 5 6 7 8 9 10
1996 1997 1998 1999 2000 2001 2002 2003
Chapter 2 Development of Domestic and International Economies Development Of Domestic
Chart Box 2.1.3
Developments of Average Leverage and ROE at Several Property Companies
Chart Box 2.1.4
Average Supply and Occupancy Levels in Office Buildings in Jakarta and Surrounding Areas being set by competitor countries. If oversupply in the
property sector continues to rise next year, a price
bubble could develop, which could eventually trigger
a rise in NPLs such as occurred during the 1997 crisis.
Leverage (DER)-% ROE (%)
leverage ROE
Source : S